Electrochemical Migration of ENIG surface finish in Na
2SO
4Environment
Bálint Medgyes, Péter Szabó, Sándor Ádám, Lajos Tar, Miklós Ruszinkó and Richárd Berényi
Department of Electronics Technology, Budapest University of Technology and Economics
Budapest, Hungary medgyes@ett.bme.hu
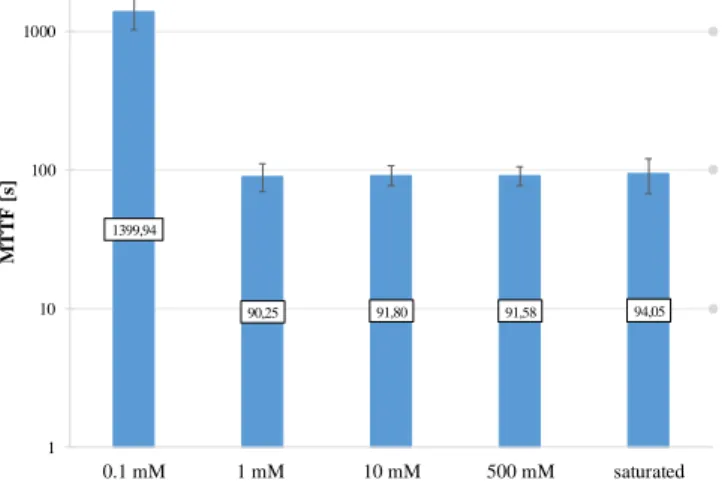
Abstract: The electrochemical migration (ECM) behavior of Electroless Nickel Immersion Gold (ENIG) surface finish was studied using Na2SO4 solutions with various concentrations. The investigations were carried out by water drop (WD) test. During WD test the electrochemical processes were followed by electrical and visual inspections. Based on the mean-time-to-failure (MTTF) data it was shown that MTTF increased at 0.1 mM Na2SO4 solution, then on higher concentrations MTTF significantly decreased and stabilized over the concentrations.
1.INTRODUCTION
In order to optimize the production processes of printed circuit board (PCB) assemblies, it can be found simulation studies [1, 2]. Even more reliability issues are published related to solder alloys or surface finishes used in PCB assemblies [3-9]. This reliability study focuses on a humidity induced failure mechanism called ECM.
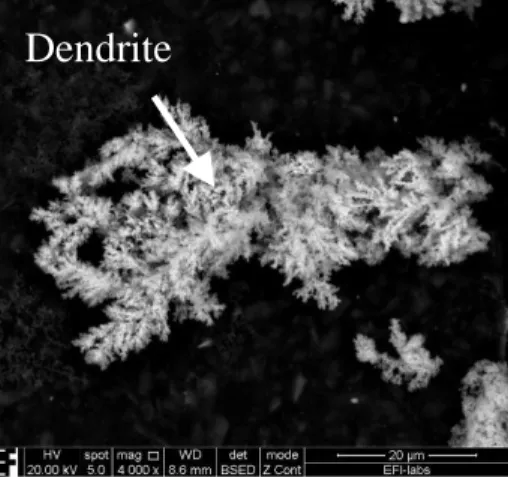
ECM is a possible manifestation of electrochemical corrosion mechanism, which may pose safety risk (electrical short) in the case of operating electronics. According to the literature many ECM models are exist [10] depending on the environmental factors (e.g.: contaminations) or the used surfaces finishes and (lead-free) solder alloys. During the short formation mechanism so called dendrites (See Fig 1) are growing usually from the cathode to the anode side. Many types of surface finishes that are commonly applied in the electronic assemblies have significant susceptibility for ECM, like Ag or Sn [11]. Furthermore, other surface finishes types like organic solderability preservative (OSP) or electroless nickel immersion gold (ENIG) are also investigated in NaCl solutions related to ECM [12].
The types of the tested electrolytes have also a wide range: deionized water, salt solutions and also acidic or alkaline solutions as a simulation of the contamination impacts [10-12].
Fig.1. Metallic dendrites formed a short.
For example sulfur as contamination can originate from the circuit assembling steps and also from the environment (the air has some sulfur content). Furthermore, sulfur has an impact on electrochemical migration processes as well. On the one hand, it is theoretical possible, that nickel and gold ions can bond to hydroxides [12] and also can bond to sulfate ions.
On the other hand, the impact of sulfate ions on nickel and on gold is not widely published related to ECM.
Furthermore, there are still many contradictory statements and results concerning to nickel and gold migration [12]. Therefore, in this study, various Na2SO4 solutions with five concentrations were applied as a simulation of the sulfur contamination effect applying ENIG surface finish.
2.MATERIALS AND METHODS
Bare copper layer was covered with electroless nickel and immersion gold surface finish on fiberglass-epoxy resin (FR4) substrate. The gap size between the conductor stripes on the test board was 0.2 mm, while the width of the conductor stripes was 0.4 mm (See the structure of the test pattern in Fig. 2).
Fig. 2. Comb structure of the ENIG test pattern.
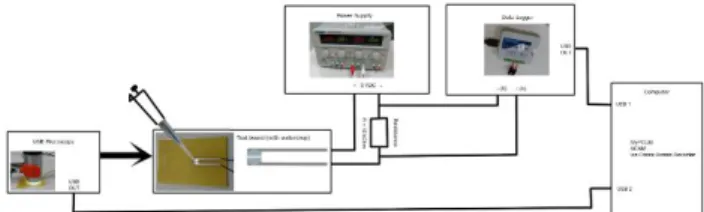
The measuring set up follows the various ECM processes by visually (in-situ) using an USB-microscope and also by a voltage measurement applying a Novus MyPcLab data logger. The real-time voltage measurement indicates the short circuit formation mechanism (e.g. dendrite growth) and help to understand the optical results as well (See Fig. 3).
Fig. 3. Arrangement of the test set up for ECM inspection.
Before each investigation, the ENIG surface finishes were washed out with isopropyl alcohol (IPA) water, degreased with deionized water (DI) secondly, and dried in normal conditions. The test solution was Na2SO4 in aqueous media with five concentration levels (0.1 mM, 1 mM, 10 mM, 500 mM and saturated soultion), which was prepared from analytical grade reagents and DI water (18.2 MΩcm).
In each WD test a volume of 10 µl droplet was placed onto and between the ENIG conductor lines. During the droplet placement it was always tried covering the same active area. Every WD tests were done at least ten times from the reproducibility point of view. Normal distribution was supposed while Mean-Time-To-Failure (MTTF) and deviations (1 σ) were originated from the electrical measurements. the first significant voltage jump was the main indicator for the failure events caused by ECM (See Fig. 4).
Fig. 4. Example for the failure criterion during WD test.
After the WD tests, the formed dendrites and precipitates were investigated by (FEI Inspect S50) Scanning Electron Microscopy (SEM) and (Bruker Quanta) Energy Dispersive X-ray spectroscopy (EDX) methods.
3.RESULTS AND DISCUSSION
3.1 Results of WD test in case of 0.1 mM Na2SO4 solution
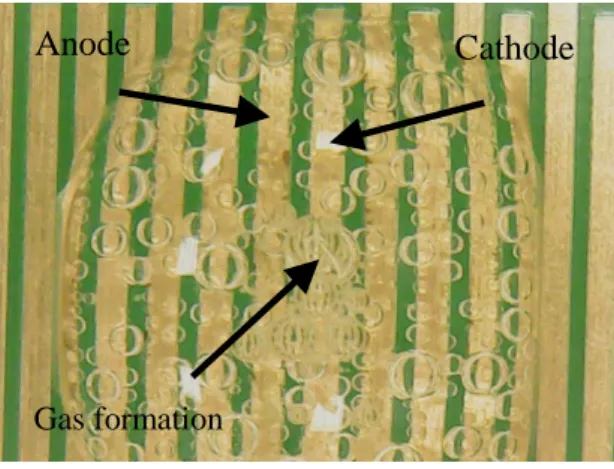
In Figure 5, a typical picture from WD test under biased can be seen. In all cases many (H2) gas bubbles were observed originated from the cathode side.
Fig. 5. ENIG surface finish under WD test.
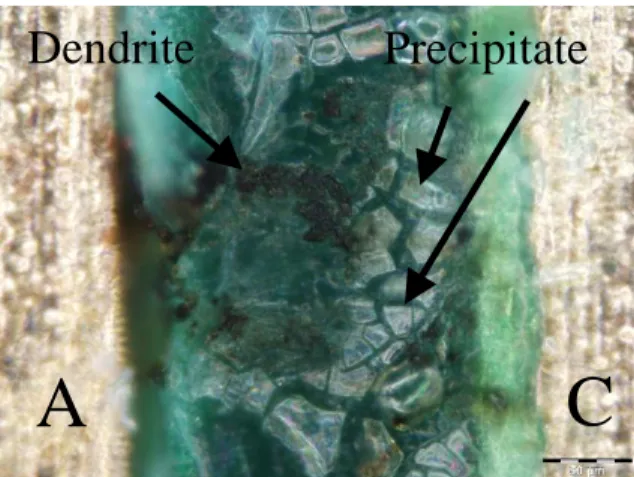
During the real-time electrical measurements the base value was 5.5 VDC and all of the samples were failed due to ECM. The calculated MTTF value was around 1400 sec. This value was 25 times higher comparing to non-solder mask (pure FR4) case. According to the optical microscopy investigations blue-green colored precipitates were detected next to dark dendrites (Fig. 6).
Anode Cathode
Gas formation
Fig. 6. Dendrites and green-blue colored precipitates were formed during the WD test.
After optical inspection SEM and EDX analysis were carried out to see the structure of the dendrites (See Fig. 7) and collect date from elemental composition point of view. Table 1 contains the EDX date from Fig. 7 and 8.
Fig. 7. SEM image of a dendrite and the spot were the data collected during EDX measurement in case of 0.1 mM.
Fig. 8. SEM image of a precipite and the spot were the data collected during EDX measurement in case of 0.1 mM.
According to the SEM investigations, the dendrites were grown in fibrous form in case of 0.1 mM and Cu was dominated during the ECM processes (Table 1).
Precipitate Dendrite
A
Dendrite Precipitate
C
Table 1. EDX results from the dendrite (Fig. 7) and precipitate (Fig. 8) in case of 0.1mM Na2SO4 after WD test.
O P S Ni Cu Au
Pre. at% 54 1.5 1 9.5 34 -
wt% 24 1 1 15 59 -
Dend-rite at% 2.5 - - 3.5 94 -
wt% 0.6 - - 3.4 96 -
3.2. Results of WD test in case of 1 mM Na2SO4 solution
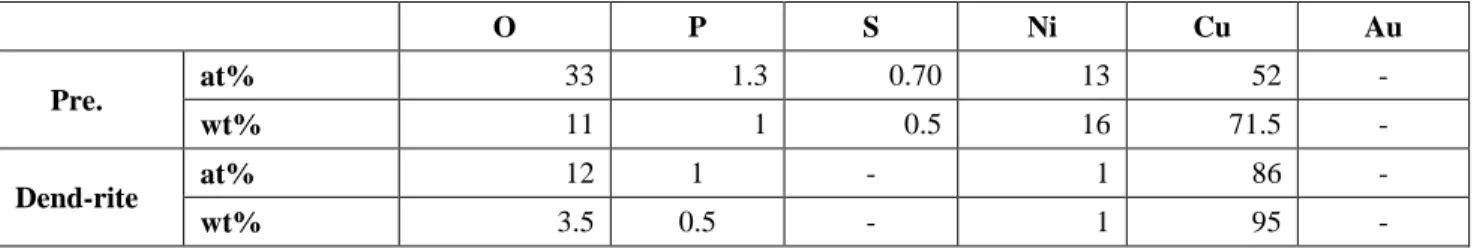
An intensive gas evolution was also observed during WD test and base voltage value was increased up to 6.3 VDC. Meanwhile, the calculated MTTF value was significantly decreased down to around 90 sec. The shape of the dendrite was changed into ball-like or tuberous-like types, while the green-blue precipitates were similar to the 0.1mM case.
Fig. 9. SEM image of a dendrite and the spot were the data collected during EDX measurement in case of 1 mM.
Fig. 10. SEM image of a precipite and the spot were the data collected during EDX measurement in case of 1 mM.
Table 2. EDX results from the dendrite (Fig 9) and precipitate (Fig 10) in case of 1mM Na2SO4 after WD test.
O P S Ni Cu Au
Pre. at% 33 1.3 0.70 13 52 -
wt% 11 1 0.5 16 71.5 -
Dend-rite at% 12 1 - 1 86 -
wt% 3.5 0.5 - 1 95 -
Precipitate
Dendrite
3.3 Results of WD test in case of 10 mM Na2SO4 solution
In this case, also many gas bubbles were observed during WD test and base voltage value was increased up to 6.6 VDC. Meanwhile, the calculated MTTF value was around 92 sec, so it was not changed significantly. The shape of the dendrite was changed into fibrous types (See Fig. 11), which was very similar to the 0.1 mM case, while the green-blue precipitates remained (Fig. 12).
Fig. 11. SEM image of a dendrite and the spot were the data collected during EDX measurement in case of 10 mM.
Fig. 12. SEM image of a precipite and the spot were the data collected during EDX measurement in case of 10 mM.
Table 3 contains the EDX date from Fig. 11 and 12.
Table 3. EDX results from the dendrite (Fig 11) and precipitate (Fig 12) in case of 10 mM Na2SO4 after WD test.
O P S Ni Cu Au
Pre. at% 73 1. 5 1.5 19 5 -
wt% 45 2.5 1.5 35 15 -
Dend-rite at% 20 - - 1 79 -
wt% 6 - - 1 93 -
3.4 Results of WD test in case of 500 mM Na2SO4 solution
In this case, also many gas bubbles were observed during WD test and base voltage value was increased up to 6.7 VDC. Meanwhile, the calculated MTTF value was around 92 sec, so it was not changed significantly. The shape of the dendrites was not seen due to the thick salt a precipitate layers and the color of the precipitate was change into white one (Fig. 13).
Precipitate
Dendrite
Fig. 13. White colored salt and precipitate after WD test in case 500 mM Na2SO4. 3.5 Results of WD test in case of saturated Na2SO4 solution
On the one hand, in case of the saturated solution a massive salt cover layer was formed. On the other hand the MTTF (94 sec) and base voltage (6.7 VDC) values were not significantly changed.
After removing the thick salt layer from the surface (See Fig. 14), SEM-EDX investigations were repeated.
Based on the EDX results a relative high Ni content (16 at% and 38 wt%) was detected, meanwhile the Cu content was significantly lower (1 at% and 3 wt%).
Fig. 14. SEM image from the surface after WD test and removment of the salt layer in case of saurated solution.
Fig. 15. Comparison of the MTTF values over Na2SO4 concentrations in case of ENIG surface finish.
1399,94
90,25 91,80 91,58 94,05
1 10 100 1000
0.1 mM 1 mM 10 mM 500 mM saturated
MTTF [s]
A
Precipitate
C
4.CONCLUSIONS
The ECM behavior of ENIG surface finish was studied using Na2SO4 solutions with various concentrations.
Based on the MTTF data it was shown that ECM susceptibility was decreased at 0.1 mM Na2SO4 solution, then on higher concentrations ECM ability significantly increased and stabilized over the concentrations (10mM, 500mM and saturated solutions).
ACKNOWLEDGEMENTS
The work reported in this paper was supported by the János Bolyai Research Scholarship of the Hungarian Academy of Sciences. The authors would like to thank to the Pro Progressio Foundation (Hungary) as well as for the EFI-labs.
REFERENCES
[1] P. Martinek, G. Kiss, Cs. Nagy, B. Szikora, "System Modelling and Simulation in Manufacturing Processes", 5th International Symposium on Intelligent Manufacturing Systems: Agents and virtual worlds. Sakarya, Turkey, 2006.
[2] O. Sviszt, P. Martinek, B. Szikora, "Typical features of printed circuit board production enterprise resource planning systems", 28th IEEE ISSE Conference, Wiener Neustadt, Austria, 2005. pp. 284-287.
[3] P. Harant, F. Steiner, "Solderability of lead-free surface finished PCB", 30th IEEE ISSE Conference, Cluj-Napoca, Romania, 2007, pp. 388-392.
[4] O. Krammer, B. Varga, K. Dušek, "New method for
determining correction factors for pin-in-paste solder volumes", Soldering & Surface Mount Technology. Vol. 29, No 1, 2017, pp. 2-9.
[5] M. Hirman. F. Steiner. "A comparison of the shear strength of conductive adhesives and soldering alloys", 38th IEEE ISSE Conference, Eger, Hungary, 2015, pp. 167-172.
[6] O. Krammer, B. Gyarmati, A. Szilágyi, R. Storcz,
L. Jakab, B. Illés, A. Géczy, K. Dušek, "Investigating the thixotropic behaviour of Type 4 solder paste during stencil printing", Soldering & Surface Mount Technology, Vol. 29. No. 1. 2017. pp.10-14.
[7] M. Fridrichovsky. F. Steiner. M. Hirman. "Comparison of the characteristics of PCB protective coatings." 40th ISSE Conference, Sofia, Bulgaria, 2017. pp. 1-6.
[8] Horváth. T. Shinohara. B. Illés. "Corrosion Properties of Tin-Copper Alloy Coatings in Aspect of Tin Whisker Growth". Journal of Alloys and Compounds. Vol. 577, 2013. pp. 439-444.
[9] A. Géczy, B. Illés, Zs. Illyefalvi-Vitéz, "Modeling Method of Heat Transfer During Vapour Phase Soldering Based on Filmwise Condensation Theory", Internatioal Journal of Heat and Mass Transfer. Vol. 67. 2013. pp. 1145-1150.
[10] G. Harsányi, "Electrochemical Processes Resulting in Migrated Short Failures in Microcircuits". IEEE Transactions on components. packaging. and manufacturing technology-part A, Vol. 18, No. 3, 1995, pp. 602-610.
[11] X. Zhong, G. Zhang, Y. Qiu. Z, Chen. W, Zou. X. Guo, "In situ study the dependence of electrochemical migration of tin on chloride", Electrochemistry Communications, Vol. 27, 2013, pp. 63–68.
[12] B. Medgyes, “Electrochemical migration of Ni and ENIG surface finish during Environmental test contaminated by NaCl”, Journal of Materials Science: Materials in Electronics, Vol. 28, No. 20, 2017, pp. 18578-18584.