1 2 3 4 5 6 7 8 9 10 11 12 13 14 15 16 17 18 19 20 21 22 23 24 25 26 27 28 29 30 31 32 33 34 35 36 37 38 39 40 41 42 43 44 45 46 47 48 49 50 51 52 53 54 55 56 57
58 59 60 61 62 63 64 65 66 67 68 69 70 71 72 73 74 75 76 77 78 79 80 81 82 83 84 85 86 87 88 89 90 91 92 93 94 95 96 97 98 99 100 101 102 103 104 105 106 107 108 109 110 111 112 113 114 doi: 10.3389/fcell.2020.575227
Edited by:
Claudia Tanja Mierke, Leipzig University, Germany Reviewed by:
Shihuan Kuang, Purdue University, United States Rosario Donato, University of Perugia, Italy
*Correspondence:
Aniko Keller-Pinter keller.aniko@med.u-szeged.hu
†These authors contributed equally to this work
Specialty section:
This article was submitted to Cell Adhesion and Migration, a section of the journal Frontiers in Cell and Developmental Biology Received:22 June 2020 Accepted:17 August 2020 Published:xx August 2020 Citation:
Becsky D, Szabo K, Gyulai-Nagy S, Gajdos T, Bartos Z, Balind A, Dux L, Horvath P, Erdelyi M, Homolya L and Keller-Pinter A (2020) Syndecan-4 Modulates Cell Polarity and Migration by Influencing Centrosome Positioning and Intracellular Calcium Distribution.
Front. Cell Dev. Biol. 8:575227.
doi: 10.3389/fcell.2020.575227
Syndecan-4 Modulates Cell Polarity and Migration by Influencing
Centrosome Positioning and
Intracellular Calcium Distribution
Daniel Becsky1†, Kitti Szabo1†, Szuzina Gyulai-Nagy1, Tamas Gajdos2, Zsuzsa Bartos3, Arpad Balind4, Laszlo Dux1, Peter Horvath4, Miklos Erdelyi2, Laszlo Homolya3and Aniko Keller-Pinter1*
1Department of Biochemistry, Faculty of Medicine, University of Szeged, Szeged, Hungary,2Department of Optics and Quantum Electronics, Faculty of Science and Informatics, University of Szeged, Szeged, Hungary,3Institute of Enzymology, Research Centre for Natural Sciences, Hungarian Academy of Sciences Center of Excellence, Budapest, Hungary,4Institute of Biochemistry, Biological Research Centre, Hungarian Academy of Sciences, Szeged, Hungary
Efficient cell migration requires cellular polarization, which is characterized by the formation of leading and trailing edges, appropriate positioning of the nucleus and reorientation of the Golgi apparatus and centrosomes toward the leading edge.
Migration also requires the development of an asymmetrical front-to-rear calcium (Ca2+) gradient to regulate focal adhesion assembly and actomyosin contractility.
Here we demonstrate that silencing of syndecan-4, a transmembrane heparan sulfate proteoglycan, interferes with the correct polarization of migrating mammalian myoblasts (i.e., activated satellite stem cells). In particular, syndecan-4 knockdown completely abolished the intracellular Ca2+ gradient, abrogated centrosome reorientation and thus decreased cell motility, demonstrating the role of syndecan-4 in cell polarity.
Additionally, syndecan-4 exhibited a polarized distribution during migration. Syndecan-4 knockdown cells exhibited decreases in the total movement distance during directional migration, maximum and vectorial distances from the starting point, as well as average and maximum cell speeds. Super-resolution direct stochastic optical reconstruction microscopy images of syndecan-4 knockdown cells revealed nanoscale changes in the actin cytoskeletal architecture, such as decreases in the numbers of branches and individual branch lengths in the lamellipodia of the migrating cells. Given the crucial importance of myoblast migration during embryonic development and postnatal muscle regeneration, we conclude that our results could facilitate an understanding of these processes and the general role of syndecan-4 during cell migration.
Keywords: syndecan-4, proteoglycan, cell polarity, super-resolution microscopy, actin, calcium, centrosome, cell migration
INTRODUCTION
Cell migration is a fundamentally important factor in various physiological and pathological processes, including morphogenesis, immune surveillance, tissue regeneration, and cancer cell metastasis (Ridley et al., 2003). Cell motility and directed migration require the establishment of cell polarization, defined as the formation of distinct front and rear cellular areas. This process is characterized by the emergence of an actin-mediated lamellipodial membrane protrusion, which
115 116 117 118 119 120 121 122 123 124 125 126 127 128 129 130 131 132 133 134 135 136 137 138 139 140 141 142 143 144 145 146 147 148 149 150 151 152 153 154 155 156 157 158 159 160 161 162 163 164 165 166 167 168 169 170 171
172 173 174 175 176 177 178 179 180 181 182 183 184 185 186 187 188 189 190 191 192 193 194 195 196 197 198 199 200 201 202 203 204 205 206 207 208 209 210 211 212 213 214 215 216 217 218 219 220 221 222 223 224 225 226 227 228
forms the leading edge, as well as the development of a retracting tail. The leading edge protrusions depend on polarized intracellular signaling processes. Polarization is also defined by the positioning of the cell nucleus and reorientation of the Golgi network and microtubule organizing center toward the leading edge (Vicente-Manzanares et al., 2005;Zhang and Wang, 2017). Cell motility is orchestrated by the formation of integrin-dependent adhesions to the surrounding matrix and the detachment of these adhesions from distinct regions at the rear of the cell (Lauffenburger and Horwitz, 1996;Ridley et al., 2003).
These mechanisms direct the cell motility cycle and are required for cell migration in response to various factors. However, the mechanism by which this motility system integrates extracellular signals with cell polarity and cytoskeletal remodeling to promote directionally persistent migration remains unclear.
Calcium (Ca2+) has been identified as an essential factor in cell migration. Ca2+ forms an increasing front–rear gradient that is involved in the disassembly of focal adhesions and, consequently, the rear-end retraction and the movement of the cell. This essential front–rear polarity is maintained by restricting the spontaneous formation of lamellipodia at the trailing edges of migrating cells (Tsai et al., 2015; Kim et al., 2016). The steering of membrane protrusions is directed by a localized Ca2+ influx created by stretch-activated Ca2+ channels in the front of a migrating cell, whereas other types of Ca2+ influx have been reported to mediate the detachment of rear protrusions (Kim et al., 2016). However, previous reports describing the coordination of cell migration by the Ca2+ gradient have provided limited insights into cell motility and the formation of these gradients.
Syndecans are a family of four transmembrane proteoglycans, each of which comprises a variable N-terminal ectodomain, a highly conserved short transmembrane and a C-terminal cytoplasmic domains (Zimmermann and David, 1999). Three syndecans are distributed in a tissue-specific manner (Xian et al., 2010;Elfenbein and Simons, 2013): syndecan-1 is mainly present in epithelial cells, syndecan-2 is expressed in mesenchymal cell types and developing neural tissues, whereas syndecan-3 is present in neural tissues and the developing musculoskeletal system. In contrast, syndecan-4 is expressed ubiquitously (Xian et al., 2010). Usually, the ectodomains of syndecans contain three heparan sulfate chains attached to a serine residue via tetrasaccharide linkers (Carey, 1997), although syndecan-1 and syndecan-3 possess additional chondroitin sulfate chains.
The interactions of the ectodomain with extracellular matrix molecules, fibronectin, matrix metalloproteinases, growth factors and other cell surface receptors (e.g., integrins) activate downstream signaling pathways. The cytoplasmic domain comprises a variable region unique to each member of the syndecan family, as well as two conserved regions that interact with four-point-one, ezrin, radixin, and moesin (FERM) proteins;
Src kinase; and cortactin (Granes et al., 2003). In syndecan-4, the variable region binds and activates the catalytic domain of protein kinase Cα(PKCα) (Koo et al., 2006), as well as directly bindsα-actinin in a beta-integrin-independent manner (Greene et al., 2003). The ability of syndecan-4 to link the extracellular matrix and cytoskeleton enables this proteoglycan to contribute
to several outside-in and inside-out signaling events, such as the sequestration and concentration of matrix components, as well as effects on cell–matrix adhesion, endocytosis, exosome biogenesis or cytokinesis (Keller-Pinter et al., 2010;Elfenbein and Simons, 2013;Afratis et al., 2017). Syndecan-4 also regulates the activity of the small GTPase Rac1 (Bass et al., 2007;Keller-Pinter et al., 2017) and the level of intracellular Ca2+(Liu et al., 2012;Gopal et al., 2015), and contributes to the phosphorylation of focal adhesion kinase (FAK) (Wilcox-Adelman et al., 2002).
Syndecans play an important role in tissue regeneration (Chung et al., 2016). For example, the skeletal muscle is renewed constantly in response to injury, exercise or muscle diseases. During the repair process, activated stem (i.e., satellite) cells form myoblasts that proliferate, migrate to the injured site, differentiate and fuse into polynuclear myotubes (Schultz and McCormick, 1994; Hawke and Garry, 2001). Syndecan- 4 is a cell surface marker of both quiescent and proliferating satellite cells (Cornelison et al., 2001). Although syndecan- 4 knockout mice cannot regenerate damaged muscle tissue (Cornelison et al., 2004), the details of the underlying mechanism remain unknown. Previously, we reported that syndecan-4 affects myoblast proliferation by modulating myostatin signaling and the G1/S transition in cell cycle (Keller-Pinter et al., 2018), and directional persistence of random cell migration is affected by syndecan-4-mediated Tiam-1 expression and distribution (Becsky et al., 2020). In this study, we demonstrated that syndecan-4 knockdown induced nanoscale alterations in the lamellipodial actin fiber structure of migrating myoblasts.
Moreover, we found that syndecan-4 distributes asymmetrically during cell migration and determines cellular polarity by influencing the positioning of centrosomes and the development of the front–rear Ca2+ gradient. Although several previous reports have described a role for syndecan-4 in cell migration, here we present a super-resolution structure of the actin cytoskeleton. Moreover, this is the first report to describe the role of syndecan-4 in the development of the Ca2+gradient and centrosome positioning in a migrating cell.
MATERIALS AND METHODS Cell Culture and Plasmids
C2C12 mouse myoblast cells (ATCC; Manassas, VA, United States) were cultured in high-glucose Dulbecco’s modified Eagle’s medium containing 4.5 g/L glucose, 584 mg/L glutamine and 110 mg/L pyruvate (Corning, NY, United States) supplemented with 65 µg/mL gentamicin (Lonza, Basel, Switzerland), and 20% fetal bovine serum (Gibco/Thermo Fisher Scientific, Waltham, MA, United States). To achieve syndecan-4 knockdown, C2C12 cells were transfected stably with plasmids expressing short hairpin RNAs (shRNAs) specific for mouse syndecan-4 (shSDC4#1 and shSDC4#2) or a scrambled target sequence. The plasmids were obtained from OriGene (TR513122; Rockville, MD, United States) and targeted the following sequences: 5’-GAA CTG GAA GAG AAT GAG GTC ATT CCT AA-3’ (shSDC4#1), 5’-GCG GCG TGG TAG GCA TCC TCT TTG CCG TT-3’ (shSDC4#2) and 5’-GCA CTA
229 230 231 232 233 234 235 236 237 238 239 240 241 242 243 244 245 246 247 248 249 250 251 252 253 254 255 256 257 258 259 260 261 262 263 264 265 266 267 268 269 270 271 272 273 274 275 276 277 278 279 280 281 282 283 284 285
286 287 288 289 290 291 292 293 294 295 296 297 298 299 300 301 302 303 304 305 306 307 308 309 310 311 312 313 314 315 316 317 318 319 320 321 322 323 324 325 326 327 328 329 330 331 332 333 334 335 336 337 338 339 340 341 342
CCA GAG CTA ACT CAG ATA GTA CT-3’ (scrambled).
X-tremeGENE transfection reagent (Roche, Basel, Switzerland) was used for the transfection procedures. Transfected cells were then selected in medium containing 4 µg/mL puromycin (Sigma-Aldrich, St. Louis, MO, United States).
Time-Lapse Imaging of Live Cells
Cells were seeded into the reservoirs of 2-well cell culture silicon inserts at a density of 3 × 10⁴ cells/well (Ibidi, Martinsried, Germany). The inserts were designed to ensure directional cell migration, with a defined cell-free gap of 500µm. Upon cellular attachment, the medium was replaced with serum-reduced medium for 24 h to suppress cell division. After nuclear staining with Hoechst 33342 (0.5µg/mL) for 1 h and washing with PBS, the insert was removed and the migration of cells into the cell-free zone was screened. Time-lapse images were captured in 20 min intervals for 8 h at 37◦C and 5% CO2 using the PerkinElmer Operetta (PerkinElmer, Inc., Waltham, MA, United States) high- content imaging system with a 20×objective (20×long WD;
NA = 0.45, working distance: 7.8 mm; field of view: 675×509;
depth of focus: 4.6µm; optical xy resolution: 0.7µm).
Single-Cell Tracking of Cultured Myoblasts
Time-lapse microscopy was used to quantify the migratory parameters. Single cells were tracked manually from frame to frame using the ImageJ (National Institutes of Health, Bethesda, MD, United States)1and CellTracker2(Piccinini et al., 2016) software programs. Nuclear tracking was used to follow the migration of individual cells. Dying or damaged cells were excluded from the analysis. The length of total path, maximum distance from the origin, as well as the average and maximum cell speeds were calculated. The vectorial distance of migration (i.e., real shift of the cell) from the origin was also quantified. Individual migratory tracks into the cell-free zone were visualized.
Wound Scratch Assay
For the wound scratch assay, cells were grown in 6-well plates until they reached confluence. After 24 h incubation in serum- reduced medium, cell-free zones were created by scratching the cell layer with a P200 pipette tip. Images of the cell-free zone were captured immediately (0 h), 4 and 8 h after wounding, using a Leica DMi1 phase-contrast microscope (Leica Microsystems, Wetzlar, Germany). Between imaging periods, the cells were incubated at 37◦C and 5% CO2. The area of the cell-free zone was measured using Digimizer image analysis software (MedCalc Software bvba, Ostend, Belgium). The closure of the cell-free area was calculated as follows: (area of cell-free zone at t0h- area of cell-free zone at txh)/area of cell-free zone at t0h.
Fluorescence Staining
For fluorescence cytochemistry, the cells subjected to wounding were fixed at indicated time points, stained with fluorescence
1https://imagej.nih.gov/ij/
2http://celltracker.website/
markers, and studied to evaluate the migratory cells in the scratched area. For centrosome staining, cells were fixed with methanol 2, 4, and 6 h after scratching. After permeabilization with 0.5% Tween-20 (Sigma-Aldrich), the samples were blocked in 4% bovine serum albumin (BSA; Sigma-Aldrich), and stained with a mouse monoclonal anti-γ-tubulin antibody (1:200; Sigma- Aldrich) at 4◦C overnight, followed by incubation with an Alexa Fluor 488-conjugated anti-mouse secondary antibody (Jackson ImmunoResearch, Cambridgeshire, United Kingdom) a day later.
To visualize the actin filaments, cells subjected to the above- described scratch assay were fixed with a methanol-free 4%
formaldehyde solution (Thermo Fischer Scientific) 2 h after wounding. After permeabilization with 0.3% Triton X-100 (Sigma-Aldrich) and blocking in 4% BSA (Sigma-Aldrich), the actin filaments were stained with Alexa Fluor 647-conjugated phalloidin (A22287, Thermo Fisher Scientific).
For syndecan-4 immunostaining, myoblasts were fixed with 4% formaldehyde solution 2 h after wounding, permeabilized with 0.3% Triton X-100, and blocked with 1% BSA. Rabbit polyclonal anti-syndecan-4 primary antibody (immunogen:
synthetic peptide surrounding amino acid 184 of human syndecan 4; PA1-32485; Invitrogen, Carlsbad, CA, United States) was visualized with the appropriate Alexa Fluor 568-conjugated (Invitrogen), or Alexa Fluor 488-conjugated secondary antibody (Jackson ImmunoResearch, Cambridgeshire, United Kingdom) secondary antibody. For double immunostaining experiments, cells were fixed with 4% formaldehyde solution, permeabilized with 0.1% Triton X-100 and blocked with 3% BSA. Focal adhesions were marked with mouse monoclonal anti-FAK primary antibody (sc-271126; Santa Cruz Biotechnology, Dallas, TX, United States) and with Alexa Fluor 488-conjugated secondary antibody (Jackson ImmunoResearch, Cambridgeshire, United Kingdom). Thecis-Golgi network was stained by mouse monoclonal anti-GM130 antibody (610822; BD Biosciences, San Jose, CA, United States), and followed by incubation with CF568-conjugated secondary antibody (Biotinum, Fremont, CA, United States). Nuclei were counterstained with Hoechst 33258 (0.01 mg/mL, Sigma-Aldrich).
Quantification of Centrosome Positioning
The positions of centrosomes were analyzed to quantify cell polarity, based on a previous characterization of centrosome reorientation in response to a scratch (Etienne-Manneville and Hall, 2001). Anti-γ-tubulin-stained samples were inspected and imaged using a Nikon Eclipse Ti-E microscope frame (Nikon Instruments Inc., Melville, NY, United States) with epifluorescent illumination using 20×objective (Nikon Plan fluor 20×DIC N2, NA = 0.50). The images were analyzed using ImageJ software.
Two hours after wounding, only the migrating cells next to the scratched area were analyzed. For selected cells adjacent to the cell-free zone, the direction of migration was designated as perpendicular to the wound edge, the nucleus was set as the origin, and a 30◦circular sector facing the direction of wound closure was assigned. Centrosomes situated within this assigned area were scored as correctly oriented. To monitor the time
343 344 345 346 347 348 349 350 351 352 353 354 355 356 357 358 359 360 361 362 363 364 365 366 367 368 369 370 371 372 373 374 375 376 377 378 379 380 381 382 383 384 385 386 387 388 389 390 391 392 393 394 395 396 397 398 399
400 401 402 403 404 405 406 407 408 409 410 411 412 413 414 415 416 417 418 419 420 421 422 423 424 425 426 427 428 429 430 431 432 433 434 435 436 437 438 439 440 441 442 443 444 445 446 447 448 449 450 451 452 453 454 455 456
dependency of centrosome reorientation in different cell lines, the position of centrosomes was analyzed 2, 4, and 6 h after wounding in the 1st and 2nd row of myoblasts in the different cell lines along the wound edge based on the method described by Gotlieb et al. (1983). The position of centrosomes was considered
“toward” the wound edge (between the nucleus and the wound edge), “middle” (along the side the nucleus), or “away” (between the nucleus the monolayer behind the cells).
Super-Resolution dSTORM Imaging
Super-resolution direct stochastic optical reconstruction microscopy (dSTORM) measurements were performed using a custom-made inverted microscope based on a Nikon Eclipse Ti-E frame. After conditioning (through spatial filtering via fiber coupling and beam expansion), the applied laser beams were focused into the back focal plane of the microscope objective (Nikon CFI Apo 100 ×, NA = 1.49) to produce a collimated beam on the sample. The angle of illumination was then set through a tilting mirror mounted into a motorized gimbal holder and placed into the conjugate plane of the sample. All dSTORM images were captured under epi-illumination at an excitation wavelength of 634 nm (Thorlabs HL63133DG:
637 nm, Pmax = 170 mW in a Thorlabs TCLDM9 TE-Cooled mount set to 19◦C). The laser intensity was controlled via a Thorlabs LDC500 laser driver and set to an output of 2–
4 kW/cm2 on the sample plane. An additional laser (Nichia:
405 nm, Pmax = 60 mW) was used for reactivation. Images were captured using an Andor iXon3 897 BV EMCCD digital camera (512 pixels × 512 pixels; pixel size: 16 µm).
The size of the illuminated sample region was matched to the size of the detector, which determined the field of view (80 × 80 µm2). Typically, the frame stacks for dSTORM super-resolution images were captured at a reduced image size (i.e., crop mode). A fluorescence filter set (Semrock, LF405/488/561/635-A-000 dichroic mirror with a BLP01- 647R-25 emission filter) was used to select and separate the excitation and emission lights in the microscope. During measurements, the perfect focus system of the microscope was used to maintain focus on the sample at a precision level of < 30 nm. Immediately before measurement, the sample storage buffer was replaced with a GLOX switching buffer (van de Linde et al., 2011), and the sample was mounted on a microscope slide. During a typical imaging session, 20,000 frames were captured at an exposure time of 20 or 30 ms. The image stacks were analyzed using rainSTORM localization software (Rees et al., 2013) and reconstructed using the built-in Simple Histogram method with a super-pixel size of 13.33 nm.
The Thompson-precision (Thompson et al., 2002) and PSF size acceptance ranges were set to 0–35 nm and 0.7–1.5 pixels, respectively.
Nanoscale Analysis of the Actin Cytoskeletal Structure
After dSTORM imaging, phalloidin-stained samples were subjected to a nanoscale analysis of the actin cytoskeleton.
The dSTORM images of lamellipodial actin structures were
processed using ImageJ software. The super-resolution images were converted to grayscale, adjusted to a fixed threshold, and noise filtered. The ImageJ Skeletonize function was used to create binary skeletonized images. Then the Skeleton Analysis plugin was used to calculate the number of branches belonging to each skeleton in every image and to measure the length of each individual branch. To describe the difference between the cortical actin-rich region and the inner actin-depleted area of the lamellipodial actin network, three areas (each 126×124 px) were randomly selected in the external region (with a width of 350 px beneath the plasma membrane) and three in the inner, internal region of the lamellipodia. Then the average number of branches and average length of the individual branches were measured in each of these selected rectangles and compared.
Evaluation of Syndecan-4 Immunostaining
Wide-field fluorescence images of syndecan-4 immunostained samples were acquired by a Nikon Eclipse Ti-E microscope (Nikon Instruments Inc.) with 40 × (Nikon CFI Plan Fluor 40×, NA = 0.75) and 100×(Nikon CFI Plan Apo DM Lambda 100 × Oil, NA = 1.45) objectives, and pseudo-colored using ImageJ. The contours of the individual cells were drawn, and the average pixel intensity within the border of the cells were quantified following background correction. The intensity value of each pixel was measured within the selected area and the sum of the intensities was divided by the area of the cell to obtain the average syndecan-4 intensity value of the individual cells.
Furthermore, cells were partitioned into 4 quadrants considering the nucleus as the origin, a 90◦circular sector facing the direction of the wound closure was assigned, and the syndecan-4 signal intensity within this area was quantified.
Assessment of Intracellular Ca
2+Distribution
As control, scrambled and two syndecan-4-targeted myoblast cell lines were seeded onto glass 8-well chambered coverslips (ibidi GmbH, Gräfelfing, Germany) at 1×10⁴cells/well density and grown for 24 h in serum-reduced medium. The confluent cultures were scratched as described above and further incubated for 2 h. Subsequently, the cells were subjected to 2 µM Fluo- 4 AM and 3 µM Fura Red AM (Thermo Fisher Scientific) in serum-free D-MEM containing 50 µM Verapamil (Sigma) for 30 min at 37◦C and 5% CO2. Verapamil was included to block the activity of multidrug transporters hindering effective dye loading. After several thorough washing steps, the green (493–572 nm) and far red (609–797 nm) fluorescence images were simultaneously acquired at 488 and 458 nm excitations, respectively, using a Zeiss 710 LSM laser scanning fluorescence confocal microscope with a Plan-Apochromat 40×(N.A. = 1.4) oil immersion objective. The images were analyzed by ImageJ 1.49g software (National Institutes of Health, Bethesda, MD, United States). Ratio images were generated using the Ratio Plus Plug-in. For quantitative analysis, the Fluo-4 and Fura Red fluorescence intensities were determined along the axis of migrating cells starting from the leading edge. After background
457 458 459 460 461 462 463 464 465 466 467 468 469 470 471 472 473 474 475 476 477 478 479 480 481 482 483 484 485 486 487 488 489 490 491 492 493 494 495 496 497 498 499 500 501 502 503 504 505 506 507 508 509 510 511 512 513
514 515 516 517 518 519 520 521 522 523 524 525 526 527 528 529 530 531 532 533 534 535 536 537 538 539 540 541 542 543 544 545 546 547 548 549 550 551 552 553 554 555 556 557 558 559 560 561 562 563 564 565 566 567 568 569 570
correction, ratios of green and red fluorescence were calculated.
The slope of the intracellular Ca2+distribution was determined by least squares method.
Statistical Analysis
Differences between groups were analyzed using a one-way ANOVA, followed by the Scheffepost hoctest or Student’st-test.
GraphPad Prism 7.0 (GraphPad Software Inc., San Diego, CA, United States) was used for graphing and statistical analyses. The data are expressed as means + standard errors of the means.
Ap<0.05 was considered significantly different.
RESULTS
Syndecan-4 Knockdown Decreases Directional Cell Migration
Initially, we evaluated the expression of syndecan-4 in C2C12 myoblasts transfected stably with plasmids expressing shRNA specific for syndecan-4 (shSDC4#1 and SDC4#2 cell lines) using Western blotting technique. A more significant reduction in syndecan-4 expression was observed in shSDC4#1 cells vs.
shSDC4#2 cells, whereas the scrambled sequence had no effect on syndecan-4 level (Supplementary Figure 1).
We then measured the effect of syndecan-4 knockdown on directional migration in vitro into cell-free zones created using cell culture inserts for an 8 h period (Supplementary Movies 1–4). During this analysis, we observed significant decreases in the length of total movement, the vectorial distance, the maximum distance from the origin, as well as the average and maximum cell speeds in both the shSDC4#1 and shSDC4#2 cell lines (Figure 1A), whereas no significant difference was observed between the non-transfected and scrambled cell lines (Figure 1A). Moreover, we observed a greater reduction in migratory parameters in shSDC4#1 cells (Figure 1), consistent with the previous observation of greater syndecan-4 suppression in this line. An evaluation of the migratory tracks of individual cells depicts the positions of the x and y coordinates corresponding to the paths taken by each cell during the indicated time (as z; Figure 1B). The migratory tracks of highly motile control cells crossed each other in the middle of the cell-free zone (black area in the center of each image), whereas those of syndecan-4 knockdown cells hardly moved from the original x-y positions during the 8 h experimental period. We then prepared histograms to depict the percentages of cells within each velocity range (Figure 1C). Notably, the histograms of the non-transfected and scrambled cells formed bell-shaped curves, whereas those of both silenced cell lines exhibited a left-skewed distribution suggesting the higher ratio of less motile cells.
Representative images inFigure 2Adepict a scratch wound in a confluent culture at 0, 4, and 8 h. Quantification of the wound closures revealed a reduced closure of the cell-free zone in both syndecan-4 knockdown lines (Figure 2B). No significant difference was observed between non-transfected and scrambled cells (Figure 2B).
Syndecan-4 Affects the Nanoscale Architecture of the Actin Cytoskeleton, as Determined by Super-Resolution dSTORM
Cell motility is regulated by both extracellular factors and internal signaling mechanisms, including actin cytoskeletal remodeling.
As syndecan-4 plays a crucial role in the organization of the actin cytoskeleton (Baciu et al., 2000; Elfenbein and Simons, 2013;Cavalheiro et al., 2017), we evaluated actin filaments using wide-field fluorescence microscopy (Figures 3A,B,D,E,G,H,J,K) and single-molecule localization super-resolution dSTORM imaging (lower magnification: Figures 3A,D,G,J; higher magnification:Figures 3C,F,I,L). Notably, our super-resolution dSTORM images reveal the sub-diffraction structure of the actin cytoskeleton and enable a more sophisticated experimental comparison of control and syndecan-4 knockdown samples.
The reduced fluorescence background and enhanced resolution enabled visualization of the orientations and densities of individual actin bundles.
Next, wound scratch assays were performed to study the lamellipodial actin networks in migrating cells. To prove the migratory phenotype of the cells next to the cell- free zone, we stained the focal adhesions by anti-FAK antibody in the different cell lines, and FAK-stained focal adhesions were observed at the end of the stress fibers (Supplementary Figure 2). Interestingly, both the size and the number of focal adhesions decreased in syndecan-4 knockdown cells (Supplementary Figure 2). The cells next to the scratched areas were analyzed after actin filament labeling of the samples. For every sample, a panoramic map of individual wide-field fluorescence images was generated to cover the whole area of cell culture around the scratch wound (Supplementary Figures 3–6), and the lamellipodia of the migrating cells next to the wound were analyzed by dSTORM.
Representative areas of the panoramic maps are shown in Figures 3A,D,G,J. Notably, syndecan-4 silencing altered the organization of the actin cytoskeleton (Figure 3) by hindering the development of actin structures (Figures 3G–L). The non-transfected and scrambled cells exhibited well-developed actin filaments (Figures 3A–F), whereas this filamentous actin cytoskeletal structure was less pronounced, and the lamellipodial actin network was less organized in syndecan-4 knockdown cells (Figures 3G–L). Next, dSTORM images of the actin cytoskeleton were converted to binary images (Figure 4A) and analyzed further to quantify nanoscale changes in the actin network (Figure 4B). An analysis of binary images of the lamellipodial actin filaments (Figure 4A) revealed decreases in both the number of branches and the lengths of individual branches in the lamellipodial actin networks of syndecan-4 knockdown cells (Figure 4C).
As the binary images suggested the presence of an actin- depleted inner region some micrometers away from the leading edge in syndecan-4 knockdown cell lines, next we quantified the nanoscale changes of the cortical (external) and the inner area of the lamellipodial actin network in the cell lines (Figure 4D). Both the average number of
571 572 573 574 575 576 577 578 579 580 581 582 583 584 585 586 587 588 589 590 591 592 593 594 595 596 597 598 599 600 601 602 603 604 605 606 607 608 609 610 611 612 613 614 615 616 617 618 619 620 621 622 623 624 625 626 627
628 629 630 631 632 633 634 635 636 637 638 639 640 641 642 643 644 645 646 647 648 649 650 651 652 653 654 655 656 657 658 659 660 661 662 663 664 665 666 667 668 669 670 671 672 673 674 675 676 677 678 679 680 681 682 683 684 FIGURE 1 |The role of syndecan-4 in the directional migration of myoblasts.(A)Migration of non-transfected, scrambled, and syndecan-4-silenced (shSDC4#1 and shSDC4#2) C2C12 myoblasts to a cell-free zone was assessed after the removal of a cell culture insert. The total length of movement, maximum distance from the starting point, vectorial distance (i.e., real displacement of the cells), and the average and maximum cell speeds during directional migration are presented. The total duration of live cell microscopy was 8 h, at a frame rate of 3/1 h. Four independent experiments were conducted, with 60–87 cells/cell line and 5–6 fields of view/experiment. Data are presented as means + standard errors of the means; *p<0.05, **p<0.01, ***p<0.001, and ****p<0.0001.(B)Representative three-dimensional migration tracks. Different colors represent the total migrations of individual myoblasts; x and y axes: position of the cell (µm),z-axis: time (h).
(C)Histograms depict the distributions of cells from different lines according to cell speed (intervals of 0.05µm/min). The frequencies of cells from each line with average speeds within each interval were evaluated and are presented on they-axis.
branches (in each skeleton) and the lengths of individual branches decreased in the inner region as compared to the external region of the lamellipodia in syndecan-4 knock- down cells, indicating the inhomogeneous lamellipodial actin structure in these cells (i.e., actin-rich external region and actin- depleted inner area).
Syndecan-4 Affects Centrosome Positioning and Cell Polarity
Appropriate polarization of the cell (Lauffenburger and Horwitz, 1996), adequate positioning of the cellular compartments (Petrie et al., 2009), and dynamic reconstruction of the actin cytoskeleton (Gardel et al., 2010; Parsons et al., 2010) are required for efficient cell migration. As syndecan-4 silencing was shown to reduce myoblast migration, we next studied the polarization of syndecan-4 knockdown cells using centrosome localization, an indicator of cell polarity in migrating cells (Etienne-Manneville and Hall, 2001;Zhang and Wang, 2017). Specifically, the exact positions of the centrosomes were observed on immunostained samples obtained 2, 4, and 6 h after a wound scratch
assay (Figure 5A, Table 1, and Supplementary Figures 7–9).
Fluorescence images were captured after centrosome (anti-γ- tubulin) staining and used to generate panoramic maps of the entire scratched area (Supplementary Figures 7–9).
Two h after wounding, cells adjacent to the cell-free area were investigated using the nuclei as the points of reference (i.e., origins). The areas around the nuclei were divided into 30◦ sectors, and centrosomes located in the 30◦circular sector facing toward the cell-free area were considered properly oriented (Figure 5B). Figure 5C depicts the numbers of centrosomes in the various sectors from experiments involving the different cell lines. Notably, syndecan-4 knockdown was associated with significantly fewer centrosomes in the 30◦circular sector facing toward the cell-free zone, indicating an improper reorientation of the centrosomes in these cells (Figures 5C,D). In contrast, nearly all centrosomes of the scrambled and non-transfected cells were localized to this 30◦circular sector facing toward the cell-free area, indicating precise and proper regulation of centrosome positioning in these controls (Figures 5C,D). There was no significant difference between the non-transfected and scrambled cells (Figure 5D). To analyze the time dependency
685 686 687 688 689 690 691 692 693 694 695 696 697 698 699 700 701 702 703 704 705 706 707 708 709 710 711 712 713 714 715 716 717 718 719 720 721 722 723 724 725 726 727 728 729 730 731 732 733 734 735 736 737 738 739 740 741
742 743 744 745 746 747 748 749 750 751 752 753 754 755 756 757 758 759 760 761 762 763 764 765 766 767 768 769 770 771 772 773 774 775 776 777 778 779 780 781 782 783 784 785 786 787 788 789 790 791 792 793 794 795 796 797 798 FIGURE 2 |Syndecan-4 influences the closure of the cell-free zone.(A)Representative microscopy images taken 0, 4, and 8 h after the initiation of a wound scratch assay. Dashed lines indicate the position of the cell-free zone at 0 h. Scale bar: 200µm.(B)Quantification of the closure of the cell-free area in cultures of non-transfected, scrambled, and syndecan-4-silenced (shSDC4#1 and shSDC4#2) cells;n= 4 independent experiments. Data are shown as means + standard errors of the means; ****p<0.0001.
of centrosome reorientation, the position of centrosomes was studied 2, 4, and 6 h after wounding (Table 1). The number of centrosomes facing the wound edge increased in all cell lines during the 6 h period in both 1st and 2nd row. Analysis of centrosome position along the wound edge revealed that in 83%
of the scrambled cells in the first row the centrosomes were located toward the wound edge (between the nucleus and the wound edge) 2 h after wounding and 94% of the cells 6 h following wounding (Table 1). In contrast, only 25–27% of the syndecan-4 silenced cells presented centrosomes with “toward”
position 6 h after wounding. In scrambled cells, only a few number of cells exhibited “middle” (along the side the nucleus), or “away” (between the nucleus the monolayer behind the cells) localized centrosomes 6 h after scratching. Based on these results, the reorientation of centrosomes during migration is delayed in syndecan-4 knockdown cells.
Polarized Distribution of Syndecan-4 During Migration
The former experiments demonstrated that syndecan-4 influences cellular polarity indicated by the impaired centrosome positioning and migration properties of myoblasts. Next we examined the intracellular distribution of syndecan-4 in control (scrambled) and syndecan-4 silenced cell lines in wide-field fluorescence images. According to immunostaining experiments, the amount of syndecan-4, considering all fluorescence signal intensities, was significantly higher in control cells than in syndecan-4 silenced cell lines (Figures 6A,B). Syndecan-4 accumulates in the quadrant of the migrating cells facing the wounded area (Figure 6A) which points the direction of migration (Figure 6C). Comparing the amount of syndecan- 4 accumulated in the quadrant facing the wounded area (Figure 6C) to the total of syndecan-4 level of the cells did not depict significant difference between the cell lines (Figure 6D).
Based on these results, the distribution of syndecan-4 does not change as a result of silencing; only the total amount of syndecan-4 is lower in knockdown cells.
Since the wide-field images showed cytoplasmic syndecan-4 staining, next we performed confocal imaging. The representative confocal image (Figure 6E) depicts the weak cell membrane localization of syndecan-4 in a migrating cell. Since earlier we showed the co-localization of syndecan-4 with the anti- GM130 Golgi marker and syndecan-4 is a member of focal adhesions, next we tested the co-distribution of syndecan-4 with FAK and GM130 (Figures 6F,G). The observed localization of syndecan-4 in the focal adhesions andcis-Golgi (Figures 6F,G) can explain the vacuolar and punctate signals of syndecan-4 staining. Moreover, earlier we have shown that the phospho- (Ser179 in human, Ser183 in mouse) syndecan-4 accumulates in the cytoplasm during cytokinesis (Keller-Pinter et al., 2010).
Therefore, we cannot exclude, that the syndecan-4 signal in our migrating cells partially originates from the cytoplasmic phosphorylated form.
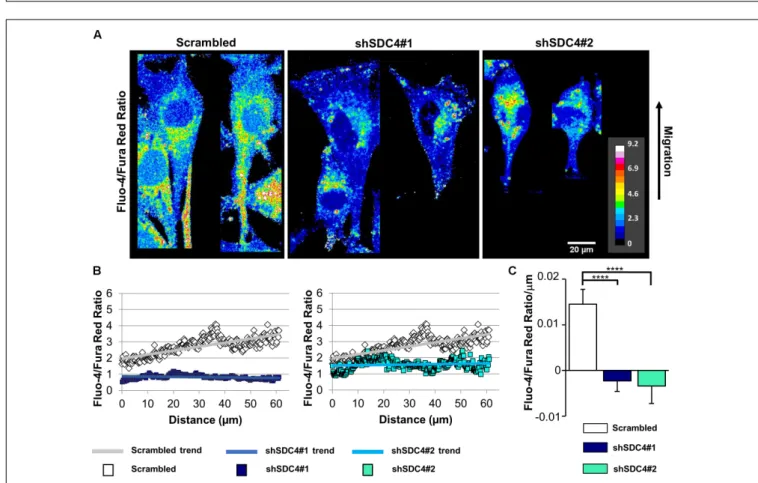
Syndecan-4 Knockdown Abrogates the Intracellular Ca
2+Gradient in Migrating Cells
Normally, migrating cells exhibit a gradual increase in Ca2+ levels along the axis of migration. Accordingly, we next assessed the distribution of intracellular Ca2+ in syndecan-4-silenced C2C12 cells and compered to that seen in cells transfected with a scrambled target sequence. The front–rear Ca2+distribution was studied in cells adjacent to the cell-free area in a scratch-wounded confluent culture (Figure 7A). As expected, the intracellular Ca2+concentration increased from the leading edge to the rear in control scrambled cells in (Figures 7B,C). In contrast, this Ca2+ gradient was completely abolished in syndecan-4-knockdown cells (Figures 7B,C). Since it has been reported that Fura Red
799 800 801 802 803 804 805 806 807 808 809 810 811 812 813 814 815 816 817 818 819 820 821 822 823 824 825 826 827 828 829 830 831 832 833 834 835 836 837 838 839 840 841 842 843 844 845 846 847 848 849 850 851 852 853 854 855
856 857 858 859 860 861 862 863 864 865 866 867 868 869 870 871 872 873 874 875 876 877 878 879 880 881 882 883 884 885 886 887 888 889 890 891 892 893 894 895 896 897 898 899 900 901 902 903 904 905 906 907 908 909 910 911 912 FIGURE 3 |Direct stochastic optical reconstruction microscopy (dSTORM) analysis of the actin cytoskeleton after syndecan-4 silencing. Representative wide-field
fluorescence and super-resolution dSTORM images depict the actin skeletons of the cells adjacent to the cell-free zone in cultures of non-transfected(A–C), scrambled(D–F), shSDC4#1(G–I),and shSDC4#2(J–L)cell lines. Confluent monolayers were subjected to wound scratching. The cells were fixed 2 h later, and the actin filaments were stained with Alexa Fluor 647-conjugated phalloidin (red). Wide-field fluorescence images were obtained around the cell-free zone (A,D,G,J, higher magnification:B,E,H,K). Full panoramic maps of the scratched areas are shown inSupplementary Figures 3–6. The insets of the wide-field fluorescence images depict dSTORM images of the lamellipodial regions of migrating cells adjacent to the cell-free zone(A,B,D,E,G,H,J,K).Representative dSTORM images of lamellipodial actin structures are embedded in the original low-magnification images (A,D,G,J; bar: 1 microm) or are shown in separate higher magnification panels (C,F,I,L). Nuclei are stained by Hoechst 33258 (blue).
tend to accumulate in the mitochondria (Thomas et al., 2000), we explored whether the punctate structures can be observed in the Ca2+ indicator-loaded cell are mitochondria. Either control or
syndecan-4-silenced cells exhibited distinct distribution for the Ca2+ indicators and the mitochondrial dye MitoTracker Deep Red (Supplementary Figure 10), demonstrating that neither
913 914 915 916 917 918 919 920 921 922 923 924 925 926 927 928 929 930 931 932 933 934 935 936 937 938 939 940 941 942 943 944 945 946 947 948 949 950 951 952 953 954 955 956 957 958 959 960 961 962 963 964 965 966 967 968 969
970 971 972 973 974 975 976 977 978 979 980 981 982 983 984 985 986 987 988 989 990 991 992 993 994 995 996 997 998 999 1000 1001 1002 1003 1004 1005 1006 1007 1008 1009 1010 1011 1012 1013 1014 1015 1016 1017 1018 1019 1020 1021 1022 1023 1024 1025 1026 FIGURE 4 |Skeletal analysis of dSTORM images of the lamellipodial actin network. The phalloidin-stained lamellipodial actin cytoskeletons of non-transfected,
scrambled, and syndecan-4-silenced (shSDC4#1 and shSDC4#2) cells were analyzed. Representative binary images converted from dSTORM images of the actin cytoskeleton are shown(A). Within the actin network, branching points divide the skeletons into smaller branches(B). The number of branches in the skeletons and the lengths of individual branches in the lamellipodial actin network in the whole binary images were quantified(C). To measure the differences between the external and the internal region of the lamellipodial actin network, the average number and length of branches were compared in randomly selected areas (three areas in both external and internal regions, each 126×124 pixels in size) of the binary images(D). Binary images of 5 cells/cell line were studied. Numbers of analyzed skeletons:
5,560–8,450/cell line; numbers of analyzed branches: 26,723–32,813/cell line. Number of analyzed skeletons in a single 126×124 pixels area: 2–69, number of analyzed branches in a single 126×124 pixels area: 32–336. Data are shown as means + standard errors of the means; *p<0.05, **p<0.01, ***p<0.001, and
****p<0.0001.
Fluo-4 nor Fura Red accumulated in the mitochondria in our experiments. To exclude the possibility that alteration in the green and red fluorescence ratios is due to redistribution of organelles, in which one Ca2+ indicator accumulated more than the other, we performed an analysis, in which high intensity pixels (2.5-fold over mean cellular fluorescence) were omitted. Similar results were obtained this way to that shown inFigure 7andSupplementary Figure 10, demonstrating that indeed the intracellular front-rear Ca2+gradient was diminished
by syndecan-4-silencing. In summary, our findings demonstrate the essential role of syndecan-4 in cell polarity.
DISCUSSION
Cell migration is an essential component of several physiological and pathological processes, including tissue regeneration.
During regeneration of the skeletal muscle tissue, myoblasts (i.e.,
1027 1028 1029 1030 1031 1032 1033 1034 1035 1036 1037 1038 1039 1040 1041 1042 1043 1044 1045 1046 1047 1048 1049 1050 1051 1052 1053 1054 1055 1056 1057 1058 1059 1060 1061 1062 1063 1064 1065 1066 1067 1068 1069 1070 1071 1072 1073 1074 1075 1076 1077 1078 1079 1080 1081 1082 1083
1084 1085 1086 1087 1088 1089 1090 1091 1092 1093 1094 1095 1096 1097 1098 1099 1100 1101 1102 1103 1104 1105 1106 1107 1108 1109 1110 1111 1112 1113 1114 1115 1116 1117 1118 1119 1120 1121 1122 1123 1124 1125 1126 1127 1128 1129 1130 1131 1132 1133 1134 1135 1136 1137 1138 1139 1140 FIGURE 5 |Syndecan-4 affects centrosome positioning during migration.(A)Representative wide-field fluorescence images of the studied cell lines depict the
positions of centrosomes 2 h after scratching. Anti-γ-tubulin-labeled centrosomes and Hoechst 33258-stained nuclei are shown in green and blue, respectively.
Arrows indicate the centrosomes.(B)Schematic representation of a polarized migratory cell. To quantify the positions of centrosomes, the nucleus was set as the origin, and centrosomes located in the 30◦circular sector facing toward the direction of wound closure were considered properly located.(C)Pie charts (i.e., polar histograms) show the localization of centrosomes in different cell lines. The plane was partitioned into 30◦circular sectors with the nucleus as the origin. The radius of each circular sector represents the number of cells with centrosomes located in that 30◦sector.N= 3 independent experiments. Thirty cells were analyzed per cell line.(D)Quantification of the results shown in(C). The graph presents the ratios of centrosomes in the 30◦sector facing the cell-free area. Data are shown as means + standard errors of the means; ***p<0.001.
activated satellite cells, skeletal muscle stem cells) proliferate, differentiate, migrate and fuse to form tubular, multi-nuclear myotubes. Accordingly, during muscle development and regeneration, myoblasts must be capable of migration to promote the cell–cell interactions and myoblast fusion required for muscle fiber formation. Syndecans, a family of transmembrane proteoglycans, have been reported to play crucial roles in tissue regeneration (Chung et al., 2016). We demonstrated previously that syndecan-4 could influence myoblast proliferation, as syndecan-4 silencing reduced cell
cycle progression from the G1 to the S phase and reduced the formation of mature myostatin, a negative regulator of muscle growth (Keller-Pinter et al., 2018). Syndecan-4 knockout mice also exhibited a decreased capacity for skin wound repair and angiogenesis (Echtermeyer et al., 2001), as well as inability to regenerate skeletal muscle following cardiotoxin-induced muscle necrosis (Cornelison et al., 2004).
In summary, syndecan-4 appears to play an essential role in skeletal muscle development and regeneration, although the exact mechanism underlying this phenomenon remains unclear