Robust Contact Angle Determination for Needle-in-Drop Type Measurements
Emőke Albert,
†Borbála Tegze,
†Zoltán Hajnal,
‡Dániel Zámbó,
‡,§Dániel P. Szekrényes,
‡András Deák,
‡Zoltán Hórvölgyi,
†and Norbert Nagy*
,‡†Department of Physical Chemistry and Materials Science, Budapest University of Technology and Economics, H-1521 Budapest, Hungary
‡Institute of Technical Physics and Materials Science, Centre for Energy Research, P.O. Box 49, H-1525 Budapest, Hungary
ABSTRACT: One of the main approaches for contact angle determination using sessile drops with a missing apex (e.g., because of the presence of the needle tip) is the polynomial drop-profile fitting method. The major disadvantage of this fitting procedure is that the derived contact angle is highly sensitive to the polynomial order and the number of pixels involved in the actualfit. In the present work, an easily implementable method is introduced to effectively tackle these drawbacks. Instead of fitting the drop-profile itself, the polynomial fitting is applied to the difference between the drop profile and the circumcircle, independently for both sides of the drop. The derivative value of this difference at the contact point is used to correct the slope
obtained analytically from the circumcircle. It is shown that this approach allows the robust determination of the contact angle with high (≤0.6°) accuracy in a straightforward manner, and the results are not affected by the actual contact angle, drop volume, or the resolution of the captured image. Validation of this new approach is also given in the contact angle range of 20°−
150°by comparing the results to the values calculated by the Young−Laplacefit.
1. INTRODUCTION
The determination of the contact angle formed along the solid−liquid−vapor contact line is an important surface characterization tool in research and in several fields of industry because of its relative simplicity and high sensitivity.
The most convenient and popular method of this family is the sessile droplet method. Advancing and receding contact angles can be measured stepwise by changing the drop volume, i.e., by the drop build-up method.1,2 The major limitation of this technique is that very low contact angles cannot be determined accurately.3The accuracy of contact angle measurements using sessile drops was improved drastically by the introduction of the axisymmetric drop shape analysis (ADSA)4 compared to the former simple and subjective alignment of the tangent of the drop profile at the contact point. In ADSA or latter in ADSA-P (ADSA-profile),5 the numerical solution of the Young−Laplace equation isfitted to the captured axisymmetric drop profile, knowing the physical properties of the test liquid.
A basically different approach is the theoretical image fitting analysis (TIFA). In this method, the theoretical two-dimen- sional image is fitted to the captured image of the sessile or pendant drop6instead of the theoretical one-dimensional curve of ADSA; therefore, the need of edge detection is avoided.
However, both approaches had limitations: the drop must be axisymmetric and the drop’s apex must be visible in the image.
Therefore, these methods cannot be applied in tilted plate or needle-in-drop experiments. Additionally, dynamic contact angles could be measured only by changing the drop volume
through a hole of the sample. This latter limitation led to the latest sophisticated developments of both methods. TIFA− axisymmetric interfaces (TIFA−AI)7 and ADSA-no apex (ADSA-NA)8can overcome the need of the apex. The major achievements of the consecutive generations of these methods can be overviewed in detail in the valuable review of Saad and Neumann.9
In order to overcome the limitation imposed by assumption of an axisymmetric shape, the high-precision drop shape analysis was introduced for evaluation of tilted plate experi- ments in 2013 by Schmitt and Heib.10Their method identifies the drop profile and the baseline with subpixel resolution and analyzes the left and right parts of the profile independently;
therefore, even strongly asymmetric drops can be evaluated.
The method was extended later to determine dynamic contact angles also on horizontal surfaces.11One of the unique aspects of this technique is the statistical approach applied during data evaluation, as the Gompertzian function isfitted to the contact angle as a function of the tilt angle or the volume change for horizontal surfaces. The individual data are averaged leading to an averaged overall Gompertzian function, which provides objective and reliable data.12The latest developments of this approach have been reviewed recently.13
Received: September 13, 2019 Accepted: October 2, 2019 Published: October 21, 2019
Article http://pubs.acs.org/journal/acsodf Cite This:ACS Omega2019, 4, 18465−18471
copying and redistribution of the article or any adaptations for non-commercial purposes.
Downloaded via WIGNER RESEARCH CTR FOR PHYSICS on November 9, 2019 at 19:09:00 (UTC). See https://pubs.acs.org/sharingguidelines for options on how to legitimately share published articles.
Several further approaches were developed for drop shape analysis. One ellipse14or two circles with the same tangent at the apex15can befitted to the whole projection of the drop or to the left and right arcs separated by the apex, respectively.
Double-sided elliptical fitting16 and cubic spline-based drop shape analysis17were also implemented and investigated. The accuracy of these approaches were investigated in statistical comparison, and it was found that it strongly depends on the drop volume and on the contact angle range.18 Furthermore, thefitted curve does not pass necessarily through the contact point where the contact angle should be determined. The
“drop snake”method based on spline interpolation is not able to evaluate images with the needle immersed in the drop.
Besides these methods, the polynomial fitting approach remained definitely popular because of its general usability and simplicity. However, it suffers from known drawbacks. The resultant contact angles are sensitive to the polynomial order and the number of pixel points to which the polynomial is fitted.19,20Various strategies have been followed to overcome these uncertainties and to improve the accuracy. One straightforward approach was to introduce the subpixel resolution of the profile using a sigmoid model21 or cubic spline fitting5,8 to the pixel intensity. Further improvement could be achieved based on the subpixel resolution by identification of the contact points as the intersection of the extrapolated drop profile and the baseline21 or as the intersection of the profile and its reflection.8 Atefi et al.
showed that only one single polynomial order or a definite (predefined) number of pixels cannot result in accurate contact angles even in the case of the applied subpixel resolution.22 Their differentiator mask chooses the polynomial order that has the longest stable contact angle regime as a function of the number of pixels. This method has an accuracy of <0.4° for contact angles below 60°. For larger values, the polynomial fitting in polar coordinates was introduced. The origin is translated to the apexfirst, and the coordinates of the profile are transformed from Cartesian to polar coordinates. There- fore, the slope of the boundary at the contact point is low for large contact angles. It results in the accuracy of <1° in the 40°−170°contact angle range. Unfortunately, the necessity of the apex appears here again; therefore, this approach is not appropriate for needle-in measurements.
In this work, an easily implementable and especially a robust method is introduced to determine contact angles in no-apex situations, that is, when the top part of the drop is not available for the image analysis procedure. The proposed approach combines the advantages of circular and polynomial fit concepts, while their uncertainties are suppressed. Circum- scribed circles are constructed independently for the left and right undisturbed parts of the drop profilewhich are not affected by the needle. The difference between the circumcircle and the captured profile is determined, and a polynomial is fitted to this difference. It has to be emphasized that because this small difference (<10 pixels) isfitted instead of the drop profile, the slope of the fitted curve does not change significantly with the actual value of the contact angle.
Therefore, the uncertainty from this component is also much lower. This approach has further advantages. It is an inherent property of the circumcircle that the arc passes exactly through the contact point, and its derivative can be calculated analytically. Furthermore, the method enables fast evaluation compared to, for example, numerical integration of the Laplace equation.
Hence, the proposed method can be useful in dynamic contact angle measurements23 and in captive bubble experi- ments on hydrophilic samples or in sessile drop measurements on hydrophobic surfaces with low contact angle hysteresis, i.e., when the needle is necessaryor it is convenientto hold the bubble or the drop in the right place. The evaluation of electrowetting24 and electrodewetting25 experiments can be also carried out with higher accuracy.
2. CONCEPT OF THE METHOD
The popularity of polynomial fitting remains unchanged in cases where the Young−Laplace fit cannot be applied. The uncertainty of the polynomial approach originates from two different factors, as it was written above. The major problem is that the appropriate polynomial order depends on the contact angle range. The other drawback is the sensitivity to the number of data points, i.e., the number of pixels.
The proposed, easily implementable method was developed to overcome these uncertainties. The key step is that two circumscribed circles are constructed for the two undisturbed parts of the drop profile. These two parts are evaluated independently (Figure 1). The circumcircle passes through the
three-phase contact point, the other endpoint of the profile’s part, and the point that is selected on the profile at the half of the maximum height. The center and the radius of the circumcircle can be determined easily using coordinate geometry. The derivative at the contact point can be calculated analytically
= −
− −
y x
x x
R x x
d
d ( )
circumcircle O CP
2
CP O2
(1) whereRis the radius of the circumcircle, andxOandxCPare the abscissa of the center of the circumcircle and the abscissa of the contact point, respectively.
A polynomial can be fitted to the difference between the circumcircle and the real drop profile as a function of the lateral distance (x) from the contact point (x = 0). This difference is quite small for low-volume droplets but it becomes larger for larger drops when the gravitational effect cannot be neglected. The effect of gravity is negligible when the Bond number is small: Bo =g·a2·Δρ/γ≪1, wheregis the Figure 1.Schematics of the circumcircle and the differencefitting method. The region of the profile is intentionally omitted, which is affected by the needle. Three points are selected from each resultant arc: the endpoints and the point at the half of the maximum height.
Circumscribed circles that pass through these points are constructed independently, and the polynomial isfitted to the difference between the circle and the profile as a function of the lateral distance (x) from the contact point (x= 0).
gravitational acceleration, a is the radius of the meniscus curvature, Δρ is the difference in mass densities of the two fluids, andγis the interfacial (surface) tension. The sixth-order polynomial was proved to be appropriate for all investigated contact angles and drop volumes. The derivative of this polynomial at the contact point gives a correction to the slope calculated for the circumcircle. Therefore, the contact angle value is calculated according to the following equation
i k jjjjj jjj
y { zzzzz zzz
ϑ = +
= =
y x
y arctan d x
d
d
x d x
circumcircle 0
polynomial
0 (2)
where ycircumcircle and ypolynomial are the equations of the respective parts of the circumcircle and the polynomial, respectively.
3. MATERIALS
In this work, ultrapure water (purified by a Millipore Milli-Q integral system, surface tension γ = 72.25 mN/m at 24 °C) with a resistivity of 18.2 MΩcm was used as the test liquid for all contact angle measurements.
Several different surfaces were selected for the validation based on their water contact angle. Microscope glass cover slides (Menzel-Gläser) were successively cleaned by 5 min ultrasonication in acetone, ethanol, and ultrapure water, and dried under gentlefiltered nitrogenflow (henceforth: glass). A stoichiometric silicon nitride was deposited on (100) silicon substrates by chemical vapor deposition in our cleanroom facility, and it was used as received (henceforth: Si3N4).
Thermal silicon dioxide was grown on the (100) silicon surface in our cleanroom facility, and it was used as received (henceforth: SiO2). The electron-beam evaporated gold film was prepared on the (100) silicon substrate, and the gold surface was modified by incubation in 1 mM aqueous solution of cysteamine molecules for 30 min followed by rinsing with ultrapure water (henceforth: Au-cys). An hexagonal closed- packed spherical nanovoid array prepared as in ref 26 was coated with a gold thin film by electron-beam evaporation (henceforth: Au-void). Microscope glass cover slides (Menzel- Gläser) were coated with a cyclo olefin polymer (Zeonex 480R) by spin-coating at 2000 rpm from a 5 wt % toluene solution (henceforth: Zeonex). A roughened polytetrafluoro- ethylene sheet was cleaned by rinsing with ethanol and ultrapure water and dried under filtered nitrogen flow (henceforth: rough polytetrafluoroethylene (PTFE).
A laboratory-built apparatus was used for the contact angle measurements; its detailed description can be found in ref27.
The images of the drops were captured by using a Basler acA1300-200μm complementary metal oxide semiconductor (CMOS) camera with a resolution of 1280×1024 pixels and with the frame rate of 175 fps using an imaging optics (Navitar Zoom 6000) mounted on a tiltable stage. The measurements were carried out in a closed sample chamber at 24± 0.5 °C and 92±0.5% relative humidity.
4. METHODS
4.1. Validation. Sessile droplets were used for the validation procedure. Advancing and receding contact angles28 of sessile drops of ultrapure water were determined on the selected surfaces by the drop build-up technique. The volume of the sessile droplets was increased and decreased in 2 μL steps using a gastight microliter syringe (Hamilton Company;
needle diameter: 0.718 mm). The maximum volume of the droplets was 20 or 30 μL depending on the actual contact angle. The needle of the syringe was approached to the drop and retracted from the droplet with a velocity of 0.125 mm/s using a vertical actuator.
The images of the drops were captured in such a way that the needle was not retracted completely from thefield of view;
it can be seen in the top part of the image. Therefore, the scaling factor and the needle’s position can be automatically determined by a simple algorithm for every image knowing the diameter of the needle. The Sobel algorithm29was applied to find edges in the images. Further evaluations were carried out with pixel resolution. An algorithmfinds the drop apex and the contact points without extrapolation, as in the standard ADSA.4 These three points are necessary for the solution of the Young−Laplace equation, which was fitted to the profile using the same algorithm as in ref 30. The results for low- volume droplets with a small base diameter were omitted because of the drop size effect.31−33
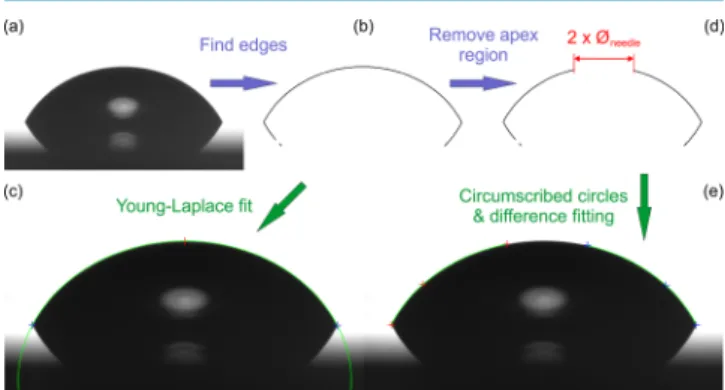
The same images were evaluated by the developed method (Figure 2). It was observed that the steel needle affects the
profile of a water droplet in a lateral region with an extent of less than double of the needle diameter. Therefore, the upper part of the determined profile with this lateral size was intentionally deleted by the program around the needle position. The size of this window can be easily changed for other test liquids. Circumcircles were constructed independ- ently for the two resultant arcs and sixth-order polynomials was fitted to the vertical difference between the circumcircle and the captured profile. Note, that the arcs were rotated 90°in the case of large contact angles. The sum of the slope of the circumcircle and the polynomial at the contact point was used to calculate the left and right contact angle. The mean of these values was compared to the result of the Young−Laplacefit.
After the analysis, all images were downsized to 750×600 pixels using the IrfanView software, and the whole procedure was repeated in order to investigate the robustness of the method for lower resolution images.
Figure 2.Schematic of the validation procedure. (a) The image of the droplet is captured, and (b) edges are determined by the Sobel algorithm. (c) This profile is evaluated by the Young−Laplace fit using the contact points (blue crosses), and the apex (red cross) is identified by an algorithm. The result is shown by the green curve. (d) The region in the same profile, which would be affected by the needle, is omitted. (e) Circumcircles passing through each three points (red and blue crosses for the left and right arc) are constructed independently. Sixth-order polynomial is fitted to the difference between the circle and the profile. The green curves show thefinally obtained drop profile.
4.2. Needle-in-Drop Measurements. Needle-in-drop measurements were carried out on the SiO2 surface to demonstrate the capability of the method. Two different syringes with needle diameters of 0.718 and 0.235 mm were used for liquid dosing. The drop volume was changed stepwise in 2 μL increments and decrements, as previously, but the needle was left in the droplet. Images were captured after every dispensing step; therefore, the contact line was not moving continuously to ensure the comparability with the results of validation.
5. RESULTS AND DISCUSSION
5.1. Validation. In general, the difference between the circumcircle and the real profile becomes larger with the the increasing drop volume because of the emerging role of gravity.
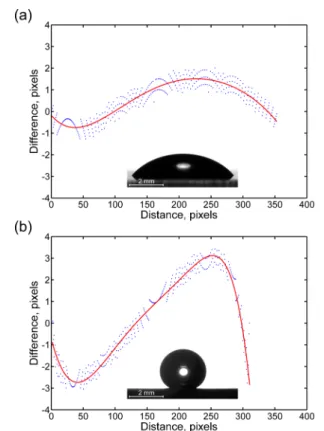
The deviation from the circle shape is more significant also for droplets with larger vertical dimension, that is, for larger contact angles. A typical difference curve can be seen inFigure 3a for the left arc of a 20μL of the water droplet measured on
the glass surface.Figure 3b shows the same curve for a 10μL of droplet on the rough PTFE surface. The difference is larger in the latter case, although the volume is only the half. The zig- zag character of the data points originates from that of the drop profile having pixel resolution, while the circumcircle is a continuous curve. Presumably, the accuracy of the method can be improved further using subpixel resolution implementing the above mentioned models10,21 or a recently developed algorithm by Trujillo-Pino et al.34The solid line represents the
sixth-order polynomialfitted to the data points. In general, the R2values of thefits depend on the number of pixels in an arc.
These values are in the range of 0.940−0.998 for high resolution images depending on the droplet volume and the contact angle, while they are typically larger than 0.9 in the case of low resolution.
The most important advantage of this method can be also observed in Figure 3. The maximum absolute value of the difference does not exceed 10 pixels even in case of large 30μL drops on hydrophobic surfaces, and it remains below 5 pixels in the most cases. Therefore, the slope of the polynomial is much lower at the contact point (x= 0) than the original drop profile has. Furthermore, the slope of thefitted curve does not change significantly with the actual value of the contact angle.
This results in the robustness of the method.
The left and right circumcircles are constructed independ- ently; therefore, contact angles are calculated for the left and the right contact point (which enables to evaluate also nonaxisymmetric drops). Figure 4a shows the determined water contact angles as a function of the drop’s base diameter measured on the SiO2surface for the high resolution images.
Figure 3. Difference between the left arc of the profile and its circumcircle as a function of the distance from the contact point (a) for the glass (20μL) and (b) for the rough PTFE (10μL) surface.
Sixth-order polynomials (red curves) werefitted to the data points.
The insets show the images of the evaluated droplets. The zig-zag character of the data points originated from that pixel resolution was applied.
Figure 4.Determined contact angles as a function of the drop’s base diameter on the SiO2surface. Hollow triangles designate the left and right contact angles resulted by the present method for the resolution of (a) 1280×1024 and (b) 750×600. The results of the Young−
Laplace fit are designated by circles. The upper scale shows the number of pixels in one arc.
The left and right contact angles have small deviations even for large drop volumes; their mean values are close to the results of the Young−Laplacefit.
The average advancing contact angle was determined to be 62.3° ±0.2°with the Young−Laplacefit and 62.1° ±0.2°with the present method. The differences between the receding contact angles were found to be also small: 55.5° ±0.1°and 55.6° ± 0.2°, respectively. The same results can be seen in Figure 4b for low resolution. The differences between the left and right contact angles are slightly larger as well as the difference between the averaged values. The advancing contact angles are 62.4° ± 0.3° and 62.1° ±0.4°, while the receding contact angles are 55.7° ± 0.2° and 55.5° ± 0.3° with the classic and proposed method, respectively. Also, the standard deviations are a bit larger for the low-resolution images. These differences and deviations are very small compared to the sensitivity of the polynomial approach to the number of pixel points. The number of pixels in one arc is shown in the upper axis. The experimentally investigated range was ca. 100−250 pixels for this sample. The contact angle determined by the sixth-order polynomialfit decreases from ca. 65°to 61°in this range of number of pixels.22
The results of the validation procedure are summarized in Table 1 for stable advancing and receding contact angles measured on various surfaces. The evaluation was carried out as described above. The contact angles were averaged for the advancing and the receding phase, and the mean values and their standard deviations were collected and compared. The differences in the mean values are typically not larger than 0.5° for high resolution images; it reaches the absolute value of 0.7° only in the case of the rough PTFE. Note that the standard deviation of the receding contact angle on this surface is 1.4°. For low resolution images, the differences between the mean values and the standard deviations are something larger. The differences do not exceed the absolute value of 0.6 in these cases.
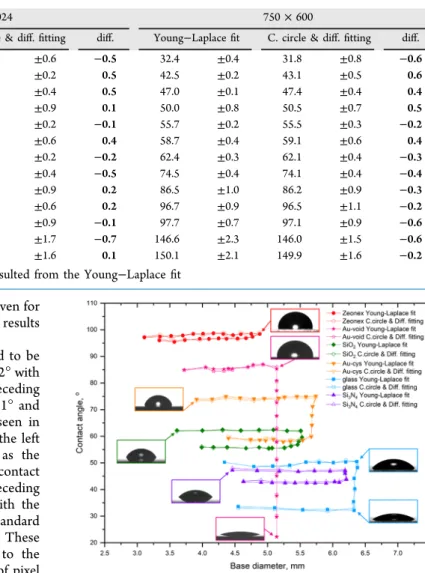
The evaluated results of each measured point are collected in Figure 5. The mean values of the left and right contact angles are presented for the proposed circumcircle and the differencefitting method. The contact angles measured on the rough PTFE surface were not plotted for better visibility. The contact line pins strongly on the surface of the Au-void sample;
therefore, its receding contact angle is changing continuously.
Hence it is missing from Table 1. Besides, this surface was selected to verify that the method gives reliable results also between the stable contact angles down to 22.3°.
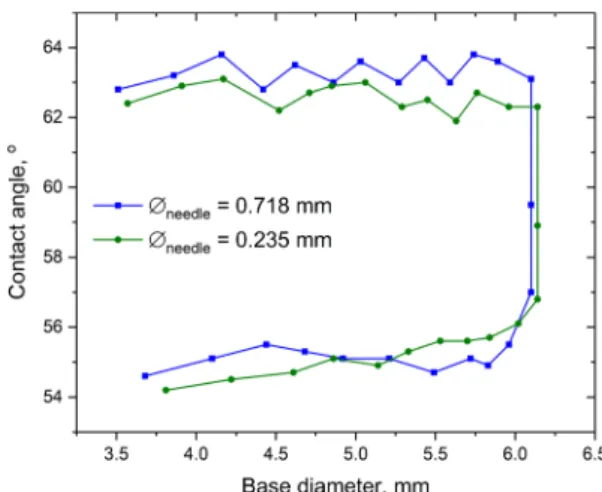
5.2. Needle-in-Drop Measurements. Needle-in-drop measurements were carried out on the SiO2 sample for demonstrating the capability of the present method. Two syringes were applied with different needle diameters (0.718 and 0.235 mm) for dispensing the test liquid. The mean values of left and right contact angles were plotted as a function of the drop’s base diameter in Figure 6 for both syringes. The advancing and receding contact angles were determined to be 63.3° ±0.4°and 55.1° ± 0.3°, respectively, for the needle of larger diameter, while 62.6° ± 0.4° and 55.1° ± 0.5° were found for the syringe with the small diameter needle. These results are in good agreement considering their standard deviation. During the validation, the advancing and receding contact angles were calculated to be 62.3° ±0.2°and 55.6° ± 0.1°, respectively, using the Young−Laplace fit. The results obtained using the small-diameter needle are a bit closer to Table 1. Comparison of the Resultant Stable Advancing and Receding Contact Angles (Degrees) Measured on Different Surfaces and Evaluated Using the Young−Laplace Fit, and the Circumcircle and the Difference Fitting Methoda
1280×1024 750×600
Young−Laplacefit C. circle & diff.fitting diff. Young−Laplacefit C. circle & diff.fitting diff.
glass rec. 32.9 ±0.6 32.4 ±0.6 −0.5 32.4 ±0.4 31.8 ±0.8 −0.6
Si3N4 rec. 42.5 ±0.2 43.0 ±0.2 0.5 42.5 ±0.2 43.1 ±0.5 0.6
Si3N4 adv. 46.9 ±0.2 47.4 ±0.4 0.5 47.0 ±0.1 47.4 ±0.4 0.4
glass adv. 49.8 ±0.8 49.9 ±0.9 0.1 50.0 ±0.8 50.5 ±0.7 0.5
SiO2 rec. 55.6 ±0.1 55.5 ±0.2 −0.1 55.7 ±0.2 55.5 ±0.3 −0.2
Au-cys rec. 58.5 ±0.5 58.9 ±0.6 0.4 58.7 ±0.4 59.1 ±0.6 0.4
SiO2 adv. 62.3 ±0.2 62.1 ±0.2 −0.2 62.4 ±0.3 62.1 ±0.4 −0.3
Au-cys adv. 74.5 ±0.4 74.0 ±0.4 −0.5 74.5 ±0.4 74.1 ±0.4 −0.4
Au-void adv. 85.9 ±0.9 86.1 ±0.9 0.2 86.5 ±1.0 86.2 ±0.9 −0.3
Zeonex rec. 96.5 ±0.5 96.7 ±0.6 0.2 96.7 ±0.9 96.5 ±1.1 −0.2
Zeonex adv. 98.1 ±0.5 98.0 ±0.9 −0.1 97.7 ±0.7 97.1 ±0.9 −0.6
rough PTFE rec. 145.9 ±1.4 145.2 ±1.7 −0.7 146.6 ±2.3 146.0 ±1.5 −0.6
rough PTFE adv. 150.1 ±2.2 150.2 ±1.6 0.1 150.1 ±2.1 149.9 ±1.6 −0.2
aThe rows were ordered ascendingly by the contact angle resulted from the Young−Laplacefit
Figure 5.Contact angles as a function of the drop’s base diameter.
The values determined by the Young−Laplacefit are shown byfilled markers. The hollow markers designate the values determined by the proposed circumcircle and differentialfitting. The insets show droplet images corresponding to the marked points. The contact line pinning on the gold nanovoid surface is obvious.
these values, although the slightly larger standard deviations and hysteresis values of the needle-in measurements can refer also to some amount of surface contamination. Evaluated drop profiles are shown inFigure 7. It can be observed in Figure
7d−f that the needle is not centered to the droplet. It was caused by a short contact line pinning period in the left side at the beginning of the volume increase. However, the method provides plausible results also in this case. The maximum absolute differences between the circumcircle and the profile were similar to thefindings of the validation procedure; they did not exceed 10 pixels. The quality of thefits was proved to be also in the range written above.
6. CONCLUSIONS
A simple and robust method was introduced to determine contact angles in no-apex situations. The easily implementable method combines the advantages of the circular and polynomial fit and suppresses their inherent uncertainties.
Circumscribed circles are constructed for the undisturbed parts of drop profile independently for both sides of the drop. These arcs pass exactly through the contact points, and their derivative can be calculated analytically. The sixth-order polynomial isfitted to the vertical difference between the arc and the drop profile. The slope of this curve at the contact point gives a correction to the value calculated from the
circumcircle. The maximum absolute difference remains below 10 pixels even for large volume drops with large contact angles;
hence, the slope of the fitted curve does not change significantly with the actual value of the contact angle. The accuracy of the method was investigated using sessile water droplets with the volume of 6−30 μL on horizontal surfaces with water contact angles of 20°−150°. The determined advancing and receding contact angles were compared to the results of the Young−Laplacefit. The deviation was found to be typically ≤0.6°. The difference did not show any dependence on the actual contact angle or the number of pixel points in the arc. This latter was assessed in the 100−250 pixels/arc range using the same images with different resolutions (1280 × 1024 and 750 × 600 pixels). The accuracy of the method can be further improved by implementing subpixel resolution and extrapolating the coordinates of the contact points. Needle-in-drop measure- ments were carried out to demonstrate the capabilities of the new method using syringes with different needle diameters. A limitation of this approach is that the drop volume cannot be precisely obtained. However, the method improves the accuracy of the evaluation of the needle-in-drop measurements in the sessile drop, captive bubble, electrowetting, and electrodewetting experiments, and it might be useful also for tilted plate measurements as well.
■
AUTHOR INFORMATION Corresponding Author*E-mail:nagyn@mfa.kfki.hu.
ORCID
Norbert Nagy:0000-0002-9548-9982 Present Address
§Institute of Physical Chemistry and Electrochemistry, Leibniz Universität Hannover, Callinstr. 3A, 30167 Hannover, Germany.
Notes
The authors declare no competingfinancial interest.
■
ACKNOWLEDGMENTSThe work was supported by the grants of Hungarian Scientific Research Found (OTKA) nos. FK-128901, FK-128327, KH- 129578, and K-128266. The support of the Ministry of Human Capacities (BME FIKP-NAT) and the TÁMOP 4.2.1/B-09/1/
KMR-2010-0002 (BME R + D + I project) is acknowledged.
E.A. thanks the support of the European Union and the State of Hungary, cofinanced by the European Social Fund (TÁMOP-4.2.4.A/2-11/1-2012-0001).
■
(1) Shafrin, E. G.; Zisman, W. A. The Spreading of Liquids on Low-REFERENCES Energy Surfaces. IV. Monolayer Coatings on Platinum.J. Colloid Sci.1952,7, 166−177.
(2) Drelich, J. Guidelines to Measurements of Reproducible Contact Angles Using a Sessile-Drop Technique. Surf. Innovations 2013, 1, 248−254.
(3) Kuznetsov, G. V.; Feoktistov, D. V.; Orlova, E. G.; Misyura, S.
Y.; Morozov, V. S.; Islamova, A. G. Evaporation Modes of LiBr, CaCl2, LiCl, NaCl Aqueous Salt Solution Droplets on Aluminum Surface.Int. J. Heat Mass Transf.2018,126, 161−168.
(4) Rotenberg, Y.; Boruvka, L.; Neumann, A. W. Determination of Surface Tension and Contact Angle from the Shapes of Axisymmetric Fluid Interfaces.J. Colloid Interface Sci.1983,93, 169−183.
Figure 6.Contact angles as a function of the drop’s base diameter measured on the SiO2 surface by the needle-in-drop method. Two needles with different diameters were used. The evaluation was carried out by the circumcircle and differencefitting method.
Figure 7.Evaluated images of water droplets with the volume of 10 μL (a,c,d,f) and 30μL (b,e) captured in the advancing (a,b,d, and e) and receding phase (c andf). The measurements were carried out on the SiO2 sample using two different needles with the diameter of 0.718 mm (a−c) and 0.235 mm (d−f). The red and blue crosses designate the points for the circumcircle construction, and the green curves show the resultant profile after differencefitting.
(5) Cheng, P.; Li, D.; Boruvka, L.; Rotenberg, Y.; Neumann, A. W.
Automation of Axisymmetric Drop Shape Analysis for Measurements of Interfacial Tensions and Contact Angles.Colloids Surf.1990,43, 151−167.
(6) Cabezas, M. G.; Bateni, A.; Montanero, J. M.; Neumann, A. W. A New Method of Image Processing in the Analysis of Axisymmetric Drop Shapes.Colloid. Surf. Physicochem. Eng. Asp.2005,255, 193− 200.
(7) Cabezas, M. G.; Bateni, A.; Montanero, J. M.; Neumann, A. W.
Determination of Surface Tension and Contact Angle from the Shapes of Axisymmetric Fluid Interfaces without Use of Apex Coordinates.Langmuir2006,22, 10053−10060.
(8) Kalantarian, A.; David, R.; Neumann, A. W. Methodology for High Accuracy Contact Angle Measurement†.Langmuir 2009,25, 14146−14154.
(9) Saad, S. M. I.; Neumann, A. W. Axisymmetric Drop Shape Analysis (ADSA): An Outline.Adv. Colloid Interface Sci.2016,238, 62−87.
(10) Schmitt, M.; Heib, F. High-Precision Drop Shape Analysis on Inclining Flat Surfaces: Introduction and Comparison of This Special Method with Commercial Contact Angle Analysis. J. Chem. Phys.
2013,139, 134201.
(11) Schmitt, M.; Grub, J.; Heib, F. Statistical Contact Angle Analyses; “Slow Moving” Drops on a Horizontal Silicon-Oxide Surface.J. Colloid Interface Sci.2015,447, 248−253.
(12) Heib, F.; Schmitt, M. Statistical Contact Angle Analyses with the High-Precision Drop Shape Analysis (HPDSA) Approach: Basic Principles and Applications.Coatings2016,6, 57.
(13) Adhesion and adhesives: fundamental and applied aspects.
Advances in Contact Angle, Wettability and Adhesion; Mittal, K. L., Ed.;
Scrivener Publishing, Wiley: Salem, Massachusetts, 2013.
(14) Xu, Z. N.; Wang, S. Y. A Highly Accurate Dynamic Contact Angle Algorithm for Drops on Inclined Surface Based on Ellipse- Fitting.Rev. Sci. Instrum.2015,86, 025104.
(15) ElSherbini, A. I.; Jacobi, A. M. Liquid Drops on Vertical and Inclined Surfaces.J. Colloid Interface Sci.2004,273, 566−575.
(16) Andersen, N. K.; Taboryski, R. Drop Shape Analysis for Determination of Dynamic Contact Angles by Double Sided Elliptical Fitting Method.Meas. Sci. Technol.2017,28, 047003.
(17) Stalder, A. F.; Kulik, G.; Sage, D.; Barbieri, L.; Hoffmann, P. A Snake-Based Approach to Accurate Determination of Both Contact Points and Contact Angles.Colloid. Surf. Physicochem. Eng. Asp.2006, 286, 92−103.
(18) Bortolotti, M.; Brugnara, M.; Volpe, C. D.; Siboni, S. Numerical Models for the Evaluation of the Contact Angle from Axisymmetric Drop Profiles: A Statistical Comparison.J. Colloid Interface Sci.2009, 336, 285−297.
(19) del Río, O. I.; Kwok, D. Y.; Wu, R.; Alvarez, J. M.; Neumann, A.
W. Contact Angle Measurements by Axisymmetric Drop Shape Analysis and an Automated Polynomial Fit Program. Colloid. Surf.
Physicochem. Eng. Asp.1998,143, 197−210.
(20) Bateni, A.; Susnar, S. S.; Amirfazli, A.; Neumann, A. W. A High- Accuracy Polynomial Fitting Approach to Determine Contact Angles.
Colloid. Surf. Physicochem. Eng. Asp.2003,219, 215−231.
(21) Chini, S. F.; Amirfazli, A. A Method for Measuring Contact Angle of Asymmetric and Symmetric Drops. Colloid. Surf.
Physicochem. Eng. Asp.2011,388, 29−37.
(22) Atefi, E.; Mann, J. A.; Tavana, H. A Robust Polynomial Fitting Approach for Contact Angle Measurements. Langmuir 2013, 29, 5677−5688.
(23) Waghmare, P. R.; Mitra, S. K. Contact Angle Hysteresis of Microbead Suspensions.Langmuir2010,26, 17082−17089.
(24) Zhang, G.; Walker, M.; Unwin, P. R. Low-Voltage Voltammetric Electrowetting of Graphite Surfaces by Ion Intercala- tion/Deintercalation.Langmuir2016,32, 7476−7484.
(25) Li, J.; Ha, N. S.; Liu, T. L.; van Dam, R. M.; Kim, C.-J. Ionic- Surfactant-Mediated Electro-Dewetting for Digital Microfluidics.
Nature2019,572, 507−510.
(26) Zámbó, D.; Szekrényes, D. P.; Pothorszky, S.; Nagy, N.; Deák, A. SERS Activity of Reporter-Particle-Loaded Single Plasmonic Nanovoids.J. Phys. Chem. C2018,122, 23683−23690.
(27) Nagy, N. Contact Angle Determination on Hydrophilic and Superhydrophilic Surfaces by Using r −θ-Type Capillary Bridges.
Langmuir2019,35, 5202−5212.
(28) Marmur, A.; Della Volpe, C.; Siboni, S.; Amirfazli, A.; Drelich, J. W. Contact Angles and Wettability: Towards Common and Accurate Terminology.Surf. Innovations2017,5, 3−8.
(29) Canny, J. A Computational Approach to Edge Detection.IEEE Trans. Pattern Anal. Mach. Intell.1986,PAMI-8, 679−698.
(30) Liu, K.; Vuckovac, M.; Latikka, M.; Huhtamäki, T.; Ras, R. H.
A. Improving Surface-Wetting Characterization. Science 2019, 363, 1147−1148.
(31) Good, R. J.; Koo, M. N. The Effect of Drop Size on Contact Angle.J. Colloid Interface Sci.1979,71, 283−292.
(32) Brandon, S.; Haimovich, N.; Yeger, E.; Marmur, A. Partial Wetting of Chemically Patterned Surfaces: The Effect of Drop Size.J.
Colloid Interface Sci.2003,263, 237−243.
(33) Marmur, A. Solid-Surface Characterization by Wetting.Annu.
Rev. Mater. Res.2009,39, 473−489.
(34) Trujillo-Pino, A.; Krissian, K.; Alemán-Flores, M.; Santana- Cedrés, D. Accurate Subpixel Edge Location Based on Partial Area Effect.Image Vis Comput.2013,31, 72−90.