Dynamic electrochemical impedance spectroscopy for the charge transfer rate measurement of the ferro/ferricyanide redox couple on gold
Tamás Pajkossy,1 Maximilian Urs Ceblin,2 and Gábor Mészáros
Institute of Materials and Environmental Chemistry, Research Centre for Natural Sciences, Magyar tudósok körútja 2, Budapest, Hungary, H-1117
Keywords: impedance, interface, diffusion, voltammetry, charge transfer
Abstract
The use of dynamic electrochemical impedance spectroscopy, dEIS is shown in the context of diffusion-controlled electrode reactions. By this method, a number of audio-frequency impedance spectra were measured on a gold electrode in an aqueous solution of K4[Fe(CN)6] while taking cyclic voltammograms (the CVs were taken with 50-200 mV/s scan-rate; the distance of potentials of impedance spectra was 16 mV). The Faradaic impedance elements were determined from the spectra, from them charge transfer rate coefficients were calculated; it was found to be 0.11 cm/s at the formal potential. This set of measurements demonstrates the main advantage of dEIS over the traditional steady state impedance measurements: dEIS characterization of an electrochemical system can be performed in seconds rather than minutes which makes possible to use freshly prepared (eg. annealed) electrodes with reduced risk of contamination or modification of their surfaces.
1. Introduction
One of the favorite playgrounds of electrochemists is the electrode made of a noble metal, gold or platinum, immersed in a well-conducting aqueous electrolyte containing K4[Fe(CN)6] and/or K3[Fe(CN)6] (ferrocyanide and/or ferricyanide) of minor concentration. Cyclic voltammograms, CVs, of these systems are of well-known shape, these are often the textbook examples of diffusion- controlled electrode reactions. As the charge transfer of the redox process involved is fast, the system or the reaction is frequently regarded to be “reversible” or completely “diffusion- controlled”. This is a reasonable view in the context of the usual CV measurements; however, the charge transfer rate – even if it is high - is measurable with special current-potential-time(frequency) measurements eventually with some trick or tool enhancing reactant transport to/from the electrode surface. The popularity of the ferro/ferricyanide system can also be traced back to that it is stable, inexpensive, simple, and easy-to-handle. For about seventy years, time-to-time, the charge transfer rate coefficients have been determined with various purposes. The reported values (or estimates) are mostly in the same one-order-of-magnitude range, typically around or below 0.1 cm/s; the differences between the values of apparently careful measurement series have been traced back to differences of cations of the supporting electrolyte and to their concentrations and to some inhibiting layer formation at the interface.
Our measurement is a dynamic electrochemical impedance spectroscopy, dEIS, series; that is, we repeatedly perform audio-frequency impedance spectrum measurements while the electrode potential, E, is scanned in a CV-fashion. Recording of the spectra are as fast as to yield about 70 spectra within one complete cycle of 100 mV/s CV in a 0.5V potential range. As the complete measurement of these 70 spectra can be performed in a short time of about 10 seconds, the risk of the surface contaminations is minimized. From the spectra we calculate the rate coefficient as the function of the potential. Our aim is to demonstrate such a measurement along with its pitfalls.
1 Corresponding author. Email-address: pajkossy.tamas@ttk.mta.hu ; ORCID: 0000-0002-9516-9401
2 Permanent address: Institute of Electrochemistry, Ulm University, Albert‐Einstein‐Allee 47 89081 Ulm, Germany
2. Precedents
2.1. Previous studies of the ferro/ferricyanide charge transfer kinetics
The ferro/ferricyanide redox reaction is usually regarded as a simple one-electron, one-step electron transfer; its kinetics is characterized in terms of a standard rate coefficient and a transfer coefficient. The rate of charge transfer is expressed as current density, 𝑗, in the usual way (Ref. [1], Ch.3) as a function of the 𝑐s near-surface concentrations as
𝑗 = 𝑛F𝑘ox(𝐸)𝑐reds (𝑋) − 𝑛F𝑘red(𝐸)𝑐oxs (𝑋) (1) where the subscripts ox and red refer to oxidation/oxidized and reduction/reduced reaction/species, respectively; F is Faraday’s constant, n is the charge number of the redox (Faraday) reaction. Note that the 𝑘ox anodic and the 𝑘red cathodic rate coefficients (of dimension length/time and usually of cm/s unit) show explicit dependences only on potential, whereas 𝑐reds and 𝑐oxs depend on the c bulk concentrations and in some way on the transport parameters X which might be, for example, the angular frequency of a rotating disk electrode (RDE) or time in case of transient measurements. We will also use the term of standard rate coefficient, 𝑘0, which is the rate coefficient of both process at the formal potential, 𝐸0. Whenever we want to determine the rate coefficients, we have to extrapolate to the state of no transport hindrance, i.e. to when 𝑐s = 𝑐. This can be achieved basically in two ways: (i) Increasing transport by using forced convection (using typically an RDE) or by employing an electrode whose geometry ensures extreme enhancement of the diffusional flux (using ultramicroelectrodes). (ii) Selecting mathematically well-defined conditions for diffusion, hence the effects of the diffusion can be precisely separated from the Faraday-current (or from a related quantity) – like in the case of impedance methods.
Both possibilities – and also their combinations – have been employed, with noble metal (Pt or Au) electrodes. There exist long lists of the rate parameters determined with various experimental conditions [2,3]. The standard rate coefficients are typically in the range 0.1 > 𝑘0[cm s⁄ ] > 0.01;
the analysis and discussion of these data is much beyond our present scope. However, the pioneering measurements deserve mentioning together with those, which have important implications to our present study.
First, the forced convection, “hydrodynamic voltammetry” measurements have mostly been performed with RDEs [4,5,6] by employing the Koutecký-Levich equation (cf. Eq. 9.3.39 of Ref.[1]) for extrapolation to infinite transport rate. Other ways of streaming the electrolyte were also employed: with a rotating cell in an early measurement [7] and with a ring electrode on the internal wall of a tube through which the electrolyte flew turbulently [8]. The second method with enhanced transport by using ultramicroelectrodes yields polarization curves of sigmoid shapes; the rate coefficient can be estimated from two characteristic potentials of the voltammograms as descibed in [9]. With such an analysis a wide variety of measurements have been described in [10].
From our present point of view, the second family of methods, EIS, is of central importance.
Historically, the first, pioneering rate coefficient determination was done by this method by Randles
& Somerton in the early fifties [11]. Their experiments were made on many and diverse systems, including the one in an approximately equimolar system of ferro/ferricyanide, on Pt electrode in KCl or K2SO4 base electrolyte. They used a two-electrode cell (i.e. measured at a single potential, at the equilibium); the frequency range was one order of magnitude wide in the lower half of the audiofrequency range; impedance data were presented as a plot of Re(Z) and -Im(Z) vs 𝜔−1/2 points lying along two parallel lines. Even with today's eyes, this study is impressive: the authors found the best conditions at which the Faraday impedance can be determined with the least errors caused by the other terms of the “Randles-circuit” [12], i.e. by the series solution resistance, 𝑅s, and the double layer capacitance, 𝐶dl. The resulting rate coefficients of 0.08 and 0.13 cm/s for the above systems are quite close to the value of the present paper (made on Au, in 0.5M KF base electrolyte).
Transport-enhancing methods and EIS have frequently been combined with each other, impedance spectra (or some equivalent methods employing potential steps [13], coulostatic transients [14]) were measured on RDEs [13-1515,16,17] or on ultramicroelectrodes [18]. The studies were concentrated to two major issues. First, as it has been explored at the the mid-seventies, the rate coefficient strongly depends on what is the cation of the supporting electrolyte and what is its concentration [13,14,13,16-19]18,19,20,21]. The conclusion is that the rate coefficient is proportional to the cation’s concentration implying that the electroactive component is an ion-pair or ion-ensemble formed from the ferrocyanide (or) ferricyanide anions with one or more cations rather than the ferrocyanide (or ferricyanide) ions themselves [22]. The second issue has also been studied since the eighties: it is the formation of a layer on the surface which slows down charge transfer [10,15,16]. There exists spectroscopic evidence [23,24] that Fe(CN)63− is strongly adsorbed on Au; its decomposition leads to Fe(CN)3 on the surface. A practical implication of these studies is that free cyanide in the electrolyte inhibits the formation of such a layer [25,26]; otherwise one should do the measurement as quickly as possible.
Finally, three recent method-oriented publications need mentioning: the properties and use of dEIS with multisine potential perturbations are demonstrated therein on the example of ferro/ferricyanide system. Ref. [16] has already mentioned in the context of studying surface film formation. The second one is proof-of-concept dEIS setup [27] for demonstrating the principle how the cycle frequency of CVs should be synchronized with the frequencies of the impedance measurements. In this study, a measurement with 20 mM K4Fe(CN)6 in 0.5M KF is presented;
yielding charge transfer resistances and Warburg parameters. The third one [28] is our previous publication aimed at the demonstration the connection between the CVs and of the dEIS on a diffusion-controlled redox system: It was shown therein that potential derivative of the semiintegrated voltammogram equals to the Warburg admittance coefficients calculated from the dEIS measurements.
2.2. Our previous related studies, motivations, and goals
Electrochemical reactions are usually characterized via 𝑗(𝑡) vs 𝐸(𝑡) measurements in the time or frequency domain; with small or large potential excursions: typically with EIS and CV, respectively.
Whenever we determine interfacial charge transfer rates and evaluate rate coefficients, based on Eq.1, we face typically three problems: the potential scale is ill-defined due to the IR-drop; the current has a component which charges the double layer; finally, the surface concentrations differ from those in the bulk – that is, the transport should be taken into account. There are, obviously other problems making the analysis complicated, like inhomogeneous current density distribution and the complexity of the reaction mechanism. As any observation of charge transfer include effects due to the above three problems, rate coefficient determination with dc methods (analysis of polarization curves, CV peak separations) is inaccurate, difficult or impossible. In contrast, with ac methods, in particular with EIS, the above three disturbing effects can be eliminated, or separated from the charge transfer property of the study: In the present context, 𝑅ct is obtained separately from the other three parameters of the Randles-circuit.
Both the CV and EIS carry the one and the same information on the electrochemical system, however, it is difficult if impossible to compare a scan-rate dependent CV series with a series of EIS carried out at varied potentials and extract the same information from the two sets of data. For relatively simple cases, one of the present authors has recently elaborated the set of equations revealing the connctions of the parameters of interfacial kinetics obtained from CVs and EIS. The equation sets apply for diffusion-controlled charge transfer [29] or to redox reactions of surface confined reactions and adsorption [30]; their use have been illustrated by a numeric simulations;
the connection of the diffusion-related quantities (the Warburg-coefficient obtained from EIS and
the potential derivative of semiintegrated form of the CV) has been experimentally demonstrated (Fig.4b of [28]).
The theories of Refs.[29,30] (and of the related Ref.[31]) imply simultaneous CV and EIS measurements, hence we were motivated to assemble a dEIS setup [28]. The history of dEIS stems mostly in the multisine EIS (msEIS), that is, when EIS is measured at constant potential (or cell voltage) with multisine perturbation in conjunction of Fourier-transform analysis of the current and potential signals. Such msEIS setups were implemented in many laboratories even forty-fifty years ago [30-3332,33,34,35] and since then a number of devices have been constructed to study various electrochemical phenomena either by msEIS or its scanned-potential version, dEIS, or by equivalent methods of different names. Representative examples for msEIS and/or dEIS are [34-4036,37,38,39,40,41,42]; for a recent review of dEIS, see [43]. Taking spectra with msEIS is much faster than with EIS (on the expense of accuracy; for the trade-off between speed and accuracy see [44]); the fast operation has a purpose not only in itself. As the electrode surfaces might get contaminated during a long measurement, it is advisable to measure the freshly prepared (e.g. flame-annealed) electrodes as fast as possible. This is the main advantage of msEIS and dEIS over the traditional EIS.
The theory of charge transfer kinetics involves a subtle coupled-parameters issue, which has been recognized five decades ago by de Levie & Pospísil [45] and also emphasized in the related IUPAC recommendations, see Ch. 6 of [46]. The Faraday-impedance is the serial combination of the charge transfer resistance, 𝑅ct and of the diffusional impedance. In the case of planar diffusion, the latter is called as Warburg impedance, having the form of 𝑍W(𝜔) = 𝜎W⁄√i𝜔, where i is the imaginary unit, ω is the (angular) frequency, and 𝜎W is the Warburg impedance coefficient. These two impedance elements are coupled to each other, because both elements depend on the 𝑐reds and 𝑐oxs surface concentrations in the same way; the 𝐻 ≡ 𝜎W⁄𝑅ct ratio is a combination of the charge transfer rate coefficients and the 𝐷ox and 𝐷red diffusion coefficients as
𝐻(𝐸) ≡ 𝜎W(𝐸) 𝑅⁄ ct(𝐸)= 𝑘ox(𝐸) √𝐷⁄ red+ 𝑘red(𝐸) √𝐷⁄ ox (2) As 𝐻(𝐸) depends only on the potential of the EIS measurement, it is a function of state and hence independent of the 𝐸(𝑡) “history”. Consequently, in the case of dEIS measurements, 𝐻(𝐸) is independent of the scan rate – one should get the same 𝐻(𝐸) also with traditional, steady state EIS, sEIS. If the Ds are known from some voltammetry measurements, then the charge transfer rate coefficients (eventually also the charge transfer coefficients) can be calculated from 𝐻(𝐸). Due to thermodynamic reasons (see Ch.3 of [1] and [47]), for a single-step, one-electron charge transfer 𝑘ox(𝐸) 𝑘⁄ red(𝐸)= exp (F(𝐸 − 𝐸0) R𝑇)⁄ . Combining this equation with Eq.2, assuming that 𝐷red= 𝐷ox = 𝐷, we get
𝑘ox(𝐸) = √𝐷 ∙ 𝜎W
𝑅ct∙ (1 + exp (F(𝐸 − 𝐸0) R𝑇)⁄ (3a) and
𝑘red(𝐸) = √𝐷 ∙ 𝜎𝑊
𝑅𝑐𝑡 ∙ (1 + exp (− F(𝐸 − 𝐸0) R𝑇)⁄ (3b) The goal of the present study is the determination of the charge transfer rate coefficients from the impedance spectra using Eqs. 3a and 3b. As the procedure is rather unconvetional, the difficulties are highlighted.
3. Experimental
The measurements were made on a gold wire electrode of 0.25 cm2 geometrical area in a 0.5 M aqueous solution of KF containing 0.01M K4Fe(CN)6, de-oxygenated by Ar. The electronics and the software, the cell with the electrodes and the chemicals were all the same3 as in [28], except that the ferrocyanide concentration and electrode area was somewhat different. Some subtle changes of the calibration procedure, software and of interconnections of the units, removal of certain ground loops caused a definite improvement of accuracy.
We report the results of four types of electrical measurements, the second to fourth of which serve as supplementaries to the first, dEIS. Unless otherwise noted, all measurements were done with a single potential cycle between limits -0.1 V and +0.5 V, starting at -0.1 V. All potentials are against that of the saturated calomel electrode, SCE.
(a). dEIS measurements: These were performed with the setup described in [28]; which made possible the measurement of an audio-frequency impedance spectrum – depending on the lowermost frequency – approximately in 0.08, 0.16, or 0.32 s (these times are the triples of the period times at the lowermost frequencies). With the combination of a linear potential scan of 200, 100, or 50 mV/s, respectively, one spectrum in every 16 mV (precisely: in 16.38 mV) was acquired4. Three spectrum series were measured, with the above scan-rates; these series required 5, 10, and 20 seconds.
Between the spectrum series the solution was shortly but vigorously stirred by argon bubbling, then it was left to rest for a about half a minute, during this time new scan parameters were set (this time was also needed for the computer to perform some calculations). To sum up the time required, the measurement of three spectrum-series required altogether about two minutes.
(b): sEIS measurements with a Zahner Im6e potentiostat: Having finished the dEIS measurements, we connected the cell to a Zahner Im6e potentiostat where “classical”, sEIS spectra (from 100 kHz to 1 Hz, 8 frequency/decade) were taken at potentials 0.1 to 0.4 V in 0.1V steps then from 0.45 V down to 0.15 V in 0.1 V steps. The delay between the individual spectrum measurements was sufficiently long, 30 s, to regard these measurements as steady state ones.
(c) For demonstrating that the system is reversible from the CV point of view, we measured single- cycle CVs from -0.1 V to +0.5 V and back with 200, 100 and 50 mV/s scan-rates; for the evaluation of the CVs through their semiintegration we also used the series resistance, Rs obtained from dEIS.
(d) To determine the diffusion coefficient of the ferrocyanide and ferricyanide, CVs of 100 mV/s were taken (with +0.5V starting potential in case of ferricyanide). Diffusion coefficients were calculated from the peak heights of the first half-cycles, using the Randles - Ševčík equation (Eq.
6.2.19 in [1]).
The electrode was flame annealed and quenched in pure water before performing the complete series of dEIS and sEIS measurements, and also before the CV series (c) and (d).
4. Results
General characterization of the system has been done by recording one-cycle CVs with 200, 100 and 50 mV/s (type (c) measurement). These CVs, their semiintegrated forms and the derivative of the
3 Corrigenda to Ref. 28: first, for the Fourier-transform Hann-window (rather than Hanning-window) was implemented;
second, in on the scheme of the setup in Fig.1, a capacitor of 1uF in the feedback path of OA2 is missing. Third, in the Conclusion: the time required for taking one spectrum is variably 82 to 327 ms rather than 300ms. Finally, note the meaning of the symbol σ is different: therein it is the coefficient of the Warburg admittance (rather than of the Warburg impedance, as here).
4 As for the Fourier-transform Hann-window was implemented [28] which emphasizes the middle part of the signal and suppresses the ends, a guess for the change of the dc potential during the take of a single spectrum is less or around 10 mV. This number allows us to connect the minimum frequency, fmin of the spectra with the scan-rate, dE/dt:
𝑓min> 1 0.01[V/s] ×⁄ d𝐸 d𝑡 ⁄ . (Obviously, the spectra can be trimmed by removing a few low frequency points if a Kramers-Kronig test indicates to do so.)
latters with respect the electrode potential are plotted in Fig.1. Apart the twofold decrease of the current due to the lessened ferrocyanide concentration, they look just the same as those in Figs. 2 and 3 of [28]. As the semiintegrated forms of all these three CVs as a function the IR-corrected potential, 𝐸IRc, exhibit practically no hysteresis, it is hopeless to attempt to extract information on the charge transfer kinetics from the CVs – the system appear to be ideally reversible from the CV point of view. In other words, the peak separations of >59 mV on the CVs come from IR drop rather than from the slow charge transfer.
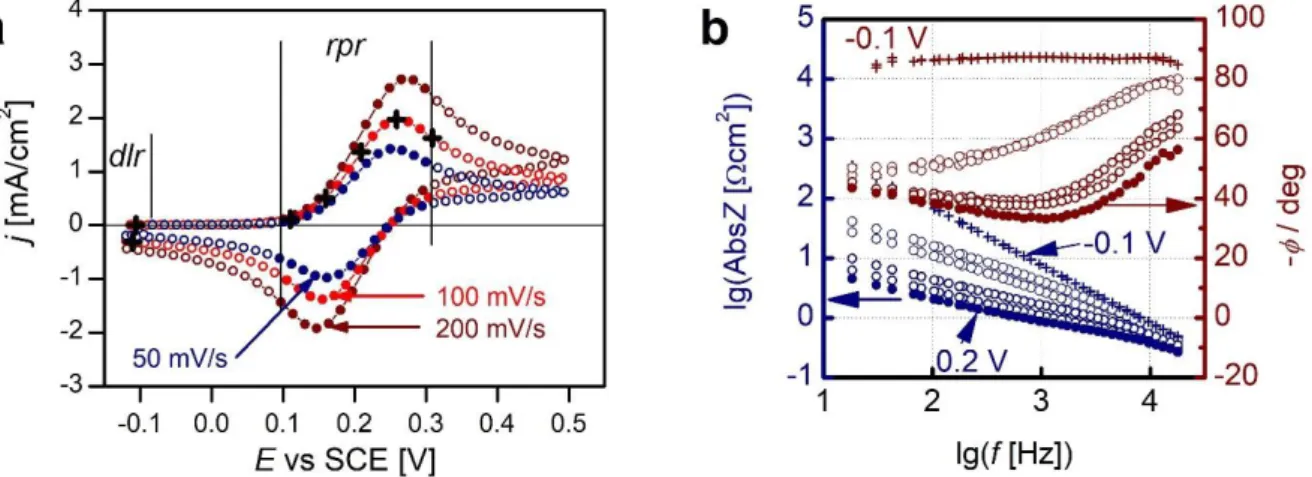
Figure 1. (a) One-cycle CVs at scan rates as indicated. (b) The semiintegrated CVs and their potential derivatives vs the IR-corrected potential.
Figure 2. (a) Location of the recorded impedance spectra (circles). The full circles are the locations of the spectra in the rpr (redox peak region, 0.1 V ≤ 𝐸 ≤ 0.3 V) from which the 𝑅ct, 𝜎W , and the CPE coefficient (“double layer capacitance”) were determined. Crosses are locations of the spectra plotted in (b). (b) Interfacial impedance spectra (i.e. after subtraction of 𝑅s measured on the CV of 100 mV/s at potentials indicated by crosses on (a). Crosses and full circles are spectra at 𝐸init= –0.1 V and +0.2 V ≅ 𝐸0 , respectively.
𝐷red, as obtained from the plateau heights , 𝑛F𝑐red√𝐷red , of the semiintegrated form (cf. Eq. 6.7.5 of [1]) is 5.9×10⁻⁶ cm2/s. It is practically the same value, as the one obtained from peak heights with measurement type (d), 5.7×10⁻⁶ cm2/s. A similar measurement type (b) with ferricyanide yielded a 𝐷red value about 2% higher than that of ferrocyanide. Hence, in what follows, we use the one and the same D=5.9×10⁻⁶ cm2/s diffusion coefficient for both species.
The potential of the inflexion point of the semiintegrated CV (i.e. the location of the maximum of its derivative), is the half-wave potential, 𝐸1/2, cf. Ch. 6.7. of [1]. As the diffusion coefficients are practically the same, the formal potential is 𝐸0 ≅ 𝐸1/2=0.206 V. see Fig.1b, is at 0.206 mV.
The dEIS measurements (type (a) measurements) yielded one spectrum at each j–E location, as illustrated in Fig.2a. As it is shown in Fig.2b, the low frequency part of the impedance spectra are Warburg-like in the CV redox peak potential region, rpr, and capacitive in the double layer region, dlr, at the initial potential.
The impedance spectra thereafter were analyzed by fitting the parameters of a somewhat modified version of the Randles-circuit [12] to the measured spectra. The original circuit is 𝑅s− 𝐶dl||(𝑅ct− 𝑊); however, as it is usual in the case of solid, polycrystalline electrodes 𝐶dl had to be replaced by a constant phase element, CPE, whose admittance is defined as YCPE= Y0(iω)α where Y0
and α are the CPE coefficient and exponent, respectively.
The CPE-modified Randles-circuit gives reasonably good fits for all spectra, with low sum-of-errors and uniform error distributions. However, inconsistencies of the fitted parameters appear, like 𝑅s slightly depends on potential, or 1/𝜎W does not vanish beyond 0.4V (although it is expected). These are partly related to the mathematical structure of the model – certain parameter pairs or triples (𝑅s and α, 𝜎W, Y0, and α) are strongly correlated. Basically the inconsistencies are the consequence of that the impedance of the double layer is ill-defined: it is approximately capacitive, but has a definite frequency dispersion, the extent of which depends on many and diverse factors of the surface pretreatments [48] and of the adsorption of electrolyte components (trace contaminations, anions, water) even on completely homogeneous, single-crystalline surfaces [49] and hence also on potential. As capacitance dispersion exists, varies from sample-to-sample, experiment to experiment, as an approximation we use the empirical impedance element CPE.
In contrast, the Faraday impedance consists of two elements which are well-defined from the frequency dependence point of view: Charge transfer appears as a resistance (because no time constant is involved), the Warburg impedance stems from the Fick-equations with boundary conditions which are in accord with the present measurement.
As the interfacial impedance is a parallel combination of a well-defined and an ill-defined terms, all what we can do is that we restrict analysis by fitting to a 100mV broad range around the equilibrium potential; to the “redox peak region”, rpr, where the well-defined Faraday-impedance is small enough and hence affected little by the ill-defined CPE-approximated double layer impedance. For an estimation of their magnitude ratio see Section 5.4 of Discussion, with Fig.5.
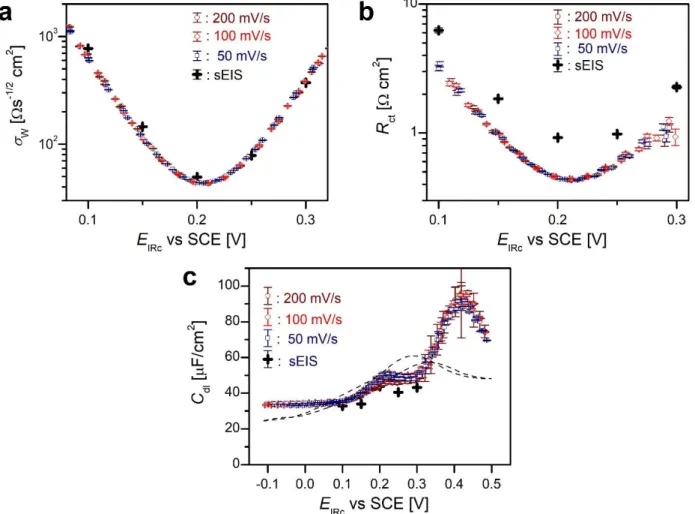
As the charge transfer is nil at the initial potential, 𝐸init= −0.1 V, there the Faraday impedance is infinite, the electrode impedance comprises of a solution resistance, 𝑅s, and a double layer capacitive impedance only, the latter approximated by the CPE. 𝑅s and the CPE exponent were determined from spectra measured in the “double layer region”, dlr, i.e. close to Einit. Throughout all other fitting procedures both were regarded as potential independent constants, 𝑅s = 3.78 Ωcm2 and α = 0.965. Hence, in the CV peak-potential range, the free (to-be-fitted) parameters of the impedance function were 𝑅ct, 𝜎W, and 𝑌0 (this last one is transformed to 𝐶dl as described in Section 5.5 of Discussion). The fitted parameters are plotted as a function of the IR corrected potential in Fig.3a, 3b and 3c, respectively. All these parameters appear to be independent on scan-rate and scan direction. On all the plots we plotted also the same parameters obtained from spectra measured by sEIS measurements, i.e. by method (b). The 𝜎W points appear to be independent of the measurement mode (dEIS or sEIS); in contrast, 𝑅ct is somewhat different.
Its possible reason is shortly suggested in the Discussion, section 5.2.
Figure 3. Fitted parameters 𝜎W (a), 𝑅ct, (b) and 𝐶dl (c) of the interfacial impedance as functions of IR-corrected potential. Circles, diamonds, and squares are fitted parameters of the dEIS taken with 200, 100, and 50 mV/s scans, respectively; crosses are the quantities calculated from sEIS.
The dashed line on (c) is a 18 Hz 𝐶dl vs E curve measured on Au(111) in 0.1 M KClO4 [49].
Using Eqs 3a and 3b, from the fitted 𝜎W(𝐸) and 𝑅ct(𝐸) functions together with the 𝐷 = 𝐷ox= 𝐷red = 5.7×10⁻⁶ cm2/s and 𝐸0 = 0.206 V values, the 𝑘(𝐸) functions (any of 𝑘red(𝐸) or 𝑘ox(𝐸)) have been calculated and plotted in Fig.4.
Fig.4. Charge transfer rate coefficients 𝑘ox (open symbols and ×) and 𝑘red (full symbols and +) as
The log(𝑘(𝐸)) curves are somewhat bending rather than linear ones. Following the procedure described in [13], second order parabolas were fitted to both of them, that is the lg(𝑘0), c1 and c2
constants of the lg(𝑘(𝐸)) = lg(𝑘0) + 𝑐1(𝐸 − 𝐸0) + 𝑐2(𝐸 − 𝐸0)2 were determined. The apparent charge transfer coefficients are calculated from the slopes as 𝛼 = 2.302 R𝑇/F (−𝑐1− 2 𝑐2(𝐸 − 𝐸0)).
The standard rate coefficient was found to be 𝑘0 = 0.11 cm s⁄ from the dEIS data, the charge transfer coefficient of the reduction is 𝛼red =0.42 at 𝐸 = 𝐸0; it increases approximately from 0.25 to 0.59 at the negative and positive end, respectively, of the 0.2V potential range of the measurements. These numbers for oxidation are 𝛼ox = 1 − 𝛼red. We do not give errors to these numbers, because the overall accuracy is determined by a complicated mixture of statistical and possible systematic errors. Nevertheless, as the determination of the Faraday-impedance elements is the most accurate in the close vicinity of 𝐸0; 𝑘0and 𝛼red(𝐸0) values are as accurate as the given digits imply; 𝛼red(𝐸) is definitely increasing with potential.
We refrain from interpreting the potential dependence of the charge transfer coefficients. For possible interpretations of similar 𝛼red(𝐸) curves see [13].
For the sEIS data, the standard rate coefficient is about half of that of dEIS, 𝑘0 ≅ 0.06 cm s⁄ . As the + and × points lie parallely to the curves of dEIS, the charge transfer coefficients are the same as of those of dEIS.
5. Discussion
5.1. Why are the 𝑹ct(𝑬) and 𝝈W(𝑬) curves scan-rate-independent?
In general, both the 𝑅ct(𝐸) and the 𝜎W(𝐸) functions are scan-rate dependent functions with a hysteresis; as analysed in Ref. [29]. However, the dependence is significant if the charge transfer coefficients is low and diminishes with increasing k0 (cf. Figs. 4b&4c for k0=10-3 cm/s and Figs. 5b&5c for k0=10-2 cm/s). In the present case, with even higher k0, the 𝑅ct(𝐸) points lie on the same curve, irrespectively on scan rate and scan direction; the same applies for the 𝜎W(𝐸) points.
This finding of scan-rate independence (at least for the given system, in the given scan-rate and frequency-range) implies that during the measurement time of one spectrum, the interface can be regarded to be in steady state. Each individual impedance spectrum provides a snapshot at its potential. Therefore, the spectra can be analysed with those, conventional methods – like fitting equivalent circuit parameters – which are employed for the interpretation of static EIS.
5.2. Fast measurements are useful when system cleanliness counts
The big advantage of dEIS over traditional sEIS is its speed – hence the measurements can be performed with freshly prepared electrode surfaces with a diminished danger of surface contaminations. In the context of the present paper: our three, one-cycle measurements have been completed in two minutes following the introduction of the freshly annealed gold electrode into the solution. We obtain about twice as large rate coefficients with dEIS than with sEIS measurements, performed in a much longer time frame (cf. Fig.4). The k0=0.11 cm/s value of dEIS is almost the double of that can be calculated from the data of Fig. 2 of [22], also from the data of Fig.9 of [27] – these are the sEIS measurements which are comparable to our ones. This finding is in accord with the conclusions of [15] that some surface layer formed during the measurement hinders the charge transfer.
As the technique of dEIS allows the study of freshly cleaned electrode surfaces, its use probably will give a new impetus also to the double layer studies on single crystalline noble metal surfaces similarly to those pioneered by Valette on Ag [50], Hamelin on Au [51] and Clavilier on Pt [52].
5.3. Use of the coupling of 𝝈W and 𝑹ct for rate coefficient determination
The usual way of determination of rate coefficients is done from 𝑅ct with assuming an exponential potential dependence of the rate coefficients, see e.g. Chs.3 and 10 of [1]. However, by employing the coupling between diffusion and charge transfer, as it is treated in Ch.6 of [46], the rate coefficient can be calculated from the spectra through 𝜎W and 𝑅ct without any a priori assumption of the potential dependences. For this, however, the knowledge of the diffusion coefficients is needed, which quantity can be determined in separate experiment e.g. from CV peak heights with the Randles - Ševčík equation or from a Cottrell chronoamperometry experiment. For any of these measurements, obviously, the knowledge of the electrode area and bulk concentrations are needed.
This way, by calculating the 𝜎W⁄𝑅ct ratio from impedance spectra, in fact, we determine the ratio of the diffusional flux and charge transfer rate. Due to that the planar diffusion geometry – just as the diffusional flux is well-defined and well-known, the charge transfer rate is calibrated by the diffusional flux. This is so, also if the geometry of diffusion is other than planar – e.g. in Ref. [18] the charge transfer rate coefficients are calculated from impedance spectra measured on an ultramicroelectrode at which the geometry of diffusion is completely different (planar at high and spherical at low frequencies).
Since there is no a priori potential dependence assumed for the rate coefficients; we get the potential dependences as output quantities, like in the present case in Fig 4.
5.4. Separation of the impedances of the double layer and of Faraday processes
The Randles-circuit is a widely used model of diffusion controlled charge transfer. Nevertheless, we always have to keep in mind which of its elements are well-defined, eventually of constant values, and which are approximations. For example, the serial resistance is a frequency and potential- independent constant (i.e. an ideal, Ohmic resistance), for concentrated electrolytes and for cell constructions where the current density distribution is uniform along the electrode surface. The charge transfer resistance is also an ideal resistance (albeit potential-dependent); the diffusional impedance is an element which has a well-defined frequency-dependence (provided that the transport is not affected by convections). However, the double layer impedance is very rarely ideally capacitive, the deviation from ideal behaviour depends on surface inhomogeneities (geometric and energetic as well) and on various adsorption processes [48, 53] – in many cases in an unpredictable way. This way, uncertainties of the frequency dependence of this ill-defined element may affect seriously the accuracy of the well-defined terms.
The interfacial admittance is the sum of the well-defined Faraday-admittance and of the ill-defined double layer admittance. These two terms are plotted as a function of the potential in Fig.5, for three characteristic frequencies, as calculated from the fitted data of the dEIS of 100 mV/s scan rate.
The three characteristic frequencies are the low and the high frequency limits, and their geometric mean, 600 Hz. As it is seen on the plot, there is a rather narrow potential region, where the Faraday- admittance is larger than the double layer admittance, at least in the lower half of the frequency range of the spectra – thus in this potential range the uncertainity of the double layer might be ignored. In contrast, outside the redox peak region the Faraday admittance cannot be determined, because of the uncertainties of the double layer admittance – even if the numeric quality of the fitting procedure (low sum-of-error-squares, uniform error distribution) appears to be good.
Note that a plot like Fig.5. helps us to estimate “accessibility window” of certain parameters. For example, by decreasing the concentration by one order of magnitude would shift the YF curves downward hence making the window narrower.
In this section a particular problem of the charge transfer kinetics and of the Randles-circuit has been discussed. However, these statements, with appropriate changes, apply to other electrochemical situations as well.
Figure.5. Interfacial admittances at 100 mV/s scan rate dEIS measurements. YF and Ydl stand for Faraday-admittance and double layer admittance, respectively. Thin lines are admittances at the borders of the frequency range, the thick lines are admittances at 600 Hz, at the mid-range. This Figure illustrates that there is a limited potential range where the Faraday admittance is larger than the double layer admittance and hence uncertainties of the latter do not affect much the accuracy of the Faraday-admittance.
5.5. The double layer capacitance, as determined from the spectra
As the double layer is not ideally capacitive; its impedance has been approximated by a constant phase element, CPE, whose admittance is 𝑌CPE≡ 𝑌0(iω)𝛼. The exponent is close to 1, it changes little is any with potential, hence it is held constant during the fitting procedures. The fitting procedure yields the CPE coefficient, 𝑌0. To convert 𝑌0 to a double layer capacitance, 𝐶dl we have to specify an appropriate, arbitrary frequency, 𝜔a, and define 𝐶dl in such a way that its admittance be equal to the real part of the CPE’s admittance, i.e. Re(𝑌0(i𝜔a)∝) = i𝜔a𝐶dl hence 𝐶dl =
𝑌0𝜔a∝cos ((∝ −1)𝜋/2). We choose 18 Hz as the appropriate frequency (𝜔a = 2𝜋 ∙ 18 Hz) because (i) this is the lowest frequency of the spectra and (ii), for comparison, we have datasets on double layer capacitance at this frequency on single crystalline gold [49]. The interfacial capacitances calculated for 18 Hz are plotted as function of IR-corrected potential in Fig. 3c.
6. Summary and conclusions
We combined CV and EIS measurements in such a way that with scan rates up to 200 mV/s one audio-frequency EIS could be obtained at every 16 mV. With this setup, dEIS measurements were performed on a gold electrode in a ferrocyanide-containing electrolyte. Separation of the Faraday- impedance from the double layer’s impedance was possible in the redox peak’s potential region.
Based on (i) the coupling of the charge transfer resistance and the diffusional (Warburg) impedances as expressed by Eq.2, and (ii) the knowledge of the diffusion coefficient as determined from CV peak heights, 𝑘ox(𝐸) and 𝑘red(𝐸) functions were calculated. The 𝑘0 standard rate coefficient was found to to be 0.11 cm/s.
As the dEIS spectra – and accordingly, all model parameters – were found to be independent on the scan-rate (at least in the given scan-rate and frequency-range) implying that during the measurement time of one spectrum the interface can be regarded to be in steady state. The individual impedance spectra provide a snapshot at one potential. Therefore, the spectra can be analysed with those, conventional methods – like fitting equivalent circuit parameters – which are employed for the interpretation of static EIS. The speed of dEIS makes possible to perform fast
kinetics or double layer studies on freshly prepared (e.g. annealed) electrodes with reduced danger of the contamination or transformation of the electrode surface.
Acknowledgements
The research within project No. VEKOP-2.3.2-16-2017-00013 was supported by the European Union and the State of Hungary, co-financed by the European Regional Development Fund. Financial assistance of the National Research, Development and Innovation Office of through the project OTKA-NN-112034 is acknowledged. MUC thanks DAAD for a postdoctoral fellowship No. 57532138.
List of symbols and acronyms
𝑡, 𝐸, 𝑣, 𝑗 time, electrode potential, scan-rate, current density 𝑅ct charge transfer resistance
𝜎W coefficient of the diffusional (Warburg) impedance
𝑐red, 𝑐ox concentration of the reduced and oxidized species in the electrolyte bulk 𝑐reds , 𝑐oxs concentration of the reduced and oxidized species at the electrode surface 𝐷red, 𝐷ox diffusion coefficient of the reduced and oxidized species
𝑘ox, 𝑘red rate coefficient of the oxidation and reduction (anodic and cathodic reactions) 𝛼ox, 𝛼red charge transfer coefficient of the anodic and cathodic reactions
𝑘, 𝛼 any of 𝑘ox or 𝑘red, and 𝛼ox or 𝛼red, respectively
𝑘0, 𝐸0 standard rate coefficient and formal potential of the redox reaction H parameter combination of 𝑘a , 𝑘c , 𝐷red, and 𝐷ox , see Eq.2
n charge number of the electrode reaction
F,R,T Faraday’s number, universal gas constant, temperature CV cyclic voltammetry/voltammograms
EIS electrochemical impedance spectroscopy/spectrum/spectra dEIS, sEIS dynamic EIS, steady state/stationary/static EIS
msEIS multisine perturbation EIS References
1 A.J. Bard, L.R. Faulkner: Electrochemical Methods, Wiley, 2nd Ed. New York, 2001.
2 N. Tanaka, R. Tamamushi: Kinetic parameters of electrode reactions, Electrochim. Acta 9 (1964) 963, doi: 10.1016/0013-4686(64)85045-3
3 R. Holze, Electrochemical Thermodynamics and Kinetics, Physical Chemistry Vol. 9A, Springer, 2007 ISBN: 978-3-540-41038-6
4 D. Jahn, W. Vielstich: Rates of Electrode Processes by the Rotating Disk Method, J. Electrochem. Soc., 109 (1962) 849,
doi:10.1149/1.2425567
5 D.H. Angell, T. Dickinson: The kinetics of the ferrous/ferric and ferro/ferricyanide reactions at platinum and gold electrodes, J. Electroanal. Chem., 35 (1972) 55,
doi:10.1016/s0022-0728(72)80294-8
6 E. Tourwé, T. Breugelmans, R. Pintelon, A. Hubin: Extraction of a quantitative reaction mechanism from linear sweep voltammograms obtained on a rotating disk electrode. Part II: Application to the redox couple. J.
Electranal. Chem., 609 (2007) 1, doi:10.1016/j.jelechem.2006.12.019
7 J. Jordan: Significance of Rates and Equilibria in Electroanalytical Chemistry. Anal. Chem., 27 (1955) 1708, doi:10.1021/ac60107a010
8 T. Iwasita, W. Schmickler, J. Herrmann, U. Vogel: The Kinetic Parameters of the Fe(CN)63−∕4− Redox System. J.
Electrochem. Soc., 130 (1983) 2026, doi:10.1149/1.2119513
9 K.B. Oldham, J.C. Myland, C.G. Zoski, A.M. Bond: Kinetic parameters from steady-state voltammograms at microdisc electrodes, J. Electroanal. Chem., 270 (1989) 79
10 C. Beriet, D. Pletcher: A microelectrode study of the mechanism and kinetics of the ferro/ferricyanide couple in aqueous media: The influence of the electrolyte and its concentration. J. Electroanal. Chem., 361 (1993) 93, doi:10.1016/0022-0728(93)87042-t
11 J. E. B. Randles, K. W. Somerton: Kinetics of rapid electrode reactions. Part 3.—Electron exchange reactions.
Trans. Faraday Soc., 48 (1952) 937, doi:10.1039/tf9524800937
12 J.E.B. Randles: Kinetics of rapid electrode reactions. Disc. Faraday Soc., 1 (1947) 11, doi:10.1039/df9470100011
13 V. Mareček, Z. Samec, J. Weber: The dependence of the electrochemical charge-transfer coefficient on the electrode potential. J. Electroanal. Chem., 94 (1978) 169,
doi:10.1016/s0022-0728(78)80312-x
14 L.M. Peter, W. Dürr, P. Bindra, H. Gerischer: Influence of alkali-metal cations on rate of Fe(CN)63-/Fe(CN)64-
electrode process, J. Electroanal. Chem., 71 (1976) 31
15 M. Stieble, K. Jüttner: Surface blocking in the redox system Pt/[Fe(CN)6]3−,[Fe(CN)6]4−, J. Electroanal. Chem., 290 (1990) 163,
doi:10.1016/0022-0728(90)87428-m
16 L. Fernández Macía, M. Petrova, A. Hubin: ORP-EIS to study the time evolution of the [Fe(CN)6]3-/[Fe(CN)6]4- reaction due to adsorption at the electrochemical interface, J. Electroanal. Chem., 737 (2015) 46,
doi:10.1016/j.jelechem.2014.10.032
17 J. Kawiak, T, Jędral, Z. Galus: A reconsideration of the kinetic data for the Fe(CN)63−/Fe(CN)64− system, J.
Electroanal. Chem., 145 (1983) 163, doi:10.1016/s0022-0728(83)80301-5
18 P.G. Bruce, A. Lisowska-Oleksiak, P. Los, C.A. Vincent: Electrochemical impedance spectroscopy at an ultramicroelectrode, J. Electroanal. Chem., 367 (1994) 279
doi:10.1016/0022-0728(94)03303-x
19 P. Bindra, H. Gerischer, L.M. Peter: The dependence of the rate of the Fe(CN)63−/Fe(CN)64− couple on ionic strength in concentrated solutions, J. Electroanal. Chem., 57 (1974) 435
doi:10.1016/s0022-0728(74)80071-9
20 J. Kuta, E. Yeager: The influence of cations on the electrode kinetics of ferricyanide - ferrocyanide system on the rotating gold electrode, J. Electroanal. Chem., 59 (1975) 110
21 R. Sohr, L. Müller: Der Einfluss des Leitsalzes auf die Geschwindigkeit des Elektronenaustausches im Redoxsytem [Fe(CN)6]3-/[Fe(CN)6]4-, Electrochim. Acta, 20 (1975) 451
22 S.A. Campbell, L.M. Peter: The effect of [K+] on the heterogeneous rate constant for the [Fe(CN)6]3-/[Fe(CN)6]4- redox couple investigated by a.c. impedance spectroscopy, J. Electroanal. Chem., 364 (1994) 257
23 D.J. Blackwood, S. Pons: An in situ surface fourier transform infrared study of complexes of lithium, magnesium, potassium and lanthanum ferrocyanide at platinum and gold electrodes, J. Electroanal. Chem., 244 (1988) 301 doi:10.1016/0022-0728(88)80112-8
24 M. Fleischmann, P.R. Graves, J. Robinson: The raman spectroscopy of the ferricyanide/ferrocyanide system at gold, β-palladium hydride and platinum electrodes. J. Electroanal. Chem., 182 (1985) 87
doi:10.1016/0368-1874(85)85442-3
25 J. Kawiak, P.J. Kulesza, Z. Galus: A search for conditions permitting model behavior of the Fe(CN)3−/4−6 system.
J. Electroanal. Chem., 226 (1987) 305, doi:10.1016/0022-0728(87)80053-0
26 W. Huang, R. McCreery: Electron transfer kinetics of Fe(CN)63−4− on laser-activated and CN−-modified Pt electrodes, J. Electroanal. Chem., 326 (1992) 1,
doi:10.1016/0022-0728(92)80499-t
27 D. Koster, G. Du, A. Battistel, F. La Mantia: Dynamic impedance spectroscopy using dynamic multi-frequency analysis: A theoretical and experimental investigation, Electrochim Acta 246 (2017) 553
28 T. Pajkossy, G. Mészáros: Connection of CVs and impedance spectra of reversible redox systems, as used for the validation of a dynamic electrochemical impedance spectrum measurement system, J. Solid St. Electrochem., 24 (2020) 2883,
doi: 10.1007/s10008-020-04661-8
29 T.Pajkossy: Dynamic electrochemical impedance spectroscopy of quasi-reversible redox systems. Properties of the Faradaic impedance, and relations to those of voltammograms, Electrochim. Acta 308 (2019) 410, doi: 10.1016/j.electacta.2019.03.197
30 T. Pajkossy: Transformation to potential-program invariant form of voltammograms and dynamic electro- chemical impedance spectra of surface confined redox species, Electrochemical Science Advances, 2021, doi: 10.1002/elsa.202000039
31 T. Pajkossy: Analysis of adsorption-related voltammograms: Transformation to potential-program invariant form, Electrochem. Comm., 118 (2020) 106810,
doi: 10.1016/j.elecom.2020.106810
32 S.C. Creason, D.E. Smith: Fourier transform Faradaic admittance measurements: I. Demonstration of the applicability of random and pseudo-random noise as applied potential signals, J. Electroanal. Chem. 36 (1972) A1 33 G. Blanc, I. Epelboin, C. Gabrielli, M. Keddam: Measurement of the electrode impedance in a wide frequency
range using a pseudo-random noise, Electrochim. Acta 20 (1975) 599
34 L. Pospíšil, M. Štefl: The application of microprocessors in electrochemistry, Collect. Czech. Chem. Commun. 48 (1983) 1241
35 L. Nyikos, T. Pajkossy: Electrochemical impedance measurements using Fourier transform (Elektrokémiai impedanciamérés Fourier transzformációval), Magyar Kémikusok Lapja XL (1986) 550 (in Hungarian)
36 J. Házì, D.M. Elton, W.A. Czerwinski, J. Schiewe, V.A. Vicente-Beckett, A.M. Bond: Microcomputer-based instrumentation for multi-frequency Fourier transform alternating current (admittance and impedance) voltammetry, J. Electroanal. Chem., 437 (1997) 1,
doi:10.1016/s0022-0728(96)05038-3
37 K. Darowicki, P. Slepski: Dynamic electrochemical impedance spectroscopy of the first order electrode reaction, J. Electroanal. Chem., 547 (2003) 1
38 S.B. Emery, J.L. Hubbley, D. Roy: Time resolved impedance spectroscopy as a probe of electrochemical kinetics:
The ferro/ferricyanide redox reaction in the presence of anion adsorption on thin film gold, Electrochim. Acta, 50 (2005) 5659
39 J. Tymoczko, V. Colic, A.S. Bandarenka, W. Schuhmann: Detection of 2D phase transitions at the electrode/electrolyte interface using electrochemical impedance spectroscopy, Surf. Sci. 631 (2015) 81
40 T. Pajkossy, G. Mészáros, I. Felhősi, T. Marek, L. Nyikos: A multisine perturbation EIS system for characterization of carbon nanotube layers, Bulgarian Chem. Comm., 49C (2017) 114 – 118
41 L. Sacci, D.A. Harrington: Dynamic Electrochemical Impedance Spectroscopy, ECS Transactions, 19 (2009) 31 42 G.A. Ragoisha, A.S. Bondarenko: Potentiodynamic electrochemical impedance spectroscopy, Electrochim Acta,
50 (2005) 1553
43 A.S. Bandarenka: Exploring the interfaces between metal electrodes and aqueous electrolytes with electrochemical impedance spectroscopy, Analyst, 138 (2013) 5540
44 C. Gabrielli, F. Huet, M. Keddam, J.F. Lizee: Measurement time versus accuracy trade-off analyzed for
electrochemical impedance measurements by means of sine, white noise and step signals, J Electroanal Chem., 138 (1982) 201
46 M. Sluyters-Rehbach: Impedances of electrochemical systems: Terminology, nomenclature and representation - Part I: Cells with metal electrodes and liquid solutions (IUPAC Recommendations 1994). Pure and Applied Chemistry, 66 (1994) 1831
47 R. Guidelli, R.G. Compton, J.M. Feliu, E. Gileadi, J. Lipkowski, W. Schmickler, S. Trasatti: Defining the transfer coefficient in electrochemistry: An assessment (IUPAC Technical Report). Pure and Applied Chemistry, 86, (2014) 245
doi:10.1515/pac-2014-5026
48 Z. Kerner, T. Pajkossy: Impedance of rough capacitive electrodes - the role of surface disorder, J. Electroanal.
Chem., 448, (1998) 139,
doi: 10.1016/S0022-0728(98)00025-4
49 T. Pajkossy, Th. Wandlowski, D.M. Kolb: Impedance aspects of the anion adsorption on gold single crystal electrodes, J. Electroanal. Chem. 414 (1996) 209,
doi: 10.1016/0022-0728(96)04700-6
50 G. Valette: Double layer on silver single-crystal electrodes in contact with electrolytes having anions which present a slight specific adsorption, J. Electroanal. Chem., 122 (1981) 285
51 A. Hamelin: The crystallographic orientation of gold surfaces at the gold-aqueous solution interphases, J.
Electoranal. Chem., 142 (1982), 299
52 J. Clavilier: The role of anion on the electrochemical behaviour of a {111} platinum surface; an unusual splitting of the voltammogram in the hydrogen region, J. Electroanal. Chem., 107 (1980) 211
53 T. Pajkossy: Impedance of rough capacitive electrodes, J. Electroanal. Chem. 364, 111-125 (1994), doi:
10.1016/0022-0728(93)02949-I