Charge deposition, redistribution, and decay properties of insulating surfaces obtained from guiding of low-energy ions through capillaries
R. D. DuBois,1K. T˝okési,2,3and E. Giglio4
1Missouri University of Science and Technology, Rolla, Missouri 65409, USA
2Institute for Nuclear Research, Hungarian Academy of Sciences (ATOMKI), Debrecen, Hungary
3ELI-ALPS, ELI-HU Non-Profit Ltd., Dugonics ter 13, Szeged 6720, Hungary
4Centre de Recherche sur les Ions, les Matériaux et la Photonique (CIMAP), Normandie Université, ENSICAEN, UNICAEN, CEA, CNRS, 14000 Caen, France
(Received 16 December 2018; published 12 June 2019)
We present a combined experimental and theoretical study of the transmission of single charged 1-keV Ar ions through a cylindrical glass capillary of macroscopic dimensions. From quantitative measurements of the incom- ing and transmitted ion currents, combined with a detailed analysis, the amount of beam entering the capillary was determined. This, combined with the measured transmitted currents, was used to determine the amount of charge deposited on the inner wall of the capillary which produces the guiding electric field. We show experimental results for fully, and partially, discharged conditions of the time evolution of the guided beam intensity following a wide range of times during which the capillary was allowed to discharge in order to provide information about the insulating surface charging and discharging rates. Combining our recent theoretical model describing the charge patch dynamics with these data, it is shown that the model is consistent with the experimental transmission curve data measured after the capillary was allowed to discharge for times ranging from 5 to 1000 s or longer and for injected currents that differed by a factor of 50. In contrast, models which do not include a dynamic rearrangement of charge along the surface prior to decay were found to be inconsistent with our experimental measurements. Additional data about the time dependences of the fraction of the injected beam which is transmitted as a function of injected beam current when transmission through the capillary is inhibited due to blocking are also presented. These data have a temporal dependence consistent with our model predictions that blocking occurs when the total capillary charge, i.e., the capillary potential, reaches a certain value.
DOI:10.1103/PhysRevA.99.062704
I. INTRODUCTION
Guiding of charged particles through insulating capillaries was first investigated by Stolterfoht et al. [1]. They found that the incoming beam travels through the capillary with- out charge exchange even when the tilt angle between the beam and the capillary axis is large and the beam, according to the geometry, must hit the inner wall of the capillary.
This indicates that the charged particles never contact the inner surface in their entire motion and they are somehow transported toward the exit of the capillary. This process is called “guiding” in the literature. The accepted interpre- tation as to why guiding occurs is that over time the in- coming beam generates a self-organized buildup of charge patches at various places on the capillary wall. These charge patches act as Coulomb mirrors which lead to elastic re- flections from the wall such that a portion of the incom- ing beam can be efficiently transported through the entire capillary. For keV ions, this reflection occurs at distances sufficiently large to greatly minimize charge transfer or in- elastic processes [1] whereas for MeV ions and electrons considerable energy loss can occur [2–4]. For both ions and electrons, guiding with ever diminishing efficiency has been observed for capillaries where the axis has been tilted by
several degrees with respect to the incoming beam direction [1,4,5].
Guiding has been studied using insulating foils like polyethylene-terephthalate (PET) [6,7], using solids such as silicon dioxide (SiO2) [8] and aluminum oxide (Al2O3) [9,10], in nanocapillaries with aspect ratios around 100, and in straight plus tapered glass capillaries [11–17]. Bombarding beams including highly and singly charged ions [1,2,18], electrons [3–5,19], and even exotic particles [20,21] have been proposed or tested. These studies have been summarized in three review articles [22–24]. Simulations and theoretical models of the charge buildup and particle transport through capillaries are also outlined in these reviews. Giglio et al.
[14,25] has also modeled the guiding of low-energy ions.
Most recently, spurred by the data presented here, Giglioet al.
[26] extended the theory to the time evolution and dynamics of the charge patch which is formed within the capillary as ions are injected.
Since its discovery, charged particle guiding has been of interest, in part to help understand the basic physics of interactions between charged particles and insulating surfaces, but also to investigate whether guiding can be exploited in other areas of research. For example, because guiding can pro- vide an efficient means of beam transport without significant
alteration of the beam energy or charge state and without the necessity of applying any external electric or magnetic fields, possible applications range from enhancement of the flux den- sity of exotic particle beams [21], to a method of generating microbeams [27–29], to a way to improve spectroscopic or imaging studies [30–33]. There are also various microbiologi- cal applications [34]. A possible medical application would be to use guiding for charged particle radiotherapy by injecting particles directly into tumor cells, with minimal damage to surrounding tissue.
In previous investigations of charged particle guiding, in- formation about the amount of beam injected into the capillary and thereby the amount of the deposited charge on the inner wall of the capillary generating the guiding electric field is generally not known or is only estimated using information and/or estimates about capillary diameters and densities. This means that the transmission efficiency can only be estimated and, except for a single study by Giglioet al.[25], information about the actual capillary charge is not available. The present paper was designed to fill this void by studying the transmis- sion of slow single charged 1-keV Ar ions through a macro- scopic glass capillary. Here, the amount of injected charge is determined from measured currents. Of equal importance, measurements performed after allowing the the capillary to discharge for a wide range of times provide information about the rates for discharging the capillary. This information is used to test the recent model of Giglio et al. [26], which attributes the guiding properties to the electric field produced by the dynamic behavior of the charge patches produced on the interior of the capillary when charged particles are injected. We show that applying this model to data measured for a wide range of discharge conditions and injected currents compresses all the measured data to a single curve of the guiding probability as a function of patch charge.
Details of the theoretical model are provided in Sec. II.
Section II A presents the assumptions of our model. In Sec. II B, we deduce from the model analytical expressions of the time evolution of the guiding electric field and ac- cumulated charge as pertaining to charge guiding for the present experimental geometry. We show how the charge deposition for guiding differs from the total charge deposited to the capillary, which is important for blocking of the guided beam. SectionII Cdiscusses the simulations and explains why secondary electrons (SEs) are vital for describing the charge guiding in glass tubes at higher beam intensities. SectionIII provides information about the experimental setup and how the injected and deposited charges were experimentally deter- mined. This is followed by time evolution curves which, when combined with our theoretical model, are shown to yield a
“universal guiding curve” as a function of deposited charge.
Blocking of the guided ions is also investigated. General comments and observations are given in Sec.IV.
II. THEORETICAL MODEL AND SIMULATIONS A. Assumptions of the model
We summarize in the following our model that describes the dynamics of the deposited charge in the insulating capil- lary. We consider a cylindrical capillary of dielectric constant
εr, of lengthH, and of inner and outer radiiR1 andR2. The entrance, exit, and outer surface are electrically grounded.
We assume that charge accumulates only at the inner surface and not in the bulk and can thus be represented by a surface charge density σ. A justification of this assumption and its consequences can be found in [26]. The dynamics of the surface charge density at the inner interface is eventually given by the surface continuity equation:
∂σ(s1,t)
∂t = −κbEr(s1,t)− ∂
∂z[κsEz(s1,t)]
− 1 R1
∂
∂θ[κsEθ(s1,t)]+Iinjγ(s1,t), (1) where all quantities are taken at the inner surface, s1= (R1, θ,z). The first right-hand term, which is proportional to the bulk conductivityκb, stands for the mobile charge carriers that are driven from the inner to the grounded outer surface by the radial componentEr of the electric field. The second and third right-hand terms account for surface currents and are proportional to the surface conductivityκs. They stand for the charge carriers that are field driven at the inner interface, respectively, along the symmetry axis by the tangential field Ez and along the angular direction by the tangential field Eθ. A detailed description of the boundary conditions used for the evaluation of the electric field is discussed in [26].
The last term represents the deposited charge per unit time and area and is proportional to the injected beam current Iinj. Integrating this term over the inner surface yields the deposited charge per unit time,Iinj
S1γ(s1,t)d2s1=qdep(t), where the distributionγ(s1,t) stands for the number of holes and electrons that are deposited at the inner insulating surface for each impacting ion.
Based on this model, we developed a numerical code, called InCa4D, which simulates ion trajectories through a cylindrical symmetric capillary. Short overviews about the numerical code are presented in [14,35], where InCa4D was used to demonstrate the ability of insulating conical capillaries to focus the injected ions beam. For this paper, we updated our numerical code so as to take also into account SEs generated at the inner capillary wall by ion impacts. The numerical code assumes that each Ar+ion that hits the inner surface injectsNh
holes at the impact point, which are immediately trapped by hole centers at the inner surface. Of theNhelectrons that are emitted from the impact point, one is picked up by the impact- ing Ar+ projectile, whileNSE=Nh−1 secondary electrons are emitted with a cosine angular distribution and propagated through the capillary until they hit the inner surface and are absorbed at the new impact point. The ejected SEs have an energy distributed according to a Poisson-like distribution peaked at 2 eV. We show in Sec.II C that the SEs tend to smear out the injected charge patches, which was found vital for explaining the observed transmission data of Sec.III D.
B. Theoretical estimation of the relaxation rates For the interpretation of the experimental data presented in Secs. III D–III F, Eq. (1) is used to provide analytical expressions that give the charge relaxation rate of a deposited charge patch at the inner wall or give the time evolution of guiding electric field or total charge in the capillary. In [26],
a general solution of the time evolution of a charge patch was deduced from the continuity equation (1) in the case of a glass tube, with the entrance, outer surface, and exit grounded. We summarize here briefly the findings of the analyses presented in [26] and give fitting functions that are suitable for analyzing the experimental data found in Sec.III.
The solution of (1) may be given as a linear combination of surface charge multipoles of angular mode m and wave number of indexn:
σ(θ,z,t)=
m0 n>0
σm,n(t) cos (mθ) sin nπ
H z
. (2)
The fact that in our experimental setup the exit is not grounded does not change significantly the following analyses and could be accounted for by simply replacing the sum over integern by an integral. Each multipole σm,n(t) satisfies a first-order differential equation, the solution of which is given by
σm,n(t)= σm,n(0) exp(−t/τm,n) +Iinj
t 0
γm,n(t) exp[(t−t)/τm,n]dt (3) with γm,n(t) being the multipole moment of the injected charge distribution per unit area and time and (τm,n)−1 the charge relaxation rate of the multipoleσm,n(t), obtained as the weighted sum of the bulkτb−1=εκrεb0 and surface relaxation rateτs−1 =ε0κRs1:
1
τm,n = bm,n
τb +cm,n
τs . (4)
Note that each moment σm,n(t) has its own charge relax- ation rate. The coefficients bm,n and cm,n depend only on the dimensions of the cylindrical capillary (R1,R2,H) and on the dielectric constantεr and contain thus the boundary conditions of the problem. For the capillary in question, the values of the coefficientsbm,nandcm,n are given in [26] for a large range of angular modemand wave number of indexn.
In the special case whereγm,n(t) can be considered inde- pendent of time, Eq. (3) simplifies to
σm,n(t)= σm,n(0) exp(−t/τm,n) +Iinjγm,nτm,n
1−exp
− t τm,n
, (5a)
which asymptotically yields
σm,n(t → ∞) =Iinjγm,nτm,n. (5b)
We will now apply these findings to our case, where the injected beam is tilted byβ=5◦with respect to the symmetry axis and has a diameter equal to the entrance diameter of the capillary. We assume that the deposited charge patch is already well described using a multipole expansion (2) limited ton R1Hsinβ N andm2. For a glass tube having the dimension of the one used in our experiment, we get for the
integer N =12. As shown in [26], the coefficientsbm2,nN
andc1m2,nNvary by less than 3% fornN,and can thus be assumed constant, so that
b0,nN 1,
b1,nN 0.82,c1,nN 0.17,
b2,nN 0.81,c2,nN 0.34. (6a) The “surface” coefficients form=0 are all very small com- pared to unity, c0,nN <0.021, meaning that the surface term contributes only to a minor extent to the total relaxation rate of the monopole modem=0 and may be neglected here.
As a result, we can define a total relaxation rateτ1
m τm,nN1 for each angular modem2,which is independent of the wave numbernN:
1 τ0 = 1
τb , 1 τ1
= 0.82 τb
+0.17 τs
, 1
τ2
= 0.81 τb
+0.34 τs
. (6b)
Having found the total relaxation rates for the first three angular moments, we can calculate the time evolution of the “guiding” electric field generated by a single deposited charge patch. The electric field can be deduced from (3) using the jump condition of the electric field through the interface separating two dielectric media. We are particularly interested in the time evolution of the field in the absence of an injected beam (γm,n=0), but after a preliminary precharging stage (σm,n(0) =0). The time evolution of the normal component of the electric field near the inner surface generated by a charge patch located at sp can be expressed as a sum of independent exponential functions, each corresponding to a different angular mode. Limiting the expansion to the first three angular moments yields
Er(sp,t)E0(sp) exp
−t τ0
+E1(sp) exp
−t τ1
+E2(sp) exp
−t τ2
. (7)
The amplitudesEm2are defined in [26] and are free param- eters of the fitting function. Usually, the monopole amplitude E0is an order of magnitude smaller than the higher multipoles and can be neglected in the analysis. Expression (7) will be used for the analyses of the experimental data in Secs.III D.
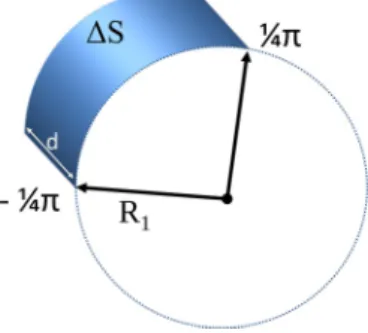
In the following, we will evaluate the time evolution of the charge Qpatch(t) of a single charge patch as well as that of the total charge Qtotal(t) accumulated in the capillary. These will be used to analyze the experimental data in Secs.III E andIII F. We define the “charge” of the patch Qpatch as the amount of charge accumulated on the small area S of the inner surface where most of the injected charge is expected to be deposited.Scorresponds to a surface of arc lengthπR1/2 and lengthdof a cylindrical surface, as illustrated in Fig.1.
FIG. 1. Scheme of the patch area.
We can now determine the time evolution of chargeQpatch by integrating the surface charge distribution overS:
Qpatch(t) 2
m=0
N
n=1
d 0
dz π
4
−π4
σm,n(t) sin (knz) cos (mθ)dθ.
(8) The integration of (8) yields a sum of three charge moments, each with its associated relaxation rate and source term:
Qpatch(t)= 2
m=0
qm(0) exp (−t/τm) +Iinj
t 0
m
t
exp[(t−t)/τm]dt. (9) The definitions of the initial charge moments qm2(0) of the patch and charge injection distribution per unit time m2(t) are given for completeness, with w0 =π2, w1=
√2, andw2 =1:
qm(0)=wmR1H N
n=1
1−cos (nπd/H)
nπ σm,n(0)m=0,1,2, (10a) m(t)=wmR1H
N
n=1
1−cos (nπd/H)
nπ γm,n(t)m=0,1,2.
(10b) From (9) we see that in addition to the bulk channel the charge of the patch decays also via the two surface channels (along the angular and axial direction), because it flows out of the integration area. The initial charge of the patch is given by the sum of the three initial charge moments:
Qpatch(0)q0(d,0)+q1(d,0)+q2(d,0). (11) Equation (9) will be used to estimate the amount of charge accumulated on surface area S. The decay of the total chargeQtotal(t) of the capillary is determined by integrating (3) over the whole inner surfaceS1. A general expression of the decay of the total charge is given in [26]. We give here an approximate expression that ignores the decay of the small portion of the charge located close to the grounded extremities of the capillary. Note that only the monopole term (m=0)
contributes to the total charge:
Qtotal(t)Qtotal(0) exp
−t 1
τb
+ t
0
Idep(t) exp
(t−t) 1
τb
dt (12) withIdep(t)=Iinj2π 0(t) being the deposited charge per unit time.
C. Simulations and discussion
The trajectories of the injected Ar+ and of the emitted SE are calculated by integrating the classical equation of motion, with the electric field being evaluated along the tra- jectory. The latter is deduced from the time-dependent surface charge distribution which evolves via (1). The beam has a kinetic energy of 1 keV and is tilted by 5° with respect to the symmetry axis. The initial position and velocities of the projectiles are sampled such as to produce a spatially uniform beam with a divergence of 0.15-deg half-opening angle and a root-mean-square (rms) emittance [36] of 0.3 mm mrad.
The initial conditions of the SE were outlined in Sec. II A.
The dimensions of the capillary in our simulations correspond to those used in our experimental setup, with H=43 mm, R1=0.29 mm, andR2=2.75 mm. The dielectric constant of the borosilicate capillary is εr=4.6.
Our model has two free parameters, namely, the bulk and surface conductivities. We took for the bulk conductivity of borosilicate at room temperature the typical value of κb= 1.5×10⁻¹⁵ S/cm [13,37], yielding a characteristic bulk de- pletion time of τb= εκ0εbr 270 s. The surface conductivity in borosilicate is not a well-known quantity and depends strongly on any adsorbed impurities. At room temperature, it is typically less than 10−15 S in dry environment. From the experimental data shown later in Fig. 7, we see that a nonzero transmission is found for injected intensities as low as Iinj=0.28 pA. For such low intensities, only one charge patch is formed close to the entrance and the transmission fraction stabilizes asymptotically to about 1%. We will use this information to determine the surface conductivity in our simulations. Assuming that mainly the dipole angular moment (m=1) of the charge distribution of the patch contributes to deflect the incoming beam, we deduce from (5b) that, in the asymptotic regime, the strength of the deflecting electric field is proportional to the factorIinjτ1. Here,τ1is the charge relaxation time of the dipole angular moment, which depends on the bulk and surface conductivity via Eq. (6b). So, for a given injected currentIinj, decreasingτ1 would decrease the strength of the deflecting electric fields. This sets a lower limit to the charge relaxation time,τ1, or alternatively using (6b) a higher limit to the surface conductivityκs. We found from our simulations, by varying the surface conductivity, thatκs must be no larger than 5 × 10⁻¹⁶ S if 1% transmis- sion should be observed forIinj=0.28 pA. Simulations also showed that taking κs=3 × 10⁻¹⁶S yields a transmission fraction which is too high compared to the observed one.
Thus we deduce from our simulation that 3 × 10⁻¹⁶ < κs<
5 × 10⁻¹⁶ S. Consequently, we used κs=5 × 10⁻¹⁶ S, which is in approximate agreement with the measured surface
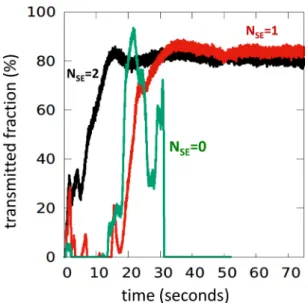
FIG. 2. Simulated transmitted fraction of a 12-pA Ar+ beam through the 5° tilted capillary tube as a function of time. The green curve stands for the simulation without secondary electrons (NSE=0). The red and black curves stand for the simulations with, respectively, one and two secondary electrons emitted per ion impact.
conductivities of Pyrex borosilicate glass [13,37]. This yields a surface relaxation time of τs= ε0κRs1 =5.2 s. By the use of (6b), we see that the dipole relaxation rateτ1−1= 0270.82 +
0.17
5.2 =3.0+32.7 mHz is dominated by the surface channel.
Using these values, we simulated the time evolution of the transmitted beam fraction forIinjranging from 0.28 to 50 pA.
When ignoring the secondary electron production (NSE=0), no stable transmission could be simulated for beam intensities Iinj>8 pA. We found that up to ten patches are formed inside the capillary by a 12-pA beam, which results in an unstable transmission that eventually stops (see green curve labeledNSE =0 in Fig. 2). This, however, conflicts with the experimental data shown in Fig.7, where a stable transmitted fraction, forIinj=12 pA, is observed for at least 500 s. We could not simply use a larger surface conductivity in our simulations because a larger surface conductivity would lead to zero ion transmission for Iinj=0.28 pA, which, as said before, conflicts with the observed experimental data.
To address this conflict, we updated our numerical model to track the SE generated by ion impacts at the inner surface.
We expected the secondary electron emission to smear out the charge patches and possibly avoid blocking of the trans- mission at higher intensities. Most secondary electrons were found to fall back to the emitting surface some hundreds of micrometers away from the point at which they were emitted (see Fig.3). This helps to redistribute the charge of the patch in a way that weakens the deflecting force of the patch, giving rise to a lower number of patches (∼4) and eventually to a stable transmission as seen in Fig.2. The case NSE=2 gives the best agreement with our experimental data. WithNSE=2, we were able to simulate a stable transmission for injected current ranging from 0.26 to 50 pA.
Using NSE=2, Fig. 3 shows snapshots of the charge distribution and trajectories at various times for a 12-pA injected beam. The simulation shows that a few seconds after
beam injection (upper panel of Fig. 3) three charge patches have formed, two on the upper surface and one on the lower surface. The electric fields from these patches are sufficient to deflect the incoming beam and already a transmitted fraction of 30% through the entire capillary is observed. There is also an indication that an additional charge patch will soon be formed on the lower surface near the exit of the capillary. The middle panel shows that at a later time (11 s) the “guiding electric fields” have caused the beam to interact closer to the capillary entrance, thus producing a new charge patch further downstream. Now, about 60% of the injected beam is transmitted. After additional time (bottom panel), except for the charge patch closer to the capillary entrance, the previously formed patches are now weaker while a fairly uniform charge layer has formed along the last quarter of the capillary. This leads to a significant portion (80%) of the injected beam being transmitted. All these features are in qualitative agreement with various simulations that have been performed to date. However, our current simulations provide additional information and valuable insight into the guiding process, since they also model and track the redistribution of the charge deposited on the capillary surface. This redistri- bution is seen by the intensities opposite the charge patches formed where the beam impacts the surface. For example, in the upper panel of Fig.3, the beam interacts with the upper surface at horizontal positions of approximately 2 and 30 mm and with the lower surface at 15 mm. However, in the last panel of Fig. 3, our simulations show that some of the charge patch produced on the upper or lower surface during the first few seconds has moved along the circumference with the result being less intense patches of charge on the opposite surface at the same horizontal distances. This redistribution of charge is most obvious near the capillary entrance. Thus, our simulations imply that a portion of the deposited (or created) charge rather quickly moves away from its original location with much of it moving to the opposite side. This weakens the electric field precisely in the regions which contribute to the guiding process. Our model incorporates these features and, as will be shown, is compatible with experimental data obtained for a wide range of conditions.
III. EXPERIMENT A. Apparatus
For the current guiding studies, a 43-mm-long borosilicate glass capillary having inner and outer diameters,D1andD2, of 0.58 and 5.5 mm was used. The capillary was inserted in an aluminum holder, mounted on an xyzθ positioner. In the normal configuration, a conducting layer of aluminum tape and silver paint with an opening matching the capillary inner diameter covered the entrance surface of the capillary with the exit surface left uncovered. To investigate if different paths allowing charge flow to ground were important, some data were also collected using a “reversed” configuration where the entrance surface was uncovered and the exit surface, although covered by the aluminum tape and silver paint, was not in contact with the ground. Approximately 1 cm upstream from the capillary entrance a movable plate with a D0=1-mm-diameter aperture was used to collimate a beam
FIG. 3. Snapshots of Ar+trajectories (black lines), projected on thexaxis, through the glass capillary at 4, 11, and 74 s after the beam is injected. The injected intensity was 12 pA and the beam was tilted by 5° with respect to the capillary axis. The horizontal black lines at x= ±0.29 mm show the inner capillary surfaces. Above and below the surface lines, the red curves show the intensity (arbitrary units) of the positive charge patches at the inner surfaces. Note that fort=74 s the amount of charge on the lower surface at the entrance is due to surface charge relaxation along the angular direction. The blue dashed lines are the trajectories of secondary electrons emitted from the impact point.
Here we used NSE=2.
of 1-keV Ar+ions. By moving either the plate or the capillary holder, the beam could be centered or scanned across the entrance of the capillary. For higher intensity beams, the current impacting the capillary entrance,Ihold, and the current transmitted through the capillary, Itrans (see Fig. 4), were recorded using the digitized outputs of electrometers and a computer. For much lower beam intensities, the transmitted beam was monitored via pulse counting using a channel-plate detector. In this case the transmitted beam intensity was cal- culated using information about the detection efficiency [38]
and the transmission through a grid across the channel-plate entrance.
B. Injected and transmitted beam as a function of beam-capillary overlap
When the collimating aperture is offset sufficiently such that no beam enters the capillary, the current of the capillary-
FIG. 4. Schematic of the apparatus showing the input aperture, the capillary and holder, the transmitted beam collection, plus the various currents that are involved.
holder systemIholdoffsetconsists of the positive ion-beam current that passes through the aperture, Ibeam, plus the secondary electron current produced by the beam hitting the capillary front surface and/or the aluminum holder, Isec, minus any secondary electrons produced upstream at the aperture or beamline or in the residual gas (stray electrons) that are absorbed by the holder, Istray (see Fig. 4). As the aperture overlaps the capillary entrance, some of the incoming beam
is injected into the capillary, Iinject, which results in fewer secondary electrons being produced at the capillary entrance, Isec . In contrast, Istray is assumed independent of the holder position (centered or offset). The amount of current that is transmitted through the capillary is Itrans. The deposited charge per unit time at the inner wall is the difference between the injected and transmitted current, Idep=Iinject− Itrans. These currents are shown schematically in Fig.4. The currents at the offset and centered positions of the capillary are
Iholdoffset=Ibeam−Istray+Isec and Itrans=0 offset position, (13a)
Iholdcentered =Ibeam−Istray−Itrans+Isec and Itrans>0 centered positions. (13b)
Unfortunately, Eq. (13b) does not depend explicitly on the injected currentIinject. OnlyItransappears in (13b) withIdep, the current that is deposited in the capillary wall, being included in Iholdcentered. But Iinject can be extracted from the measured currents, that is,Iholdoffset, Iholdcentered, andItrans. Assuming the beam Ibeam to be spatially uniform, when the capillary is centered on the input aperture,Iinject can be estimated from Ibeam by considering the ratio between the geometrical areas of the capillary entrance and the collimating aperture:
Iinject= D21
D20Ibeam=0.34Ibeam 1
3Ibeam. (14) Equations (13) can be used to determineIbeamifIstray,Isec, andIsec are known. For Isec andIsec , in the offset position, the secondary electron yield is assumed to be proportional to the beam current that passes through the aperture and hits the aluminum holder, with the proportionality factorδ being the average number of secondary electrons emitted per ion impact:
Isec=δIbeam, (15)
ForIsec , the injected current must be subtracted from the beam current, so that
Isec =δ (Ibeam−Iinject) 23Isec. (16) By biasing and not biasing the aluminum plate used to measureItrans, we obtained a value forδ of 0.15±0.1 which is comparable to values quoted in the literature for slightly oxidized aluminum [39].
Isprayis also assumed to be proportional toIbeam:
Istray=ηIbeam. (17)
The factorηwas determined by comparing the currents mea- sured at the offset and centered positions when the collimating aperture plate was biased by ± 9 V and comparing these to currents measured when no bias was applied. These data yieldedη=0.19±0.05. We can now deduce from (13a) and (13b) an expression for the beam currentIbeamas a function of the measured currents:
Ibeam(1−η)=
Iholdcentered+Itrans
(3−2A), (18)
withA= Iholdoffset
Iholdcentered+Itrans = 1−η+δ
1−η+2δ/3. (19) As A can be expressed as a function of the measured currents, determiningIbeamdoes not require knowingδ. Within our assumptions, the right-hand term in (19) implies thatAis constant for all source currents. Indeed, forIholdoffsetranging from 17 to 90 pA, our measurements confirmed thatAis constant and equal to 1.10±0.05. On the other hand, using the esti- mated values forηandδyields A=1.06+0.04. Taking the mean value ofA1.08,combined with the uncertainty inη, we obtainIbeam=1.06± 0.10 (Iholdcentered+Itrans). Finally, the injected current is deduced from (14):
Iinject 0.36±0.03
Iholdcentered+Itrans
. (20) Expression (20) allows the determination of the injected current during the transmission measurements given in the sections below. Note that the±9% uncertainty does not in- clude uncertainties in the measured currents,IholdcenteredandItrans, which are assumed to be roughly 3% each. Thus, the overall deposited charges from Eqs. (9) and (12) are expected to be accurate with approximately±15%.
We performed scans, where the capillary entrance was moved across the 1-mm-diameter aperture. Examples are shown in Fig.5, where the yellow boxes illustrate the capillary walls. The horizontal axis is the offset between the capillary entrance and the input aperture where zero offset indicates that the incoming beam is centered on the entrance of the capillary. The left figure is for a capillary axis aligned with the incoming beam while the right figure is for a capillary rotated by 5◦. The inset in the left figure shows a schematic picture of the collimated ion beam (blue) transmitted through the collimating aperture and impacting the capillary entrance and holder. The magenta regions illustrate secondary electrons produced by the portion of the incoming beam that hits the collimating aperture. Not shown is any secondary electron emission produced by the incoming ion beam hitting the capillary entrance.
The measured currents show a dip inIhold, the filled blue squares, and a peak in Itrans, the filled and open red circles.
The dip and peak are well fitted by a function giving the
FIG. 5. The measured capillary and holder (blue squares) and transmitted (red circles) currents,IholdandItrans, as the capillary is scanned across the beam collimating aperture for an aligned and rotated capillary (left and right figures). The black x’s show a straight line projection of Iholdmeasured at the offset positions which are approximately the beam current. The horizontal black bars show the amount of current entering the capillary,Iinject, which is determined as described in the text. For the rotated capillary, measured values as the beam is scanned in opposite directions are shown.
geometrical overlap of the capillary entrance and the aperture which falls by 50% for an offset of 0.5 mm. This confirms that the profile of the beam has not varied significantly over a distance of 0.5 mm from the beam axis, justifying our assump- tion of a uniform beam. The black x’s show an interpolation of Iholdoffset, which from Eqs. (13a), (15), and (17) is approximately the incoming beam intensity, Ibeam. We see that as the beam is injected into the capillaryIbeam is larger thanIhold+Itrans, shown by the magenta stars. This difference is mainly due to Isec, which varies by roughly 35% during the scan. The amount of current injected into the capillary,Iinject, which is calculated from Eq. (20), gives values shown by the horizontal black bars with the width of the bars indicating the values obtained from the two equations.
Thus, for the aligned capillary 79% of the incoming beam was transmitted while 21% was deposited during transport.
When the capillary was rotated by 5◦ a lower transmission was found, e.g., approximately 53%, meaning more charge was deposited.
C. Time evolutions of the injected, transmitted, and deposited currents
The temporal behaviors of the currents entering the capil- lary, being deposited in the capillary, and transmitted (guided) through a capillary tilted by 5◦were studied using an incom- ing beam intensity estimated to be 30 pA using Eq. (18). This was done by maximizing the transmitted current through the rotated capillary after waiting sufficiently long for it to reach saturation. Then the beam was physically blocked to allow the capillary to discharge. After readmitting the beam, the currents impacting and exiting the capillary were recorded approximately every second. To ensure that the incoming beam remained stable during this time the upstream beam current was also monitored, either via a grid placed in the
beamline or by the amount of current on the collimating aperture.
An example of the temporal behavior of the injected, deposited, and transmitted currents for a fully discharged cap- illary is shown in Fig.6. The measured quantities, shown by solid lines, are the currents recorded at the capillary entrance and after transmission,Iholdcentered andItrans. The incoming beam current after the collimating aperture (the dashed gray line)
FIG. 6. Time dependences for the various capillary currents fol- lowing a 20-min discharge time. Data are for 1-keV Ar+ions and a capillary rotation of 5◦. The measured quantities wereIholdcenteredand Itrans, (the blue and red solid curves in the online version). From these, dashed lines show calculated values for the incoming current, ap- proximatelyIholdcentered+Itrans; the current entering the capillary,Iinject; and the current deposited as the beam transits the capillary,Idep. See text for details.
is obtained by Eq. (18). The slight decrease seen is attributed to the suppression of secondary electrons produced inside the capillary which are initially lost until the capillary becomes charged. We estimated that this loss would initially increase Itrans by approximately 0.07Iinject. This range is shown by the horizontal yellow band and is in reasonable agreement with the data.
The injected current is deduced using (20). In this case, the injected current,Iinject, is 52% of the capillary holder current after the transmitted current (the solid red line) has saturated.
Both of these are in accordance with statements above. The deposited current (the dashed green line) is the difference betweenIinjectandItrans. It is important to note that the absolute magnitude ofIdep depends on our assumption of the amount of the incoming beam that enters the capillary. Slight changes in beam focusing or imperfect overlap can change this value, e.g., increasing or decreasing this fraction by 10% results in similar, but opposite, changes inIdepand in the relative amount of the beam that is transmitted. The important information in Fig. 6 is that for more intense beams initially virtually all of the incoming current (charge) is deposited, but as time progresses the transmission of the guided beam increases and the charging rate decreases.
Using a rotated capillary, Iholdcentered andItrans currents were measured as a function of time. This provided information about the capillary charging rate and the guiding efficiency, i.e., the “standard” guiding study.
(1) The temporal behavior was studied following different times during which the incoming beam was blocked. This provided information about the capillary discharging rates.
(2) The temporal behaviors were studied using a higher beam intensity, i.e., when the charging rate is comparable to, or larger than, the discharging rate and when a large percentage of the injected beam is transmitted through the capillary, and for much lower beam intensities when the charging rate is much slower and only a small fraction of the beam is transmitted.
(3) The temporal behavior was also studied using a low in- tensity beam and a reversed capillary, e.g., when the entrance is an insulating surface and the exit, although coated with a conductive layer, was not in contact with the ground. This was done to study whether different paths for surface charges to flow to ground were important.
By combining these pieces of information and a theoretical model for charging and discharging the capillary (in [26] and this paper), the capillary charge as a function of time was determined. Thus, the guiding probability as a function of capillary charge could also be determined. As a result, it will be shown that the transmission curves obtained for a wide range of charging and discharging conditions and for vastly different injected currents can be brought together to form a single curve for the guiding probability as a function of the
“effective guiding charge.”
D. Capillary charging and discharging times obtained experimentally
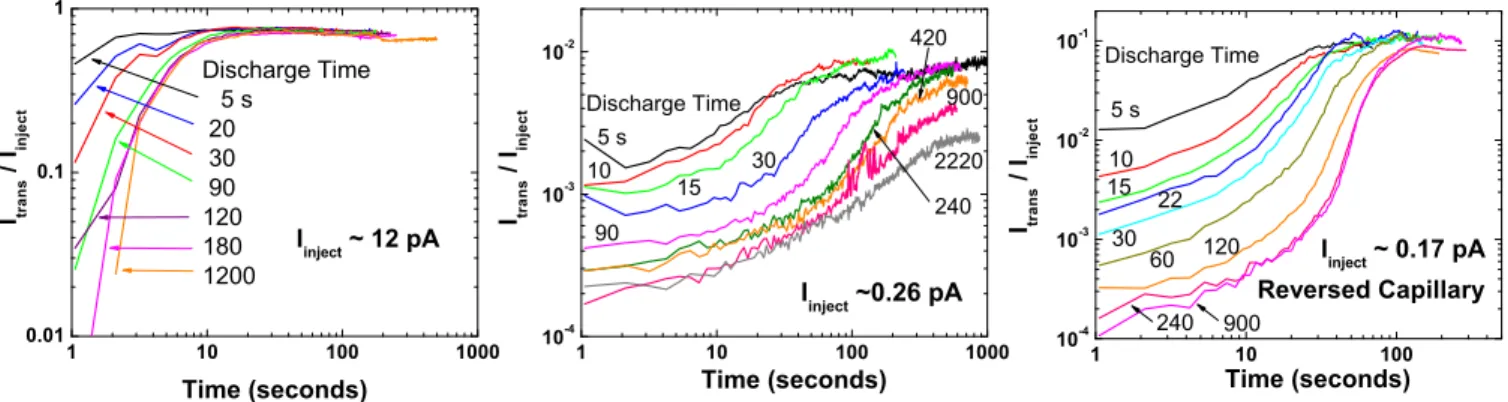
To obtain information about the capillary charging and discharging times, the transmitted beam was monitored until it maximized and remained constant. Then the beam was prohibited from entering for varying lengths of time (5 to 1000+s) after which it was readmitted and time scans were recorded. During the time the beam was absent, the capillary charge flowed from its deposition region along the capillary surface and through the bulk, thus decreasing the guiding field. When the beam was readmitted, any remaining charge led to some amount of initial ion guiding. Examples of these data for a larger and smaller beam intensity,Iinject∼12 and 0.26 pA, are shown in Fig.7. Data are also shown for a small injected beam intensity but where the “discharge geometry”
has been altered by reversing the capillary such that the entrance surface is now an uncovered insulator while the exit has a conductive surface that is not connected to the ground.
With decreasing discharge time there is a systematic in- crease in the initial amount of the transmitted beam. At the higher beam intensity, it takes about 15–20 s to produce maxi- mum transmission through the capillary. Decreasing the beam intensity by roughly a factor of 50 increases the charging times by about the same factor. These data show that for our higher beam intensity approximately half of the incoming particles are guided through the capillary whereas reducing the beam intensity appears to significantly reduce the maximum trans- mission probability. Regarding the maximum transmission probability, remember that the values shown are subject to our calculated values for the injected current. This is particularly important for the reversed capillary situation where no data
FIG. 7. Time dependences of ion transmission through the capillary following different times during which the capillary discharges. Left, 12-pA injected beam; center, 0.26-pA injected beam; right, 0.17-pA estimated injected beam and reversed capillary where the entrance surface is an insulator.
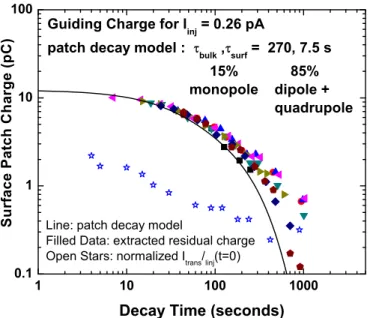
FIG. 8. The capillary charge, determined as described in the text, as a function of discharge time. The open stars are normalized values ofItrans/Iinjectmeasured just after the beam is reinjected after specific blocking times, a method used in Ref. [1]. The solid symbols are determined using Eq. (9), as described in the text. The solid curve is calculated using the parameters listed and the decay portion of Eq. (9).
for scans across the capillary entrance were made. For the low beam current data, the transmitted beam detection efficiencies that were used also play a role. As seen, although features such as the maximum fraction of the injected beam that is transmitted and how rapidly this is achieved differ, in all cases after a discharge time of a few minutes initially there is little beam transmission and the curves for particular injected beam intensities are virtually identical. Thus, within a few minutes any effective guiding charge or more precisely guiding electric field has drained away.
To obtain the discharging times from these data, two meth- ods were used. Initially we followed the procedure used by Stolterfoht et al. [1] where the decrease in the transmitted current was plotted versus the discharge time and fitted to an exponential function. In our case the transmission fractions, i.e.,Itrans/Iinject, just after the beam was readmitted divided by those before the beam was stopped were plotted versus the time the beam was absent, i.e., the capillary discharge time.
An example of this where the fractions have been normalized to an initial capillary charge is shown by the stars in Fig. 8.
This method indicates that there must be a rapid decrease during the first few seconds (which our experimental method did not allow us to observe) followed by the slow decrease seen in Fig. 8. Although not as evident in this set of data, overall for very long decay times this method indicated either a plateau, which we interpreted as due to a small portion of the beam being transmitted via scattering, or a guiding process.
To fit these data, three exponential decays having different relative magnitudes were required. But, by trial and error, we found that the growth curves after various capillary decay times (shown in Fig.7) could only be brought together to form
a single guiding curve if the dominant exponential decay term was ignored.
These decay data are also inconsistent with an alternative method, based on the patch decay model discussed here and in Ref. [26]. The alternative method consisted of manually reading the times when each of the growth curves shown in Fig.7has a certain value of Itrans/Iinject. Plotting these times versus the time the capillary charge was allowed to decay yielded curves the extrapolations of which determined the times when the capillary was fully discharged for each value ofItrans/Iinject, i.e., the infinite decay time for a specific value of Itrans/Iinject. Then, using the charge deposition portion of Eq. (9) the amount of deposited charge was calculated for each decay time used. When subtracted from the time calculated for an infinite decay time, the amount of charge still remaining from a previous beam injection, i.e., the first right-hand term in Eq. (9), was obtained. Plotting these values for the “residual decaying charge” versus the decay time, i.e., the time that the beam was stopped plus the manually extracted times, for each value ofItrans/Iinject and each growth curve, and adjusting the probabilities,,and surface decay lifetime,τs, to provide the best visual compression of the data yields information about the charge patch decay, as shown by the solid symbols in Fig.8. For this, we fixed the time constant for the bulk decay at τb=270 s and used equal weighting for the dipole and quadrupolevalues.
The example shown is for an injected current of 0.26 pA where only a small amount of beam is transmitted. This allows performing the integrations in Eq. (9) analytically asIdep(t), and hence(t), is a constant. Here our data imply that∼15%
of the charge patch decays via the monopole term which is dominated by the bulk decay constant. The vast majority of the charge patch decays via the dipole and quadrupole terms by moving radially and longitudinally along the interior surface of the capillary with a time constant of∼7 s. These experimentally derived values are compared with the model predictions (the solid line) given by the first term of Eq. (9) where the second term, evaluated att = ∞, provides values for the variousqm(0) with their sum being approximately 12 pC in the example shown.
Similar procedures were used for our much higher in- jected beam intensity of 12 pA and for our reversed capillary configuration where the injected beam intensity was 0.17 pA. For the reversed configuration where again an analytic integration was possible, τs was∼7 s while the percentage of the decay via the monopole and dipole + quadrupole terms was 5 and 95%. For the 12-pA data where the trans- mission is significant, a numerical integration was required.
To accomplish this, since the deposited current decreases rapidly during the first seconds, a fitting procedure of Idep
was used. Here the best values for overall compression of the data were τs=4.5 s and decay percentages via the monopole and dipole+quadrupole terms of 2 and 98%. We must point out that the quoted lifetimes and percentages are subject to the model described above. Plus they are slightly coupled, i.e., changing the fractional percentages influences the “best” value for τs. However, as will be shown in the next section, the quoted values and our model are compatible with experimental data we obtained using a wide variety of conditions.
FIG. 9. The guided beam fraction as a function of charge-patch intensity. The data are from Fig. 7. The monopole-to-dipole ratio and surface-charge-decay lifetime parameters used in Eq. (9) to calculate the patch charge, i.e., the guiding charge, are (i) normal configuration: 0.26 pA, 15/85%, and 7 s; 12 pA, 2/98%, and 4.5 s;
(ii) reversed configuration: 0.17 pA, 5/95%, and 7 s.
Thus, our data corroborate that the guiding field can be ex- pressed as a sum of exponential functions, where the functions stand for the monopole, dipole, and quadrupole moment of the charge patch. Each exponential function has its own relaxation rate, which is a weighted sum of the bulk and surface relax- ation rates [26]. This means that an overall exponential charge decay does not stand for one particular relaxation channel, but that all three relaxation channels (as defined in section
“Theoretical model”) contribute, with various weights, to each multipole. This differs from previous theoretical models [19,40] which assume that two decay rates, one associated with the capillary surface conductivity and one associated with the bulk conductivity, combine to form a single overall charge decay rate similar to our Eq. (12).
Before moving to the next section, some comments re- garding the present analysis and the work of Stolterfoht et al. [1] and Giglio et al. [25] where only a single decay channel appeared to be adequate are in order. In the study by Giglioet al.only the total charge was monitored, so only the monopole term is relevant, e.g., our Eq. (12) for the total charge decay. Stolterfoht et al. used PET nanocapillaries, which have a bulk conductivity three orders of magnitude larger than borosilicate. This, combined with the lack of short decay times in their investigation and the different geometry for the electric field, may be the reasons why only a single long-time exponential decay was observed.
E. Probability of guiding as a function of the capillary charge Using Eq. (9) and the quantities discussed in the previous section, the guiding probability as a function of residual patch charge is shown in Fig. 9for the three configurations studied. As seen, for the “normal” configuration where the entrance surface is a conductor connected to the ground the
transmitted beam increases very slowly until the capillary charge is approximately 10 pC. This is followed by a very rapid increase in guided current until approximately 60 pC when a maximum and plateau are reached. As seen, approx- imately 70% of the injected beam is ultimately transmitted (guided) through the capillary. Thus, the apparent saturation plateaus (seen in Fig. 7) for the time dependences for the low injection currents occur because the deposited charge is limited by the leakage current rather than an inherent limitation in the guiding capability of our capillary.
In spite of several approximations and experimental un- certainties associated with extracting times and performing a numerical integration for the 12-pA data, excellent com- pression for the various decay time curves plus continuity between two quite different injected currents are seen. For the reversed capillary configuration where the entrance surface is an insulator, thus providing a longer pathway for the surface charge to move to the ground, again we see a slow increase followed by a rapid increase in beam transmission. The major difference for the reversed configuration is an onset in guiding for a lower capillary charge. This seems to imply that without a more direct pathway to the ground less deposited charge drains away, thus allowing a higher electric field to form, which is necessary to guide the injected beam through the capillary. Linear plots of the data in Fig.9showed that above and below the transition between the slow and rapid increase in guiding, i.e., below and above approximately 15 and 3 pC for the “normal” and reversed configurations, the guiding fractions scale in a linear fashion with the guiding charge, i.e., with the guiding field, and that above the transition, i.e., when sufficient charge has been deposited to deflect much of the incoming beam, the “guiding efficiency” is a couple hundred times better. We note that the transition point is in approximate correspondence with when our simulations show the formation of downstream charge patches.
These data also provide information about the “effective”
surface conductivity, i.e., the conductivity modified by any surface contamination. We found that in the region where the guiding fraction was rapidly increasing during the first few seconds, e.g., for the 12-pA data, the compression for the various decay time curves was quite sensitive to the value of τs. Since the surface conductivity is inversely proportional to τs, future carefully performed beam guiding measurements for such conditions might provide an indirect means of measuring the effective surface conductivity of whatever capillary is used. Our presently determined values based on a coarser time grid and an eyeball determination of the best data compression yield a value forκsof 2.3±0.5×10⁻¹⁶S for our borosilicate capillary which is in good agreement with the measurements of Gruber et al.[13] and more in line with the lower limit estimate quoted in our simulations discussion.
As a final comment, we note that for both the “normal”
and “reversed” configurations when the capillary charge is small about 0.02% of the injected beam is transmitted through the capillary. In the event that this could be due to scattering processes not associated with the guiding fields we subtracted a constant background from the growth curves. The question was whether the guiding charge has a defined threshold fol- lowed by a rapid increase. After subtraction, no threshold was found.
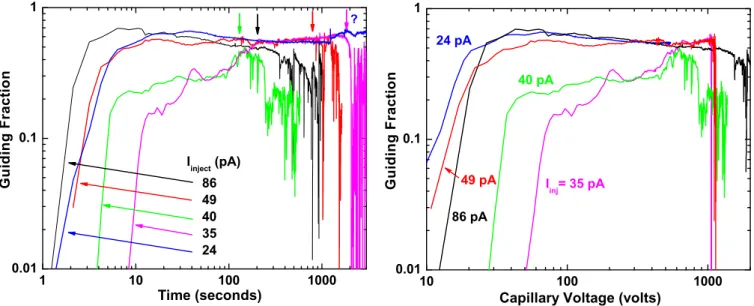
FIG. 10. The probability of guiding for various injected currents large enough to result in blocking. In the left figure, the arrows and the question mark at the top indicate the approximate times when blocking occurs for injected currents of 40, 86, 49, 35, and 24 pA. The right figure shows the guiding efficiency vs the capillary voltage. See text for details.
F. Blocking of beam transmission
The final aspect of guiding that was studied is the so- called blocking phenomenon. This is typically observed for higher beam intensities as a sudden decrease in transmission, typically long after the guided beam fraction has saturated. In a study by Dassanayakeet al.[41] using electron beams, the sudden decrease in transmission was observed to be followed by a slow recovery, with the cycle eventually repeating. Sev- eral other studies of blocking have also been performed using nanocapillaries (see [42–44] and references therein). The only quantitative study involving macroscopic capillaries that we are aware of is that of Giglioet al.[25] where they concluded that when the inside capillary potential becomes large enough due to the accumulated injected/produced charge the injected beam is prohibited from entering. Thus, there is no transmitted beam.
In our model, if we assume that the total capillary charge decay is dominated by the bulk relaxation rate, i.e., if we ignore the charge rearrangement and decay processes due to the surface channel, the temporal dynamics of the total charge of an initially discharged capillary is given by (12)
Q(t) t
0
Idep(t) exp t−t
τb
dt. (21) In the case of a stable asymptotic regime, the source term is time-independentIdep(t)=Idep∞ and the charge tends asymp- totically to
Q(∞)= Idep∞τb. (22) As stated, the study by Giglio et al. [25] implied blocking should occur when the capillary potential is equal to that of the beam. For the current geometry, this means that blocking will occur when Q=CVs, where Cis the capillary capaci- tance given byC= ln(R2π02/rRH1) ∼4.9 pF andVs=1000 V is the extraction potential for the injected beam. Thus, according to
Eq. (11), blocking will occur whenever Idep∞ CVs
τb
∼17 pA. (23)
However, for Idep∞ =17 pA, it will take an infinite time for blocking to occur. But for larger currents, and an initially fully discharged capillary, blocking should occur at finite times.
These predictions were tested using higher intensity beams where we tracked the guiding efficiency until blocking ap- peared to take place. The left part of Fig.10shows the results of these measurements. The vertical arrows indicate where blocking appears to take place with the 24-pA curve being uncertain. We note that for these data the asymptotic trans- mission is roughly 50% of the injected currents listed, thus Idep∞∼0.5Iinj. We deduce from (23) that Coulomb blocking can be expected for injected currents larger than 34 pA. This is indeed corroborated by the transmission curves in Fig.10.
OnlyIinj=26 pA seems to avoid blocking during the obser- vation time whileIinj=49 pA already experiences Coulomb blocking. Without surprise, with even higher injected currents, blocking appears earlier in time. Integrating numerically (21) with Idep(t)=Iinj−Itrans(t) yields the accumulated charge Q(t) in the capillary. Using the capacityC=4.9 pF of the capillary allows estimating the time evolution of the average potential,V(t)=Q(t)/C, in the capillary. The latter is shown in the right portion of Fig. 10 for the listed currents and gives an average “blocking” potential of about 1130±290 V, which, based on single measurements for each injected current, is comparable to the 1-kV potential of the ion source.
The voltage plot also illustrates that for the 24-pA injected current the maximum capillary voltage is always less than the beam voltage; hence no blocking occurs.
Further investigations are needed but such information is important for practical applications of beam guiding as such studies provide information about the minimum injected current needed to maximize the guiding efficiency [approxi- mately 0.5 pA using the information from Figs.9and10and