Modeling of a pH–tunable dual–response nanopore sensor
Bence Hohla, Eszter M´adaia,b, Dezs˝o Bodaa, M´onika Valisk´oa,∗
aDepartment of Physical Chemistry, University of Pannonia, P.O. Box 158, H-8201 Veszpr´em, Hungary
bUniversit´e de Li`ege, CESAM-SPIN, Institut de Physique B5a, All´ee du Six Aoˆut 19, B-4000 Li`ege, Belgium
Abstract
We consider a nanopore sensor model proposed previously (M´adai et al. J. Mol. Liq. 283 (2019) 391–398) by extending our study to the effect of pH that is an experimentally controllable parameter. With pH, we can tune the protonation and deprotonation states of the functional groups on the nanopore’s wall, and, thus, the charge pattern that strongly influences the ionic current. Sensing is based on the selective binding of analyte ions in the right-hand-side binding region of the pore. The left-hand-side region is a buffer region that determines the main charge carrier. We show that we can optimize the sensitivity of the sensor with pH by creating a bipolar pore, where the buffer region is positive and the binding region is negative. Anions that carry the current are attracted into the pore by the positive analyte ions. The device is dual response, because the nanopore is rectifying: we can use the relative current (in relation to the current in the absence of analyte) and rectification as device functions. We model the electrolyte with charge hard spheres in implicit water, and the binding potential with the square-well potential. The Nernst-Planck equation coupled to Local Equilibrium Monte Carlo simulations is used to compute the ionic flux.
1. Introduction
Nanosensors whose function is based on nanopores respond to the presence of analyte molecules by a change in the ionic current flowing through the nanopore. The chemical basis of the sensitivity of the nanopore to the analyte is the selective binding of these molecules by their conjugated pairs with which the nanopore’s wall is functionalized. The nanometer dimension of the pore radius is important, because it allows a delicate balance of various kinds of interactions between ions, analyte molecules (generally, charged ones, so, also ions), binding molecules, surface charge, and applied field. If the behavior of any player in this complex interplay changes due to, for example, a change in concentration, even a small analyte concentration can be identified [1–12].
If the analyte molecule’s residence time at the binding site is long, even single–molecule events can be detected with, for example, the resistive pulse sensing technique [13–15]. If the strength of binding is relatively weak (non-covalent association), the analyte molecules bind and unbind many times during the time of measurement. The large number of such reversible events form an ensemble, therefore, statistical methods can be used for quantitative analysis. These are called ensemble methods and form the basis of our model studied by Monte Carlo (MC) simulations. The advantage of nanopore sensors is that the average response of the sensor to the presence of analyte molecules manifests itself in a well-measurable change in the electrical current.
Experimental works reporting specific examples for “host–guest” pairs of analyte molecules and molecules that bind them are plentiful in the experimental literature. Analyte ions have a wide range of
∗Author to whom correspondence should be addressed. E-mail address: valisko@almos.vein.hu
selection from inorganic ions [16–19, 19–27, 27], to amino acids [28, 29], and sugars [30]. The molecules that bind them are specific to the analyte. In chemical nature they can be very different from crown ethers to polymers and peptides. A more detailed list of “host–guest” pairs is found in our previous papers [31, 32] and in the review of Howorka and Siwy [2] in a tabulated form.
For this work, those experimental references are the important ones, where pH is used to tune the features of the nanopore via controlling its charge pattern [16–18, 29, 30, 33–42].
One specific example is the one of Vlassiouk et al. [29] that was a major inspiration of our model.
They functionalized a conical nanopore with γDPGA antibodies thus creating a pH-dependent charge asymmetry that superimposed the geometrical asymmetry. The pH-sensitive balance of the two kinds of asymmetries resulted in an inversion of rectification as a function of pH. AddingγDPGA glutamic acids changed the charge pattern and modulated this balance. This is also a dual response channel sensitive to both pH and binding of analyte molecules.
Another inspiring example was the study of Ali et al. [18] who functionalized a nanopore with phosphate-rich polyacid chains that bound Ca2+ ions. The degree of binding depended on pH that tuned the protonation degree of the phosphate groups. The Ca2+ ions were bound most efficiently at pH = 9, when the phosphate groups were fully deprotonated. At this pH, the current-voltage curves were sensitive to the concentration of Ca2+.
Our model sensor has an asymmetric charge pattern on the wall along the pore. The left 2/3 of the pore is a buffer region whose charge determines the main charge carrier of the nanopore, while the right 1/3 of the pore is a region where analyte ions (denoted by XzX withzXbeing the valence of the analyte ion; we consider only positively charged X ions) are bound by binding sites modeled with the square-well (SW) potential here. The effect of various charge patterns in these regions was studied in a previous work [31] in which we allowed different charge densities (positive, negative, or zero) in the two regions.
The most efficient nanopore sensor is the one, where the left region is positively charged (so the anions are the charge carriers) and the right region is negatively charged (so that region attracts the positive X ions thus making it more sensitive to the presence of X). Therefore, we studied this case in detail in our subsequent work [32]. The mechanism of sensing is that bound X ions attract more anions (Cl−) into the pore thus increasing the current. Here, we study the effect of pH by establishing a relationship between surface charges carried by protonable/deprotonable functional groups and pH. We show that an optimal solution can be achieved by tuning pH.
This is a modeling study using a simple electrolyte model, where ions are modeled as charged hard spheres and water is modeled implicitly. Because we consider a steady-state non-equilibrium system, we use the Local Equilibrium Monte Carlo (LEMC) method [43] that is an adaptation of the Grand Canonical Monte Carlo (GCMC) technique to a non-equilibrium situation by applying a space-dependent chemical potential profile. We couple this technique to the Nernst-Planck (NP) transport equation resulting in a hybrid method, called NP+LEMC. This method was successfully applied for various problems in the last couple of years such as particle transport through model membranes [43, 44], ion channels [45–47], and nanopore diodes [48–50], transistors [51, 52], and sensors [31, 32, 53].
Because our geometry presented here is asymmetric, rectification appears as an additional device function. Therefore, our model is a pH-sensitive dual-response nanopore sensor.
2. Model and method
2.1. Reduced model of nanosensor
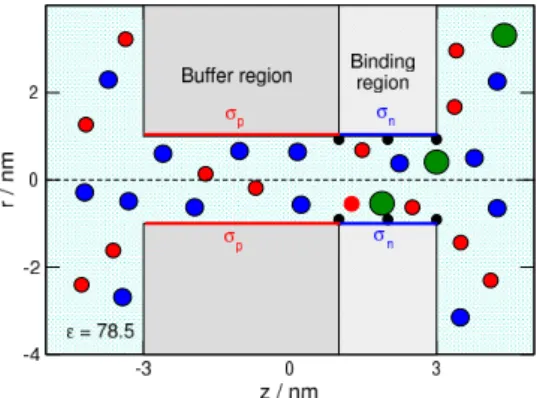
The model of the nanosensor is a cylindrical pore penetrating a membrane of widthH = 6 nm (Fig.
1). The radius of the pore is 1 nm. The walls of the pore and the membrane are hard, so overlap of ions 2
Figure 1: Schematics of the cylindrical nanopore that is divided into a buffer and a binding region. The radius of the pore is 1 nm. The lenght of the left-hand side buffer region is 4 nm The buffer region carries basic functional groups (amino/imino or pyridinium) that, if protonated, can be positively charged,σp, depending on pH. If every such group is protonated, the surface charge isσmaxp = 1e/nm2. This region determines the main charge carrier. The binding sites are located in the right hand side of the pore, indicated by small black half spheres on the wall. The length of this binding region is 2 nm. The binding region carries acidic functional groups (carboxyl or phosphate) that, if deprotonated, can be negatively charged,σn, depending on pH. If every such group is deprotonated, the surface charge isσmaxn =−1e/nm2. The blue spheres indicate the anions (Cl−), while the red spheres the cations (K+). The green spheres indicate the analyte ions (XzX) that are present in the solution in very small concentration,cX.
with these walls is forbidden. The pore is divided into two regions: a buffer- and a binding region.
The length of the buffer region is Hp = 4 nm and it carries σp surface charge. This non-negative surface charge is a result of basic functional groups on the surface that can be protonated depending on pH as described in Subsection 2.2. The binding sites are located on the right hand side of the pore in the binding region. The lenght of this region isHn = 2 nm and it carries σn surface charge. This non-positive surface charge is a result of acidic functional groups that can be deprotonated depending on pH as described in Subsection 2.2.
The surface charge is represented by fractional point charges that are situated on a rectangular grid, where a surface element is approximately a square of size 0.2×0.2 nm2. The magnitude of the point charges is established so that the surface charge density corresponds to the prescribed values,σpandσn. Here we applied the primitive model of electrolytes, where the solvent (water) is treated implicitly.
Water is modeled as a dielectric continuum background that has two kinds of effect on ions: they screen the charges of ions and hinder the diffusion of ions with friction. The screening is an “energetic” effect that is taken into account by a dielectric constant,, in the denominator of the Coulomb-potential acting between the charged hard spheres with which we model the ions:
uij(r) =
∞ for r < Ri+Rj zizje2
4π0r for r≥Ri+Rj, (1)
where Ri and zi is the radius and valance of ionic species i, respectively, e is the unit charge, and r is the distance between the ions. The ionic species are K+, Cl−, and XzX, where K+ and Cl− are the cations and anions of the background electrolyte, respectively, XzX is the analyte ion that is supposed to be detected by the sensor. The valence of the analyte ion (zX) is a variable; it can bezX= 1, 2, and 3 in this study. The ionic radii are the Pauling radii in the case of KCl electrolyte,RK+ = 0.133 nm and RCl− = 0.181 nm. For the radius of the analyte ion we useRX = 0.3 nm. In this study we use a fixed concentration for the background electrolyte atcKCl= 0.01 M. The effects ofRX andcKClwere studied in our previous publication [32].
Friction is a “dynamic” effect that is taken into account by a diffusion coefficient, Di(r), in the
Nernst-Planck (NP) transport equation for the ionic flux:
−kTji(r) =Di(r)ci(r)∇µi(r), (2)
where ji(r) is the particle flux density of ionic species i, ci(r) is the concentration, and µi(r) is the electrochemical potential profile, k is Botzmann’s constant, and T is temperature (298.15 K in this study).
In the bulk phase we used the experimental diffusion coefficient values (DK+ = 1.849×10⁻⁹ m2s−1 and DCl− =DX+ = 2.032×10⁻⁹ m2s−1), but inside the pore the diffusion coefficient, Dporei , is a user specified quantity. We can adjust its value inside the pore to experiments (like in studies of biological ion channels [46, 52]) or to results of higher resolution models, like MD simulations of an explicit-water model of the same system [48, 50]. In this reduced model, Dipore is relatively arbitrary, because it just tunes the current of the ions and do not influence the basic behavior of the device. Following the practice of our previous studies [31, 32, 49, 52, 53], we set the value ofDporei as constant and ten times smaller than in the bulk.
The binding sites are located on the right hand side of the pore wall in 3 rings placed at z = 1, 2, and 3 nm. Each ring contains 4 binding sites [53]. The binding potential acting between a site and an analyte ion is the square-well (SW) potential:
uSW(r) =
( 0 for r−RX> dSW
−SW for r−RX< dSW, (3)
whereris the distance of the site and the ion center. This short-range potential acts only on the X ions and attracts X with −SW = −10kT energy once the closest point of the X ion’s surface is closer to the site than the distance parameter dSW= 0.2 nm. TheSW = 10kT energy of the binding potential (corresponding to 24.77 kJ/mol) is in the ballpark of hydrogen bonds [54]. This simple potential model for binding takes into account that the active site of the analyte can be found on the analyte molecule’s surface while keeping the spherical symmetry of the ion at the price that the orientation dependence of binding is neglected.
The effect of the energy and distance parameters, SW and dSW, has been studied in our previous work [53]. They control the strength and range of the binding potential, respectively. We found that the efficiency of the sensor depends on these parameters monotonically. The same is true for the density of the binding sites [53].
2.2. Relating pH to charge pattern
The pH of the electrolyte is an experimentally controllable parameter through which the charge pattern of the pore can be tuned via protonation and deprotonation of functional groups tethered to the nanopore’s wall. Positive surface charge comes from protonated basic groups (amino/imino or pyridinium groups [36]), while negative charge comes from deprotonated acidic groups (carboxyl or sulphate groups [55]).
In our previous work [52], we chose an indirect way to mimic the effect of pH in order to study the transport properties of a nanotransistor. We modulated the conductance properties by changing the surface charge pattern, achieving a pH-gated behavior. We showed that the surface charge depends on pH and on the degree of dissociation of the functional groups (characterized by the pKa values) in the corresponding regions through equations
σn(pH) = σmaxn
1 + 10−(pH−pKCOOa −)
(4a) 4
Figure 2: Schematics of the pH-related charge patterns (A). pH dependence of the surface charge in the bufferσp and binding regionσn(B). pH dependence of the total pore charge,Q∗(C).
σp(pH) = σmaxp 1 + 10(pH−pKNH
+ a 3)
(4b) using the carboxyl- and amino groups (COO− and NH+3) as examples for the acidic and basic groups, respectively [56]. The pKa values that correspond to these groups are pKCOOa − = 5 [57] and pKNH
+
a 3 = 9 [34]. Equations 4a and 4b contain the parameters σnmax andσpmax, respectively, that are determined by the maximal possible densities of these groups on the nanopore’s surface. The values we used (σmaxn =−1 e/nm2 andσpmax= 1e/nm2) are common in PET nanopore experiments [58].
The pH dependence of the surface charges in the buffer (σp) and binding region (σn) are seen in Fig.
2B. This is a simple way of mimicing the effect of pH found in several modeling studies [59–61], although direct simulation of protonation/deprotonation processes is also possible [62].
Panel A of Fig. 2 shows the specific charge patterns belonging to the specific pH values simulated in this study. Different surface charges are indicated by corresponding color shades (gray is neutral).
pH = 3 and 11 refer to unipolar pores, because only one region is charged, the rest of the pore is neutral.
Intermediate pH values correspond to bipolar nanopores whose charge asymmetries depend on pH. The degree of charge asymmetry can be characterized by a dimensionless quantity, the total pore charge (Q∗) which depends on the relative lengths of the two regions [50] and defined as
Q∗= σp
|σmaxp | Hp
H + σn
|σpmax| Hn
H . (5)
The pH dependence ofQ∗can be seen in Fig. 2C. As pH changes from 3 to 11, the dimensionless charge changes from 2/3 to−1/3. The charge asymmetry can be defined as maximal ifQ∗∼0, but we will talk about bipolar nanopores in a general sense when there are both negative and positive surface charges present.
We have previously shown [50] that a nanopore can be turned from a selective one to a rectifying one and vice versa by changing the total pore charge. We can tune the basic features by manipulating
the surface charge pattern. Uniformly charged pores are selective for the counterions, but they do not rectify. Increasing charge and/or geometrical asymmetry induces rectification phenomena. Bipolar pores rectify well, but they are not selective. Unipolar pores (charged on one side and neutral on the other side) are in between. They are selective with a rectification smaller than that of the bipolar pores.
Charge pattern, consequently, is a powerful feature determining nanopore behavior, and pH is an experimentally easily controllable parameter that can tune the charge pattern.
2.3. Local Equilibrium Monte Carlo simulation coupled to the Nernst-Planck equation
The ionic flux is computed from the NP euation (Eq. 2). To solve that equation, we need a relation between the chemical potential profile, µi(r), and the concentration profile, ci(r). That relation is provided by a statistical mechanical method. When this method is the Poisson-Boltzmann (PB) theory, we talk about the Poisson-Nernst-Planck (PNP) theory (a name coined by Eisenberg [63] in 1993). In that case, we couple the PB theory to the NP equation.
Instead of using the mean-field PB theory, we use the LEMC method that is an adaptation of the GCMC technique to a non–equilibrium situation [43, 45, 46]. In this technique, the independent state function is µi(r), while the output is ci(r). Out of (global) equilibrium, the chemical potential profile is not constant, but a space-dependent quantity. Using the idea of local equilibrium, we divide the solution domain into small volume elements and assume that the chemical potential is constant in each subvolume. Then we perform the usual ion insertion/deletion steps applying the GCMC acceptance criterion, but using the local chemical potential in a subvolume instead of a global one. Theµi(r) profile is iterated in the coupled technique (coined as NP+LEMC) until conservation of mass (∇ ·j(r) = 0) is satisfied. The self-consistent solution describes a steady-state transport system.
The LEMC method correctly computes volume exclusion and electrostatic correlations between ions and, as opposed to the PNP theory, it is not subject of mean-field approximations. Also, it enables us to create a three-dimensional model for the pore, to define short-range potentials, interactions with walls, etc. The length and radius of the cylindrical simulation cell were 300 nm and 90 nm, respectively.
Typically, 80 iterations were performed sampling 50 million configurations in each iteration. Half of the LEMC steps were ion insertions and deletions (50−50 %), while the other half were ion displacements.
This sampling produced current data with error bars within the size of the symbols in the figures.
3. Results
3.1. Current-voltage relations
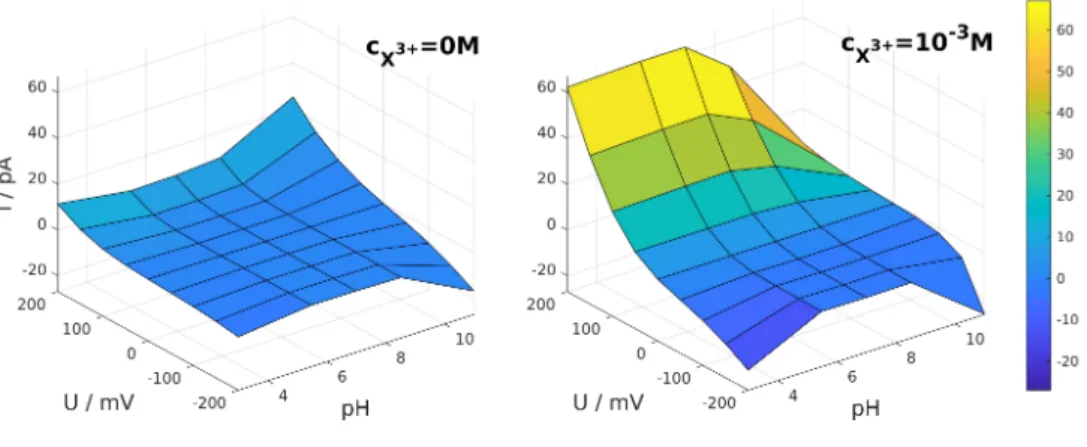
Voltage is easy to control, so measuring the current for a range of voltage values (producing I− U curves) is a common protocol in experiments. This is especially important if the device exhibits rectification properties, namely, the I−U curves are asymmetric. Therefore, first, we present I−U curves for two values of the analyte concentration in Fig. 3: panel A shows the results for the absence of analyte as a reference, while panel B shows the results forcX3+= 10−3 M concentration of the trivalent analyte ion. Here, and also in later figures, the concentration of the background electrolyte (KCl) is fixed atcKCl= 0.01 M.
The purpose of the figure is to show that the shape of theI−U curves is strongly influenced by both the presence of the analyte ions and pH. Therefore, we plot the current as a surface over the U −pH plane (Fig. 3). Looking at the figure from the direction of theU-axis, an asymmetry in theI−U curves can be observed. This asymmetry is due to asymmetries in the pore geometry (the X ions are bound only to the rigth region) and in the charge pattern on the pore wall along thez-axis. This charge pattern is determined by pH as described in subsebtion 2.2.
6
Figure 3: pH-dependent current-voltage curves in the absence (left panel) and in the presence (right panel) of the trivalent analyte ions of concentrationcX3+= 10−3M. The background electrolyte concentration iscKCl= 0.01 M.
Although the whole I(U) function can practically be considered a device function (as in numerous experimental studies [16, 28, 37, 39, 64, 65]), we prefer numbers as device functions, because it is easier to plot and discuss them. Therefore, we chose two characteristic values of voltage,±200 mV, fixed them, and used the currents as device functions at these voltages. This can be safely done, because the behavior of theI(U) curves at a given pH is smooth and monotonic as a function ofU.
In most cases (they are the interesting cases for us), the U = 200 mV case corresponds to the open (forward biased) state of the nanopore, while theU =−200 mV case corresponds to the closed (reverse biased) state. We will refer to these voltages as ON and OFF states, respectively, while the currents are referred to asION=I(200 mV) and IOFF=I(−200 mV).
Although we could use these current values as device functions, we prefer relative, normalized values, because they can be more general and independent of units. Therefore, we use the relative current ION(cX)/ION(cX= 0) (we will refer to it briefly asI/I0) that is the ON-state current relative to that in the absence of the analyte ions.
The other device function is rectification defined as the absolute value of theION/IOFFratio. Recti- fication is an advantageous device function, because it characterizes the asymmetry of the nanopore. It is a technologically important property due to its relevance in the diode function [10, 17, 18, 28]. Note that IOFF is negative, but we will drop the absolute value signs and show the IOFF values as positive ones and refer to rectification asION/IOFF without the absolute value signs.
In the following subsections, we discuss these device functions.
3.2. Relative current as the device function
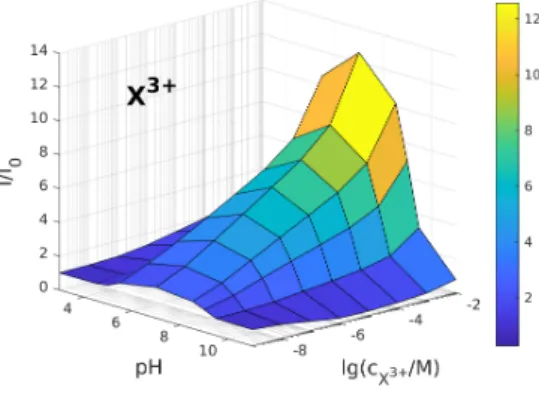
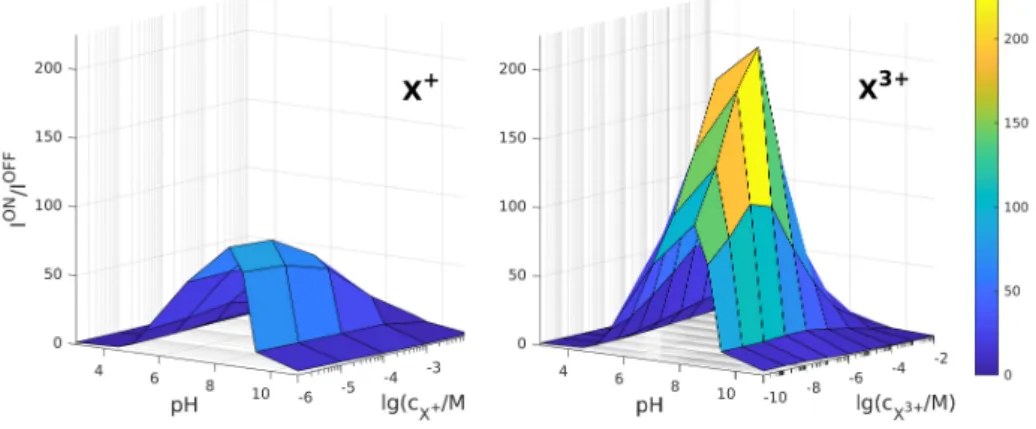
In Fig. 4, we show the relative current as a surface over the pH−cXplane for trivalent analyte ions in the ON state. While we can observe a mostly monotonic behavior as a function ofcX (when we use just X without a superscipt, we refer to an analyte ion in a general manner, when valence is not important), we always find a nonmonotonic behavior as a function of pH with a maximum at intermediate pH values.
This clearly demonstrates that the I/I0 quantity can be used to create calibration curves that, in turn, can be tuned and optimized by the value of pH. By calibration curve we simply mean the device function as a function of the concentration of the analyte ion: f(cX), wheref is a general device function defined by the user (I/I0, in this case). If we have a calibration curve, we can determine the analyte concentration once we measure the device function itself.
Figure 4: Relative current as a function of pH andcX3+for trivalent ions in the ON state (U= 200 mV).
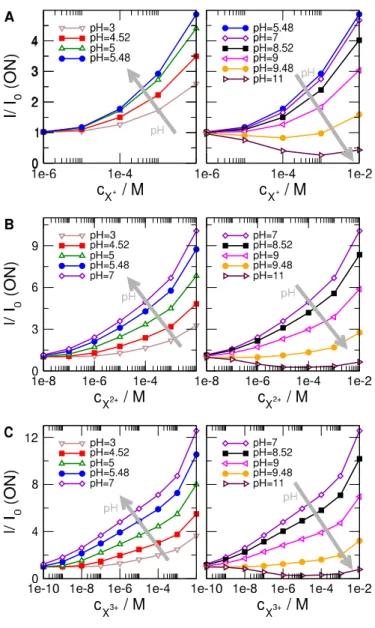
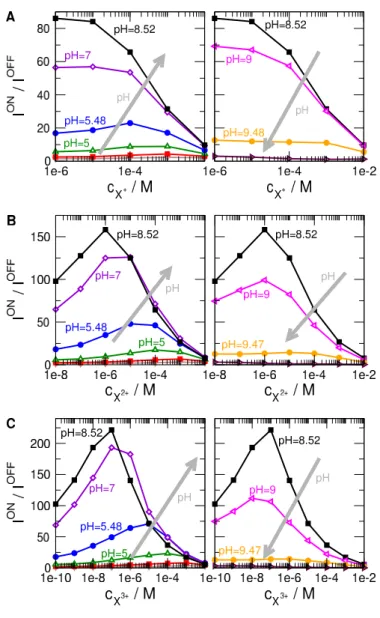
When we say that these calibration curves can be optimized, we mean that the sensitivity of the sensor can be made higher by properly choosing the pH. By sensitivity we mean the slope of thef(cX) function. It characterizes the degree to which f changes as a result of a change in cX. Because our calibration curves (plotted in Fig. 5 for various values of pH) are usually smooth and monotonic, we can characterize sensitivity (the slope) with just the value of the signal: the largerf at a givencX, the more sensitive the sensor is.
Figure 5 shows these calibration curves in two columns for clarity. The left column shows those curves whose magnitude (sensitivity) increases with increasing pH. The direction of increasing pH is shown by gray arrows. The right column, on the other hand, shows those calibration curves whose magnitude decreases with increasing pH. The interesting regime, obviously, is the one with maximal sensitivity as a function of pH. This is the basis of pH-optimization of our sensor model. This value of pH, where optimized sensor behavior is observed (usingI/I0as device function) is pH = 5.48 for X+, while pH = 7 for X2+ and X3+.
These optimal pH values correspond to bipolar nanopores. This is not a surprise, because in our previous work, where various charge patterns have been analyzed [31], the bipolar charge pattern proved to be the most appropriate as the background charge pattern of the sensor. In the following publication [32], we analyzed this charge pattern using various background electrolyte concentrations (cKCl) and pore shape (cylindrical vs. conical). Here, we fixcKCland pore shape, and focus on the effect of pH.
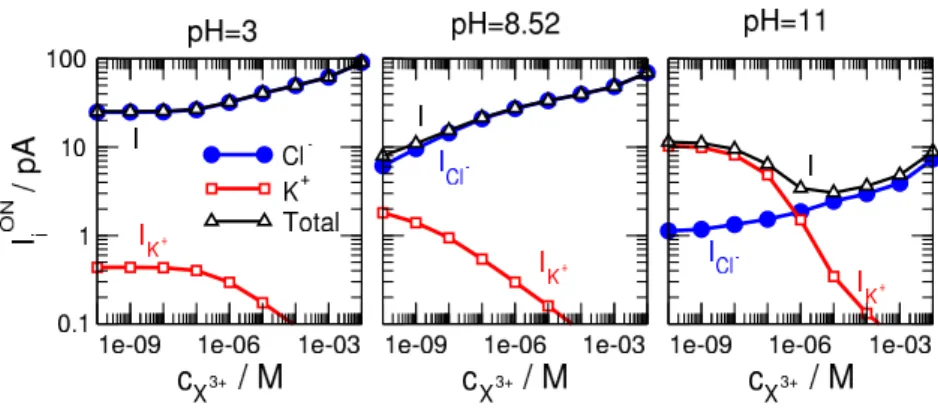
A disadvantage of using the relative current as a device function is that it hides the absolute value of the current. The ON-state currents (both total and carried by individual ionic species) are shown in Fig. 6 for three characteristic pH values.
• At pH = 8.52 (middle panel) the pore is bipolar with the buffer region being negative (the main charge carriers are the anions), and the binding region being positive. Anion, and, thus total, current increases with increasing cX but more steeply than in the case of pH = 3 providing better sensitivity. The anion current responds to changes incX even at very smallcX values.
• At pH = 3 (left panel) the pore is unipolar with the binding region being neutral. Anion, and, thus total, current increases with increasingcX, but the slope of the curve is zero at low concentrations (below 10−7 M). The device does not responde to the presence of X3+ ions in this concentration range.
• At pH = 11 (right panel) the pore is unipolar with the buffer region being neutral, and the binding region being positive. The main charge carriers are the cations in the absence of X3+ ions. When cX3+ is increased, the positive X3+ions attract anions into the pore and the device becomes anion
8
Figure 5: Relative currents as functions ofcX where X is monovalent (A), divalent (B), and trivalent (C) from top to bottom for varying pH values. Left and right columns show curves where the relative current increases and decreases with increasing pH, respectively. The direction of increasing pH is shown by gray arrows.
selective. Cation and anion currents exhibit oppositecX-dependence, so the total current does not show a monotonic behavior that would be necessary for a decent calibration curve.
The mechanism of sensing at low to moderate pH (3 and 8.52) is that the increasing concentration of the X ions in the bath drives more X ions into the pore. The increasing number of positive X ions at the binding sites attracts more Cl− ions into the pore thus increasing theICl− current.
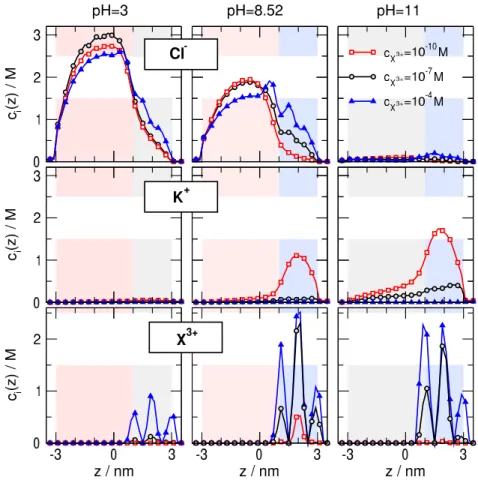
This process is illustrated in Fig. 7 by showing axial concentration profiles for different concentrations of X3+ for three representative pH values.
• In the case of pH = 8.52 (middle column), the negative surface charge of the binding region attracts the X3+ ions into the pore (bottom row). More X3+ ions attract more Cl− ions (top row) thus increasing the Cl− current ascX3+ increases. The buffer region has a positive surface charge that excludes the K+ ions (middle row) and makes the pore anion selective. Althoght there is a considerable K+ accumulation in the binding region atcX3+ = 10−10 M, the K+ current is small (see middle panel of Fig. 6, beware the logarithmic scale) due to K+depletion in the buffer region.
Figure 6: Individual and total currents as functions ofcXfor three selected pH values (pH = 3, 8.52, and 11 from left to right) for the ON state. The analyte ions are trivalent.
This K+ leakage can be made even smaller by making the buffer region larger.
This sensor responds to the presence of the X3+ ions sensitively: the I vs. cX3+ curve has a considerable slope in the whole concentration range. Both the positive surface charge of the buffer region and the negative surface charge of the binding region play their own crucial roles in this good efficiency.
• In the case of pH = 3 (left column), the negative surface charge in the binding region is absent, so it does not help the SW binding potential in attracting the X3+ ions into the pore. The X3+
concentrations in the binding region are smaller (bottom row) than in the pH = 8.52 case, and, consequently, their effect on the Cl− ions is also smaller (top row). The quantity of bound X3+
ions in the cX3+ = 10−10−10−7 M range is negligible (red and black curves in the bottom–left panel of Fig. 7), so the change in the Cl− concentration is also negligible (red and black curves in the top–left panel of Fig. 7) in the binding region.
The binding region is the high–resistance element of the pore, so we must listen to that region, when we judge the effect of concentration on the current. As an effect, the Cl− current (that is practically the total current) does not change in the cX3+ = 10−10−10−7 M concentration range (blue curve in the left panel of Fig. 6); the slope of theI vs.cX3+ curve is practically zero below 10−7M. This geometry, therefore, cannot be used as a sensor in that concentration range, at least, at the studied conditions.
• In the case of pH = 11 (right column), the X3+ concentration is also large (due to the positive surface charge in the binding region), but the buffer region is uncharged, so the main charge carrier is not determined by this buffer region. As the concentration of the X3+ increases in the binding region, they attract more Cl− ions in, while repulse more K+ ions out. As a consequence, the Cl− and K+ currents behave the opposite way (right panel of Fig. 6) and the total current is not monotonic. This geometry is not suitable for using as a sensor.
Although the pH dependence can also be depicted from Figs. 5–7, we analyze analyze the pH de- pendence explicitly by plotting the currents (individual and total) as functions of pH in Fig. 8. The decrease of Cl− current and the increase of K+ current as a function of pH reflects the behavior of the total charge of the pore, see panel C of Fig. 2. The total current is determined by the Cl− current in most cases except for large pH values, where K+ current is considerable and can even be larger than Cl− current at smallcXconcentrations.
When analyte ions are added to the system (increasing cX along the gray arrows), Cl− currents 10
Figure 7: Concentration profiles for the trivalent case for selectedcX3+and pH values. Various rows refer to various ionic species: Cl−, K+, and X3+from top to bottom. Various columns refer to various pH values: pH = 3, 8.52, and 11 from left to right. Various curves refer to various X3+concentrations:cX3+= 10−7 M, 10−5M, and 10−3 M.
increase and K+ currents decrease due to electrostatic attraction/repulsion exerted by the positive X3+
ions. The behavior of the total current (shown in the third panel) is the basis of theI/I0device function (shown in the fourth panel). TheI/I0 ratio was practically obtained by dividing the currents with the cX3+ = 0 values that are pretty close to thecX3+= 10−10 M values (black curves with filled circles).
The maximum in the I/I0 curve as a function of pH can be explained by the increased sensitivity of the device at intermediate pH values when the surface charges of the respective regions take their maximal values, e.g.σp=σpmaxandσn=σnmax. Increased sensitivity, as it was already discussed above,
Figure 8: Individual and total currents in the ON state as functions of pH for the trivalent case. Various curves refer to different X-concentrations (cX3+= 10−10, 10−8, 10−6, and 10−4M). The direction of increasingcX3+is indicated by gray arrows. The rightmost panel shows the relative currents as functions of pH.
Figure 9: K+ and Cl−selectivities in the ON state as functions of pH for the trivalent case. Analyte concentration increase from left to right. Selectivity for X3+is shown with black, but is relevant only forcX3+= 10−4M and large pH.
is due to the facts that (a) the positive charge of the buffer region makes the anions the main charge carrier and (b) the negative charge of the binding region helps the binding SW potential in attracting the X3+ ions into the pore. This way, the enhanced accumulation of the X ions can exert a stronger effect on the charge-carrier anions.
At small pH, the X3+ ions are not attracted so strongly into the pore, so the pore is less sensitive to their presence. At large pH, there is a considerable K+ leakage that disturbs the behavior of Cl− current. Even if Cl− and K+ currents are sensitive to cX separately, their sum is not, because these currents behave the opposite way as a function ofcX (see right panel of Fig. 6).
The effect of pH can also be expressed in terms of selectivity that is defined as the share that a given ionic species takes from the total current,Si =Ii/I. When it is close to 1 for a given species, the pore is selective for that species.
Figure 9 shows Cl− and K+ selectivities as functions of pH for four differentcX3+ values from left to right. Selectivity follows the behavior of the total charge (seeQ∗vs. pH in Fig. 2C) in the case of a small amount of X3+ ions (leftmost panel). The mechanism of sensing can also be viewed as the effect of the X3+ ions on this selectivity behavior. Following the increase ofcXfrom left to right in Fig. 9, it is seen that selectivity is shifted in the direction of better Cl− selectivity with increasedcX3+ concentrations.
Sensing from the point of view of the relative current has an optimal behavior at intermediate pH that corresponds to the bipolar charge pattern. The bipolar case, as we will see in the next subsection, has the additional advantage that the pore rectifies, so we gain an additional device function.
Figure 10: Rectification as a function ofcXand pH for monovalent (left) and trivalent (right) analyte ions.
12
Figure 11: Rectifications as functions of cX where X is monovalent (A), divalent (B), and trivalent (C) from top to bottom for varying pH values. Left and right columns show curves where the relative current increases and decreases with increasing pH, respectively. The direction of increasing pH is shown by gray arrows.
3.3. Recification as the device function
Because the charge pattern on the nanopore’s surface is asymmetric along thez-axis, the pore exhibits rectification behavior. Rectification, therefore, can be another device function in addition to the relative ON-current.
As in Fig. 4 for the relative current, here plot the rectification as a functqion of both pH and cXin Fig. 10. We show these surfaces for monovalent and trivalent analyte valences as characteristic cases (the behavior of the divalent analyte is in between). Again, we observe the maximum as a function of pH that makes optimization by pH possible. In this case, however, we also observe maxima as a function ofcX for the divalent and trivalent cases as seen before by M´adai et al. [32].
The maximum as a function of cX can be better visualized by plotting rectification as a function of cX in Fig. 11. The logic of this figure is the same as that of Fig. 5 where we plotted the relative current in the same manner. Figure 11 shows that the largest rectification values (and, thus, largest sensitivities) are obtained for pH = 8.52.
For monovalent analyte ions, we observe a monotonic behavior that makes the rectification vs.cX+
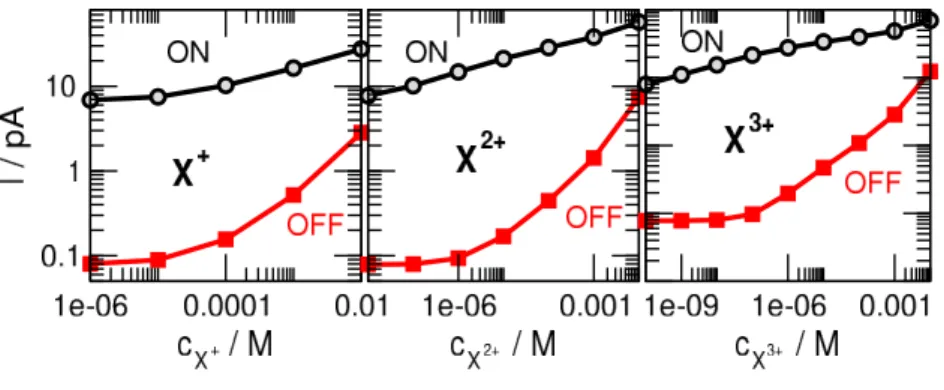
Figure 12: Total currents in the ON and OFF states as functions ofcXfor the bipolar nanopore (pH = 8.52). The valence of the analyte ion increases from left to right.
curves proper calibration curves. The rectification approaches the value obtained in the absence of X+ below cX+ = 10−6 M. In the case of divalent and trivalent ions, rectification also approaches the limiting values as cX → 0, but at much lower concentrations, and, additionally, we observe maxima at certain threshold concentrations. These threshold concentrations are cmaxX2+ = 10−6 M for divalents and cmaxX3+ = 10−7 M for trivalents. These threshold concentrations are pretty small, so we can use the decreasing branch as the calibration curve if we want to detect X-concentrations larger than these. Also, these maxima can be used to predict the valence of the analyte ions if we can produce experiments for a series of X-concentrations.
Although this maximum has already been analyzed in Ref. [32], here we extend the analysis for all the three analyte ions to discuss why the maximum is shifted aszXis changed. Figure 12 shows the ON- and OFF-state currents for mono-, di-, and trivalent ions (from left to right) for the bipolar nanopore (pH = 8.52). In the cases of divalent and trivalent analyte ions, the OFF current remains small at small cX concentrations up to thecmaxX threshold values. The ON current, on the other hand, increases in this regime, so rectification also increases. Above the cmaxX threshold concentration, enough X ions start to accumulate in the pore (see the profiles of Fig. 10 of M´adai et al. [32]) to draw more Cl− ions into the pore thus steeply increasing the OFF current. Because the OFF current increases more steeply than the ON current, theION/IOFF ratio decreases abovecmaxX .
The explanation of the fact that the threshold cmaxX concentration, where the OFF current starts to catch up is different for different analyte ions is that X ions with larger valences are attracted more strongly by the negative surface charge of the binding region. As a consequence, cmaxX decreases aszX increases.
The maximum as a function of pH can be attributed to the change in pore asymmetry characterized by the total charge,Q∗(Fig. 2C). The pores at small and large pH values are unipolar, whose selectivity is larger than that of the bipolar pore present at intermediate pH. This behavior has already been discussed in our previous work [50] in which we systematically changed the charge pattern from being negative to positive going through a bipolar pattern. The total pore charge changed monotonically from negative to positive during this transition. Rectification exhibited the behavior with the maximum the same way observed here. In that study, we analyzed the mechanisms not only for the implicit-water model used here, but also for explicit water studied with MD simulations. We showed that the reduced model using implicit water can reproduce the device behavior obtained from all-atom MD, because it reproduces the voltage- and charge-pattern-sensitive behavior of the axial concentration profiles properly.
Here, we conclude our discussion by showing current values as functions of pH for the OFF state in Fig. 13 (the ON-state currents are shown in Fig. 8). The nature of the Cl−and K+currents is similar to the ON state in the sense that they decrease and increase, respectively, as a function of pH in accordance
14
Figure 13: Individual and total currents in the OFF state as functions of pH for the trivalent case. Various curves refer to different X-concentrations (cX3+= 10−10, 10−8, 10−6, and 10−4M). The direction of increasingcX3+ is indicated by gray arrows.
with the change of Q∗. The OFF-currents, however, are much smaller and behave differently with pH than ON-currents.
This can be followed by comparing Fig. 13 to Fig. 8. Rectification is obtained by dividing the curves of the third panel of Fig. 8 with the curves of the third panel of Fig. 13 (the ON-state total current with the OFF-state total current). At larger X3+ concentrations, we divide a concave curve with a convex curve. The result is the rectification curves with the maxima as seen in Fig. 10.
4. Summary
This work showed that the nanopore geometry proposed in earlier works [31, 32] is appropriate to create a sensor whose behavior can be optimized by tuning pH. The essence of the geometry is that we have a larger buffer region of the pore whose charge determines the main charge carrier (in this study, it is a positive region making anions the main charge carrier) and a smaller binding region that attracts and binds positive analyte molecules that, in turn, modify the transport of the main charge carrier.
For the example discussed in this work, the protonation/deprotonation of the functional groups can be tuned by pH in a way that we have a bipolar pore at intermediate pH that proved to be the most efficient sensor. In the bipolar case every feature of the nanopore works in favor of sensitive sensor behavior. Both the positive buffer region and the negative binding region play their role in producing an efficient sensor.
The fact that the optimized sensor behavior appears at pH = 5.48−9 might seem obvious, but the exact position of the maximum depends on pore structure: the shape of the pore, the relative lengths of the buffer and binding regions, the densities of functional groups producing the surface charges, the pKavalues of these functional groups, and the nature, strength, and specificity of the interactions acting between the binding sites and the analyte molecules.
This and previous works [31, 32] analyzed the effect of parameters for which the implicit water model is an especially useful model. Modeling concentrations as low as 10−10 M, for example, would be impossible with explicit water. Our works proved the efficiency of the basic geometry. This work, in particular, proved that sensor behavior can efficiently be optimized by tuning pH.
Acknowledgements
We gratefully acknowledge the financial support of the National Research, Development and Innova- tion Office – NKFIH K124353. Present article was published in the frame of the project GINOP-2.3.2- 15-2016-00053.
[1] L. T. Sexton, L. P. Horne, C. R. Martin, Developing synthetic conical nanopores for biosensing applications, Mol.
BioSyst. 3 (2007) 667–685.
[2] S. Howorka, Z. Siwy, Nanopore analytics: sensing of single molecules, Chem. Soc. Rev. 38 (2009) 2360–2384.
[3] S. Howorka, Z. Siwy, Nanopores: Generation, engineering, and singly-molecule applications, in: P. Hinterdorfer, A. van Oijen (Eds.), Handbook of Single-Molecule Biophysics, Advances in Chemical Physics, Springer, 2009, pp.
293–339.
[4] A. Piruska, M. Gong, J. V. Sweedler, Nanofluidics in chemical analysis, Chem. Soc. Rev. 39 (2010) 1060–1072.
[5] X. Hou, W. Guo, L. Jiang, Biomimetic smart nanopores and nanochannels, Chemical Society Reviews 40 (2011) 2385.
[6] W. Guo, Y. Tian, L. Jiang, Asymmetric ion transport through ion-channel-mimetic solid-state nanopores, Acc. Chem.
Res. (2013).
[7] G. Xie, W. Tian, L. Wen, K. Xiao, Z. Zhang, Q. Liu, G. Hou, P. Li, Y. Tian, L. Jiang, Chiral recognition of l-tryptophan with beta-cyclodextrin-modified biomimetic single nanochannel, Chem. Commun. 51 (2015) 3135–3138.
[8] H. Zhang, Y. Tian, L. Jiang, Fundamental studies and practical applications of bio-inspired smart solid-state nanopores and nanochannels, Nano Today 11 (2016) 61–81.
[9] M. Lepoitevin, T. Ma, M. Bechelany, J.-M. Janot, S. Balme, Functionalization of single solid state nanopores to mimic biological ion channels: A review, Adv. Coll. Interf. 250 (2017) 195–213.
[10] W. Ensinger, M. Ali, S. Nasir, I. Duznovic, C. Trautmann, M. E. Toimil-Molares, G. R. Distefano, B. Laube, M. Bern- hard, M. Mikosch-Wersching, H. F. Schlaak, M. E. Khoury, The iNAPO project: Biomimetic nanopores for a new generation of lab-on-chip micro sensors, Int. J. Theor. Appl. Nanotech. 6 (2018) 21–28.
[11] S. Zhang, H. Li, Host-guest sensing by nanopores and nanochannels, in: Handbook of Macrocyclic Supramolecular Assembly, Springer Singapore, 2019, pp. 1–27.
[12] G. P´erez-Mitta, M. E. Toimil-Molares, C. Trautmann, W. A. Marmisoll´e, O. Azzaroni, Molecular design of solid-state nanopores: Fundamental concepts and applications, Adv. Mater. 31 (2019) 1901483.
[13] H. Bayley, C. R. Martin, Resistive-pulse sensing from microbes to molecules, Chem. Rev. 100 (2000) 2575–2594.
[14] R. E. Gyurcs´anyi, Chemically-modified nanopores for sensing, Trends Anal. Chem. 27 (2008) 627–639.
[15] I. Makra, R. E. Gyurcs´anyi, Electrochemical sensing with nanopores: A mini review, Electrochem. Commun. 43 (2014) 55–59.
[16] M. Ali, I. Ahmed, P. Ramirez, S. Nasir, S. Mafe, C. M. Niemeyer, W. Ensinger, Lithium ion recognition with nanofluidic diodes through host–guest complexation in confined geometries, Anal. Chem. 90 (2018) 6820–6826.
[17] M. Ali, I. Ahmed, P. Ramirez, S. Nasir, J. Cervera, S. Mafe, C. M. Niemeyer, W. Ensinger, Cesium-induced ionic conduction through a single nanofluidic pore modified with calixcrown moieties, Langmuir 33 (2017) 9170–9177.
[18] M. Ali, S. Nasir, P. Ramirez, J. Cervera, S. Mafe, W. Ensinger, Calcium binding and ionic conduction in single conical nanopores with polyacid chains: Model and experiments, ACS Nano 6 (2012) 9247–9257.
[19] Q. Liu, K. Xiao, L. Wen, H. Lu, Y. Liu, X.-Y. Kong, G. Xie, Z. Zhang, Z. Bo, L. Jiang, Engineered ionic gates for ion conduction based on sodium and potassium activated nanochannels, J. Am.Chem. Soc. 137 (2015) 11976–11983.
[20] K. Wu, K. Xiao, L. Chen, R. Zhou, B. Niu, Y. Zhang, L. Wen, Biomimetic voltage-gated ultrasensitive potassium- activated nanofluidic based on a solid-state nanochannel, Langmuir 33 (2017) 8463–8467.
[21] E. T. Acar, S. F. Buchsbaum, C. Combs, F. Fornasiero, Z. S. Siwy, Biomimetic potassium-selective nanopores, Sci.
Adv. 5 (2019) eaav2568.
[22] G. Nie, Y. Sun, F. Zhang, M. Song, D. Tian, L. Jiang, H. Li, Fluoride responsive single nanochannel: click fabrication and highly selective sensing in aqueous solution, Chem. Sci. 6 (2015) 5859–5865.
[23] Y. Tian, X. Hou, L. Wen, W. Guo, Y. Song, H. Sun, Y. Wang, L. Jiang, D. Zhu, A biomimetic zinc activated ion channel, Chem. Comm. 46 (2010) 1682–1684.
[24] X.-P. Zhao, S.-S. Wang, M. R. Younis, X.-H. Xia, C. Wang, Asymmetric nanochannel–ionchannel hybrid for ultra- sensitive and label-free detection of copper ions in blood, Anal. Chem. 90 (2017) 896–902.
[25] H.-H. Deng, L.-N. Zhang, S.-B. He, A.-L. Liu, G.-W. Li, X.-H. Lin, X.-H. Xia, W. Chen, Methionine-directed fabrication of gold nanoclusters with yellow fluorescent emission for cu2+sensing, Biosensors and Bioelectronics 65 (2015) 397–403.
[26] S. A. El-Safty, D. Prabhakaran, A. A. Ismail, H. Matsunaga, F. Mizukami, Nanosensor design packages: A smart and compact development for metal ions sensing responses, Adv. Func. Mat. 17 (2007) 3731–3745.
[27] L. Mayne, C.-Y. Lin, S. D. R. Christie, Z. S. Siwy, M. Platt, The design and characterization of multifunctional aptamer nanopore sensors, ACS Nano 12 (2018) 4844–4852.
[28] M. Ali, S. Nasir, W. Ensinger, Bioconjugation-induced ionic current rectification in aptamer-modified single cylindrical nanopores, Chem. Comm. 51 (2015) 3454–3457.
[29] I. Vlassiouk, T. R. Kozel, Z. S. Siwy, Biosensing with Nanofluidic diodes, J. Am. Chem. Soc. 131 (2009) 8211–8220.
[30] Z. Sun, C. Han, L. Wen, D. Tian, H. Li, L. Jiang, pH gated glucose responsive biomimetic single nanochannels, Chem.
Comm. 48 (2012) 3282.
[31] E. M´adai, M. Valisk´o, D. Boda, The effect of the charge pattern on the applicability of a nanopore as a sensor, J.
16
Mol. Liq. 283 (2019) 391–398.
[32] E. M´adai, M. Valisk´o, D. Boda, Applicationof a bipolar nanopore as a sensor: rectification as an additional device function, Phys. Chem. Chem. Phys. 21 (2019) 19772–19784.
[33] M. Ali, S. Mafe, P. Ramirez, R. Neumann, W. Ensinger, Logic gates using nanofluidic diodes based on conical nanopores functionalized with polyprotic acid chains, Langmuir Lett. 25 (2009) 11993–11997.
[34] M. Ali, P. Ramirez, S. Maf, R. Neumann, W. Ensinger, A pH-tunable nanofluidic diode with a broad range of rectifying properties, ACS Nano 3 (2009) 603–608.
[35] B. Yameen, M. Ali, R. Neumann, W. Ensinger, W. Knoll, O. Azzaroni, Single conical nanopores displaying pH-tunable rectifying characteristics. manipulating ionic transport with zwitterionic polymer brushes, J. Am. Chem. Soc. 131 (2009) 2070–2071.
[36] B. Yameen, M. Ali, R. Neumann, W. Ensinger, W. Knoll, O. Azzaroni, Proton-regulated rectified ionic transport through solid-state conical nanopores modified with phosphate-bearing polymer brushes, Chem. Commun. 46 (2010) 1908–1910.
[37] M. Ali, M. N. Tahir, Z. Siwy, R. Neumann, W. Tremel, W. Ensinger, Hydrogen peroxide sensing with horseradish peroxidase-modified polymer single conical nanochannels, Anal. Chem. 83 (2011) 1673–1680.
[38] M. Ali, P. Ramirez, H. Q. Nguyen, S. Nasir, J. Cervera, S. Mafe, W. Ensinger, Single cigar-shaped nanopores functionalized with amphoteric amino acid chains: Experimental and theoretical characterization, ACS Nano 6 (2012) 3631–3640.
[39] S. Nasir, M. Ali, P. Ramirez, V. G´omez, B. Oschmann, F. Muench, M. N. Tahir, R. Zentel, S. Mafe, W. Ensinger, Fabrication of single cylindrical Au-coated nanopores with non-homogeneous fixed charge distribution exhibiting high current rectifications, ACS Appl. Mater. Inter. 6 (2014) 12486–12494.
[40] G. Wang, L. Wang, Y. Han, S. Zhou, X. Guan, Nanopore detection of copper ions using a polyhistidine probe, Biosens.
Bioelectron. 53 (2014) 453–458.
[41] M. Ali, I. Ahmed, P. Ramirez, S. Nasir, J. Cervera, C. M. Niemeyer, W. Ensinger, Fluoride-induced modulation of ionic transport in asymmetric nanopores functionalized with “caged” fluorescein moieties, Nanoscale 8 (2016) 8583–8590.
[42] G. Laucirica, G. Perez-Mitta, M. E. Toimil-Molares, C. Trautmann, W. A. Marmisoll´e, O. Azzaroni, Amine-phosphate specific interactions within nanochannels: Binding behavior and nanoconfinement effects, J. Phys. Chem. C in press (2019).
[43] D. Boda, D. Gillespie, Steady state electrodiffusion from the Nernst-Planck equation coupled to Local Equilibrium Monte Carlo simulations, J. Chem. Theor. Comput. 8 (2012) 824–829.
[44] Z. Hat´o, D. Boda, T. Krist´of, Simulation of steady-state diffusion: Driving force ensured by Dual Control Volumes or Local Equilibrium Monte Carlo, J. Chem. Phys. 137 (2012) 054109.
[45] D. Boda, R. Kov´acs, D. Gillespie, T. Krist´of, Selective transport through a model calcium channel studied by Local Equilibrium Monte Carlo simulations coupled to the Nernst-Planck equation, J. Mol. Liq. 189 (2014) 100–112.
[46] D. Boda, in: R. A. Wheeler (Ed.), Ann. Rep. Comp. Chem., volume 10, Elsevier, 2014, pp. 127–163.
[47] Z. Hat´o, D. Boda, D. Gillepie, J. Vrabec, G. Rutkai, T. Krist´of, Simulation study of a rectifying bipolar ion channel:
detailed model versus reduced model, Cond. Matt. Phys. 19 (2016) 13802.
[48] Z. Hat´o, M. Valisk´o, T. Krist´of, D. Gillespie, D. Boda, Multiscale modeling of a rectifying bipolar nanopore: explicit- water versus implicit-water simulations, Phys. Chem. Chem. Phys. 19 (2017) 17816–17826.
[49] B. Matejczyk, M. Valisk´o, M.-T. Wolfram, J.-F. Pietschmann, D. Boda, Multiscale modeling of a rectifying bipolar nanopore: Comparing Poisson-Nernst-Planck to Monte Carlo, J. Chem. Phys. 146 (2017) 124125.
[50] M. Valisk´o, B. Matejczyk, Z. Hat´o, T. Krist´of, E. M´adai, D. Fertig, D. Gillespie, D. Boda, Multiscale analysis of the effect of surface charge pattern on a nanopore’s rectification and selectivity properties: from all-atom model to poisson-nernst-planck, J. Chem. Phys. 150 (2019) 144703.
[51] E. M´adai, B. Matejczyk, A. Dallos, M. Valisk´o, , D. Boda, Controlling ion transport through nanopores: modeling transistor behavior, Phys. Chem. Chem. Phys. 20 (2018) 24156–24167.
[52] D. Fertig, M. Valisk´o, D. Boda, Controlling ionic current through a nanopore by tuning pH: a Local Equilibrium Monte Carlo study., Mol. Phys. 117 (2019) 2793–2801.
[53] E. M´adai, M. Valisk´o, A. Dallos, D. Boda, Simulation of a model nanopore sensor: Ion competition underlines device behavior, J. Chem. Phys. 147 (2017) 244702.
[54] S. Scheiner, T. Kar, Y. Gu, Strength of the cho hydrogen bond of amino acid residues, J. Biol. Chem. 276 (2001) 9832–9837.
[55] M. Lepoitevin, B. Jamilloux, M. Bechelany, E. Balanzat, J.-M. Janot, S. Balme, Fast and reversible functionalization of a single nanopore based on layer-by-layer polyelectrolyte self-assembly for tuning current rectification and designing sensors, RSC Adv. 6 (2016) 32228–32233.
[56] M. Tagliazucchi, I. Szleifer (Eds.), Chemically Modified Nanopores and Nanochannels, Elsevier, 2017.
[57] X. Hou, Y. Liu, H. Dong, F. Yang, L. Li, L. Jiang, A pH-gating ionic transport nanodevice: Asymmetric chemical
modification of single nanochannels, Adv. Mater. 22 (2010) 2440–2443.
[58] E. B. Kalman, I. Vlassiouk, Z. S. Siwy, Nanofluidic bipolar transistors, Adv. Mater. 20 (2008) 293–297.
[59] L.-H. Yeh, M. Zhang, S. Qian, Ion transport in a pH-regulated nanopore, Anal. Chem. 85 (2013) 7527–7534.
[60] S. Xue, L.-H. Yeh, Y. Ma, S. Qian, Tunable streaming current in a pH-regulated nanochannel by a field effect transistor, J. Phys. Chem. C 118 (2014) 6090–6099.
[61] J.-P. Hsu, H.-H. Wu, C.-Y. Lin, S. Theng, Ion current rectification behavior of bioinspired nanopores having a pH-tunable zwitterionic surface, Anal. Chem. 89 (2017) 3952–3958.
[62] A. M. Baptista, V. H. Teixeira, C. M. Soares, Constant-pH molecular dynamics using stochastic titration, J. Chem.
Phys. 117 (2002) 4184–4200.
[63] R. Eisenberg, PNP What is in a name? july 25-1 2019.pdf 10.31224/osf.io/2739d.
https://doi.org/10.31224/osf.io/2739d (2019).
[64] M. Ali, I. Ahmed, S. Nasir, P. Ramirez, C. M. Niemeyer, S. Mafe, W. Ensinger, Ionic transport through chemically functionalized hydrogen peroxide-sensitive asymmetric nanopores, ACS Appl. Mater. Inter. 7 (2015) 19541–19545.
[65] S. Nasir, M. Ali, J. Cervera, V. Gomez, M. H. A. Haider, W. Ensinger, S. Mafe, P. Ramirez, Ionic transport characteristics of negatively and positively charged conical nanopores in 1:1, 2:1, 3:1, 2:2, 1:2, and 1:3 electrolytes, J.
Coll. Interf. Sci. 553 (2019) 639–646.
18