Journal Pre-proofs
Bloch surface waves biosensing in the ultraviolet wavelength range – Bragg structure design for investigating protein adsorption by in situ Kretschmann- Raether ellipsometry
Benjamin Kalas, Karpat Ferencz, Andras Saftics, Zsolt Czigany, Miklos Fried, Peter Petrik
PII: S0169-4332(20)32626-X
DOI:
https://doi.org/10.1016/j.apsusc.2020.147869Reference: APSUSC 147869
To appear in:
Applied Surface ScienceReceived Date: 25 June 2020
Revised Date: 27 August 2020 Accepted Date: 9 September 2020
Please cite this article as: B. Kalas, K. Ferencz, A. Saftics, Z. Czigany, M. Fried, P. Petrik, Bloch surface waves biosensing in the ultraviolet wavelength range – Bragg structure design for investigating protein adsorption by in
situ Kretschmann-Raether ellipsometry, Applied Surface Science (2020), doi: https://doi.org/10.1016/j.apsusc.2020.147869
This is a PDF file of an article that has undergone enhancements after acceptance, such as the addition of a cover page and metadata, and formatting for readability, but it is not yet the definitive version of record. This version will undergo additional copyediting, typesetting and review before it is published in its final form, but we are providing this version to give early visibility of the article. Please note that, during the production process, errors may be discovered which could affect the content, and all legal disclaimers that apply to the journal pertain.
© 2020 Published by Elsevier B.V.
Bloch surface waves biosensing in the ultraviolet wavelength range – Bragg structure design for
investigating protein adsorption by in situ Kretschmann-Raether ellipsometry
Benjamin Kalasa,b, Karpat Ferenczc,d, Andras Safticsa, Zsolt Cziganya, Miklos Frieda, Peter Petrika
aInstitute for Technical Physics and Materials Science, Centre for Energy Research, Konkoly-Thege Rd. 29-33, 1121 Budapest, Hungary
bDoctoral School of Physics, Faculty of Science, University of Pecs
cInstitute for Solid State Physics and Optics, Wigner Research Centre for Physics, Konkoly-Thege Rd. 29-33, 1121 Budapest, Hungary
dOptilab Ltd., Sulyok Str. 2, 1031 Budapest, Hungary
Abstract
We designed a Bragg mirror structure with an SiO2 top layer to create a reso- nance in the ultraviolet wavelength range, near the absorption peak position of various proteins. We demonstrate that the wavelength of enhanced sensitivity can be adjusted by proper design of the 1D photonic structure. The possibil- ity to design the wavelength of enhanced sensitivity supports measurements of better selectivity, optimized for the absorption of the target material. Since the width of the resonant peak in the reflectance spectra can be sharper than those of plasmonics, and they can be positioned at more favourable regions of the in- strument and material (e.g., in terms of intensity or selectivity), the sensitivity can exceed those of plasmon-enhanced measurements. In this study we demon- strate the main features of the concept at the example ofin situ spectroscopic ellipsometry of fibrinogen adsorption in the Kretschmann-Raether configura- tion. We realized a resonant peak with a full width at half maximum of 3 nm near the wavelength of 280 nm, which coincides with the absorption maximum of fibrinogen. The influence of depolarization and surface roughness on the mea- surements, and the potential for improving the current experimental detection limit of 45 pg/mm2 is also discussed.
Keywords: Optical sensors, Ellipsometry, Bloch surface waves, Biomolecule detection, Plasmonics
1. Introduction
Optical biosensors are of fundamental role in their field of label-free charac- terization of various processes related to biomolecules due to the outstanding sensitivity and non-destructive characteristic [1, 2]. Among the numerous op- tical sensing approaches surface plasmon resonance (SPR) spectroscopy [3, 4]
5
is one of the most widely used technique for capturing the typically minute changes in the signal, related to e.g., protein adsorption or conformation changes of biomolecules. Biological changes are accompanied with a change in the op- tical properties and thus biological processes can be studied in SPR approach by measuring the reflectance of a p-polarized probe light. In case of SPR spec-
10
troscopy usually a thin Au film is used as a sensing layer. With the help of the so-called Kretschmann-Rather configuration [5] propagating surface plas- mon oscillation can be excited by incident light at the interface of Au layer and aqueous ambient. If appropriate conditions are fulfilled, the incident light couples with surface plasmons, thus a dip appears in the reflectance spectrum.
15
The exact wavelength (λ) value of this dip is highly dependent on the thickness (d) and optical properties of the Au layer [6], the angle of incidence (θ) of the light beam, the optical properties of the configuration and most importantly the optical properties of the investigated ambient near the Au surface.
Enhanced sensitivity can be reached by various approaches in SPR spec-
20
troscopy. One may not only monitor the reflectance, but also the phase in- formation provided by novel measurement setups [7] or by spectroscopic ellip- sometry (SE) [8]. SE is a method with outstanding sensitivity to the optical properties of a solid surface that makes it ideal for biosensing applications [9].
The combination of SE and SPR spectroscopy can be realized reasonably [10].
25
This combined configuration is usually referred in the literature as total internal reflection ellipsometry (TIRE) [11]. TIRE has several advantages, such as the
large freedom in terms of theθandλrange compared to a traditional SPR con- figuration of either a λ- or a θ-tracking principle. Compared to the biological measurements through the liquid ambient with SE, TIRE is far more sensitive
30
as well as the available λ range is wider since the absorbance of the aqueous ambient is not present anymore.
Constructing novel layer structures can also contribute to the enhanced sen- sitivity [12]. By using not only a bare Au layer but also one or more 2D layers (e.g., graphene, molybdenum-disulfide) on top of the Au film may lead to a
35
superior sensing performance [13, 14]. Another layer structure with improved sensitivity utilizes the so-called long range surface plasmons (LRSPRs) [15, 16].
LRSPRs are special surface modes that are usually enhanced when using a thin metal layer positioned between two dielectric media with similar refractive indices (n).
40
It is also possible to realize a TIRE biosensor without a thin Au layer and the absence of any SPR related material (usually metal) in a sensing structure has already been proposed [17, 18, 19, 20]. As an example, a new configuration has been introduced recently for biosensing applications, the so-called Bragg- mirror structure (BMS) [21, 22, 23, 24, 25]. Similar to SPR, electromagnetic
45
waves (the so-called Bloch surface waves) are confined to the surface of the layer structure which show an exponential decay of the field inside the layered medium and in the liquid ambient. These tailored periodic layer structures have several improved features compared to the usually used Au layers [26].
One of the most important advantages is the large freedom they provide in
50
terms of operating wavelength (OW). Carefully choosing the optical properties and thickness of the layers in the BMS one can achieve basically any OW that is aimed. The resonance peaks are usually narrower – due to the small absorption of the dielectric materials constituting the structure – leading to an improved performance over the SPR sensor, and in case of BMS, s-polarized light can
55
also be used for surface wave excitation. Surface chemistry can also be more convenient, since dielectric materials (e.g. SiO2) are allowed instead of a Au layer on the top at the reaction interface.
In this work, a novel BMS of alternating SiO2and ZrO2layers on fused silica substrate was introduced that can be used as a biosensor in the ultraviolet (UV)
60
range of the wavelength spectrum. Other techniques [27] working with a plas- monic structure have also been proposed [28, 29] for biosensing in the UV range, however, BMS can offer additional attractive properties. The tailored OW can be chosen in the range ofλ = 265−365 nm (near to the absorption peak of several proteins [30]), depending on the angle of incidence. The sensor perfor-
65
mance of the proposed BMS was demonstrated by investigating its response to glycerol solutions in a wide %(w/w) range as well as to bovine fibrinogen (Fgn) solution in phosphate buffered saline (PBS). The results are compared to the performance of an SPR-based structure consisting of a single Au layer. The char- acterization of these structures was performed using spectroscopic ellipsometry
70
(SE), thus the phase information was also measured providing more information and enhanced sensitivity. The SE measurements with BMS (BMS-SE) and SPR (SPR-SE) were evaluated by constructing appropriate optical models. The ef- fect of various imperfections (e.g., surface roughness, angular spread of the light beam) to the sensitivity were numerically analyzed.
75
2. Materials and methods
2.1. Preparation of model solutions
For characterizing the optical biosensing performance of BMS-SE glycerol so- lutions (from VWR, glycerol bidistilled 99.5%) of various concentrations (rang- ing from 0 to 29% (w/w)) in ultrapure deionized (DI) water as well as Fgn (from
80
Sigma-Aldrich) solution in prefiltered 10-mM PBS with a concentration of 0.5 mg/mL were prepared at room temperature (RT).
2.2. Refractometry
A standard automatic refractometer (J157 Automatic Refractometer) was used to measure the refractive index (RI,n) of glycerol solutions at RT with
85
an accuracy of RI±0.0001 and thus to obtain an independent measurement to compare with the SE results both on the BMS-SE and SPR-SE structures.
2.3. Spectrophotometry
Proteins usually have an absorption maximum at 280 nm due to the ab- sorbance of two aromatic amino acids tryptophan (Trp) (max. at 280 nm) and
90
tyrosine (Tyr) (max. at 275 nm) and to a smaller extent also cystine (i.e., disulfide bonds) [31].
The peptide groups of the protein main chain absorbs light with a maximum at aboutλ= 190 nm. The aromatic side-chains of Tyr, Trp and phenylalanine (Phe) also absorb light in this region and besides, they also absorb in theλ=
95
240−300 nm range. Disulfide bonds that form between two cysteine residues also show an absorbance band nearλ= 260 nm.
To obtain the UV and visible absorbance spectra of the glycerol and protein solutions spectrophotometric measurements were carried out. The spectropho- tometer (Agilent 8453) used in this study had two light sources, a tungsten-
100
halogen and a deuterium lamp, both for covering a wideλrange from the UV to NIR (ca. between 190 and 1100 nm). The light from the sources passed through a monochromator and was focused into the fused silica (FS) cuvette filled with the investigated solution. Subsequently, the transmitted light was detected by a photomultiplier.
105
The absorbance (A) was calculated from the transmittance (T) given as T =I/I0, where I is the transmitted light intensity andI0 is the intensity of the light beam before the l = 10 mm long cuvette. The absorbance was then calculated asA=−log10T.
All the measured absorbance spectra were measured at RT and the spectrum
110
of ultrapure deionized (DI) water with a resistivity of 18.2 MΩcm was used as a background measurement.
2.4. Spectroscopic ellipsometry
A Woollam M-2000DI rotating compensator spectroscopic ellipsometer was used in the range ofλ= 191−1690 nm at variableθutilizing the Kretschmann-
115
Raether (KR) geometry that allowsθup to 75◦ when using the focus extension.
The dual-source equipment allows high intensities in the UV spectral range,
which is of primary importance in the current study. We also utilized an im- proved hemisphere for the KR ellipsometry (KRSE) setup that contributed to the outstanding signal-to-noise ratio in the crucial spectral range below 300 nm.
120
The KR cell can be mounted on the mapping stage of the ellipsometer [32], and the optical adjustment of the system is supported by the control of the mapping stage. The optical parameters of the KR setup (focusing lenses, hemisphere, glass slide, index matching liquid) enabled us to use the λ = 200−1690 nm spectral range of the ellipsometer. The spectral resolution bandwidth is around
125
5 nm and 10 nm in the UV/VIS and in the near infrared wavelength ranges, respectively. The spectral density of the experimental data points is about 1.6 nm and 3.4 nm in the UV/VIS and in the near infrared wavelength ranges, respectively. The angular divergence is smaller than 0.3◦without focusing, that can be significantly higher while using KRSE.
130
It is important to point out that the depolarization caused by angular spread and spectrometer bandwidth is hard to separate, since their effect on the mea- sured spectra is similar. Thus, a bandwidth value specified by the manufacturer was used in this analysis and only the angular spread was fitted simultaneously with the ellipsometric angles.
135
As a result of the measurement, usually the ellispometric angles Ψ and ∆ are presented for a wide θ andλrange (where Ψ and ∆ describe the complex reflection coefficient ofρ =rp/rs = tan(Ψ)·exp(i∆)). The optical properties and other physical parameters are obtained by fitting the parameters of an op- tical model utilizing the transfer matrix method (TMM) using the Levenberg-
140
Marquardt algorithm [33] (calculated by the commercial software of Comple- teEASE).
2.5. Flow cell design
In order to exploit the potential of SE for in situ TIRE measurements, a 10-µl flow cell has been realized with a KR configuration consisting of an FS
145
hemicylinder (Fig. 1A). This configuration makes the investigation of the optical properties possible in a liquid ambient in the range ofλ= 200−1690 nm, and
also in a wide angle of incidence range ofθ = 45−75◦. For ensuring the best performance (e.g., due to ensuring a normal incidence at the air/hemisphere interface over the whole illuminated spot), a focused light beam is used during
150
the measurements with a spot size below 1 mm.
It is not exploited in this work, however, there is room for miniaturization [34] using the same concept. Although with the current hardware the beam cannot be focused below a diameter of approximately 300 micron, if the scanning capability is not used, the lateral size of the flow cell can theoretically be as small
155
as the spot itself, with a depth also smaller than a millimeter, which results in a microliter-size cell. With a restricted wavelength range the spot size can also be smaller. This approach can also be combined with imaging ellipsometry having a lateral resolution down to one micron.
3. Results and discussion
160
3.1. Fabrication and characterization of the BMS and SPR structures
BMS was fabricated by electron beam evaporation on a FS glass slide. The stack consists of alternating SiO2 and ZrO2 layers with d = 165 and 42 nm, respectively (Fig. 1A). These thickness values and the optical properties of the layers were custom-designed to have a sharp reflectance dip in the UV range.
165
Note that electron beam evaporation may produce porous oxide layers [35] that can adsorb water from the ambient causing a drift in the measured signal. In this study we found, however, that after a relaxation time of a day, all these drifts were eliminated and the signal was stable.
The freshly prepared samples were then cleaned using a rinse of DI water and blown by nitrogen stream. The characterization was carried out in λ = 200−1690 nm andθ= 60−70◦with a step of 5◦. An optical model was built consisting of all the thicknesses and optical parameters (Fig. 2B left hand-side).
It was supposed that all the layers with the same composition have the same complex refractive indeces (ˆn= n+ ik, wherek is the extinction coefficient), thus their values were coupled in the analysis. The optical properties of the
alternating SiO2 and ZrO2layers were described using the Cauchy term:
n(λ) =AC+BC
λ2 +CC
λ4 , (1)
whereλcorresponds to the incident wave in vacuum in unit ofµm, the param- eterAC is dimensionless, whileBC and CC are in the units of µm2 and µm4, respectively. For describing the absorption of ZrO2 layers the Urbach-tail was also included in the optical model:
k(λ) =DC·exp{FC[1.24µm(λ−1−γ−1)]}, (2) where DC is the amplitude, FC is an exponent factor and γ is the band edge in the unit of µm. Since it is correlated with the other parameters, the band edge was not fitted, and its value was fixed at the lowest measured wavelength value ofλ= 0.2 µm. The dielectric optical properties of the FS substrate was described by using the Sellmeier term:
n(λ) =
ε∞+ ASλ2
λ2−BS2 −ESλ2 12
, (3)
whereε∞,AS,BS andES are the offset, amplitude, center energy and position
170
of a pole in the IR region, respectively. These parameters were fixed at values of AS = 81.533 1/µm2, BS = 10.895 µm2 and ES = 0.0155 1/µm2 and only ε∞ was fitted. The relation between the complex dielectric function (ˆε) and ˆn is described as ˆε=ε1+ iε2= ˆn2.
During the fitting process, the root mean square error (RMSE) was min- imized and we accepted the calculated values of the parameters as the true physical values at lowest value of the RMSE [36]:
RMSE = v u u u t
1 3p−m
n
X
j=1
Njexp−Njcal σexp
Nj
2
+ Cjexp−Cjcal σexpCj
!2
+ Sexpj −Sjcal σSjexp
!2
, (4)
wherepis the number of the measuredλvalues,mis the number of the unknown
175
parameters in the model, ’exp’ and ’cal’ denote the measured and calculated N= cos(2Ψ), C= sin(2Ψ) cos(∆) andS= sin(2Ψ) sin(∆) values, whileσis the standard deviation of the measured data. The depolarization is given in % and
defined asDepol.= (1−P2)·100%. HereP denotes the polarization calculated asP =p
(N2+C2+S2).
180
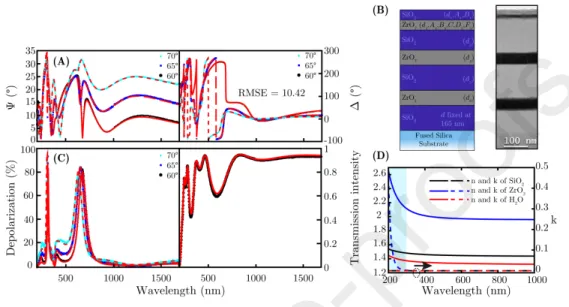
The spectra of the measured ellipsometric angles and the fitted curves are shown in Fig. 2A. In this analysis not only the measured values of Ψ and ∆ were fitted but simultaneously the depolarization and the measured transmission intensity (the latter from an independent measurement on the same sample) were also taken into account (Fig. 2C). The depolarization emerges from the
185
back-side reflection of the light beam due to the transparency of the relatively thin FS substrate. If the depolarization is zero, there is no back-side reflection.
In case of depolarization, however, incoherent interference modeling must be included in the model. This effect is present mainly in the range ofλ= 200− 1000 nm for all investigatedθ.
190
The optical properties and thicknesses of the layers shown in Fig. 2D and Table 1 were calculated from the fitted spectra of Fig. 2A and from Fig. 2C.
The optical model includes 14 fitted parameters: 2 Cauchy parameters for the SiO2 layers (CC was fixed at zero), 5 Cauchy parameters for the ZrO2 layers also describing k(λ), and six d values (the bottom SiO2 was fixed at 165 nm
195
due to itsnsimilar to the substrate);ε∞was also fitted to describe the optical properties of the FS substrate. It is notable that in spite of the relatively large number of fitted parameters, the confidence limits (as shown by the confidence limit values in Table 1) and parameter correlations are small. This is partly due to the large differences in the values and spectral distributions ofn and k of
200
the subsequent layers, as shown in Fig. 2D. The onset of absorption for ZrO2
at λ = 300 nm and downwards is necessary for the good performance of the structure.
The optical properties of the layers determined above were used in the KR configuration applying the transfer matrix method (TMM) and in the finite ele-
205
ment (FE) field distribution calculations by the CompleteEASE and COMSOL software, respectively. Allnandkvalues were imported from the measurements of Fig. 2 and Table 1. This step was vital, since a significant depolarization was evident from previous measurements in the KR configuration due to the
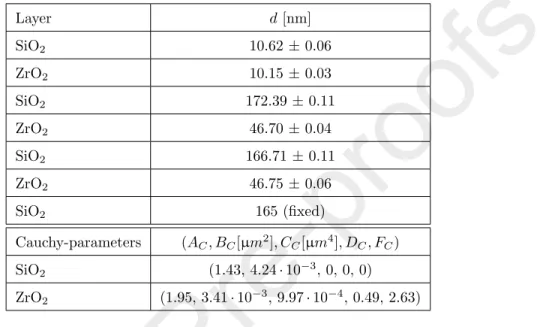
Table 1: Calculated thicknesses (d) and Cauchy parameters of the BMS with 90% confidence limits (from the top of the structures). The confidence limits of the Cauchy parameters are better than 5%.
Layer d[nm]
SiO2 10.62±0.06
ZrO2 10.15±0.03
SiO2 172.39±0.11
ZrO2 46.70±0.04
SiO2 166.71±0.11
ZrO2 46.75±0.06
SiO2 165 (fixed)
Cauchy-parameters (AC, BC[µm2], CC[µm4], DC, FC) SiO2 (1.43, 4.24·10−3, 0, 0, 0) ZrO2 (1.95, 3.41·10−3, 9.97·10−4, 0.49, 2.63)
angular spread of the focused beam and to the spectrometer bandwidth [37].
210
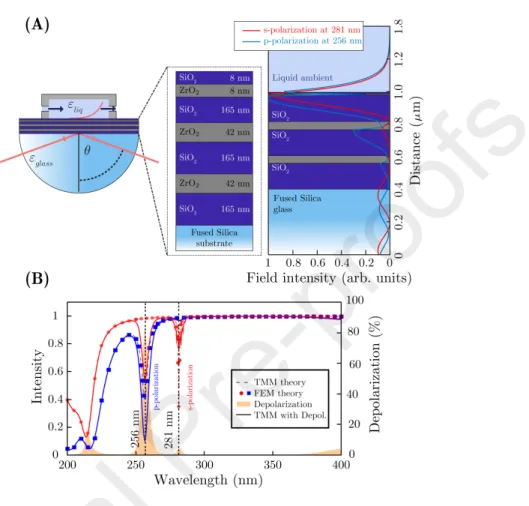
This depolarization has usually a huge effect on the measured spectra in KRSE (Fig. 1B).
As the first step, intensity spectra for both polarizations were calculated for λ= 200−400 nm atθ= 74◦ using TMM and FE (Fig. 1). An excellent agree- ment was found ensuring that the calculations are physically relevant in terms
215
of the exact position and full-width at half maximum (FWHM) of the resonant features. Subsequently, a typical spectrometer bandwidth and angular spread value of 1.0◦ was added to the TMM model, that introduced depolarization to the system as presented in Fig. 1B. The depolarization has a strong effect on the intensity spectra, as the sharp s-polarized dip at 281 nm almost disappears,
220
and a new one at 256 nm emerges, exactly at the position of the p-polarized in- tensity dip, implying polarization mixing. At the same time, the depolarization enhances the dip of p-polarized light atλ= 256 nm.
From the FE calculation the penetration depth can be estimated as the depth
where the field intensity decays to 1/e of its value on BMS surface. Thus the
225
calculated penetration depth in the liquid ambient is close to 50 nm for both polarizations atθ andλvalues presented in Fig. 1. Note that the penetration depth of SPR is usually several hundred nanometers [3].
The FS slides used for the 40 nm Au layers were identical to those of the BMS. For Au layer plasmonicsd= 40 nm was chosen as the most sensitive one,
230
based on previous results from Ref. [6]. The thin Au layer was also character- ized by SE at θ = 60, 65 and 70◦, and the result of a transmission intensity measurement was fitted simultaneously. The optical model for this structure is presented in the inset of Fig. 3. In this case the only fit parameter was the thick- ness of the Au layer, while its optical constants were from a Kramers-Kronig
235
consistent fit of data from Ref. [38].
3.2. Optical properties of Fgn protein solutions
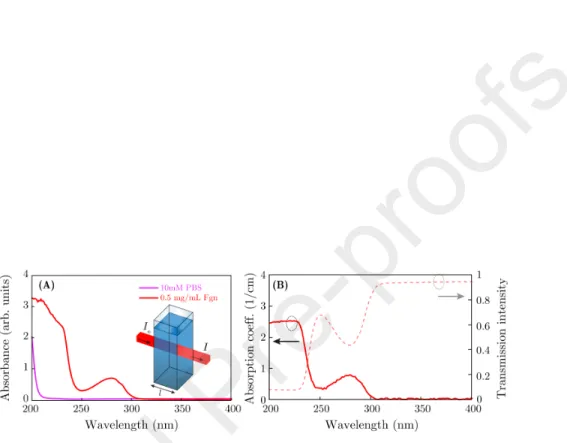
Fgn solution was prepared with a protein concentration of 0.5 mg/mL in 10-mM filtered PBS. The absorbance spectra of Fgn solutions were measured using spectrophotometry, shown in Figs. 4A and 4C, respectively. The Fgn
240
solution shows an absorption peak at the wavelength of≈280 nm, and a region of increasing absorbance below 250 nm toward the smaller wavelengths.
Supporting measurements were also carried out using SE in the same config- uration. The solution was measured in the same quartz suprasil cuvette (from Hellma Analytics) and the transmission intensity data were collected by SE.
245
The baseline was DI water for this investigation, and the absorption coefficients were calculated using an optical model only consisting of a 10 mm layer (rep- resenting the solution). The optical properties were fitted using a wavelength- by-wavelength approach which is especially helpful for describing ˆnwithout any assumptions for the dispersion. The measurements were analyzed in the range
250
ofλ= 200−400 nm and ˆεwas fitted at each measuredλ- presented here by the absorption coefficient (α= 4πk/λ) in 1/cm (Fig. 4B and D). It is important to point out that this method is practically insensitive to the real part of ˆn, however, valuable information was extracted regardingkof the solutions.
The SE and spectrophotometric results of Fgn show an excellent agreement
255
forλ≈ 230−400 nm, with an increasing deviation from λ = 230 nm toward the smaller wavelengths.
Similar measurements of glycerol solutions are also presented in the Sup- porting Information with the measured spectra.
3.3. Sensing the bulk optical properties
260
For calculating the sensing performance of BMS to bulknvariations, glycerol solutions of different concentrations were measured in the KR cell at the flow of 1µL/s. The same measurement was carried out on the SPR layer as a reference of the BMS-SE measurement and a comparison regarding its performance. θ was fixed at values of 73.5◦ (BMS-SE) and 75◦ (SPR-SE) from previous opti-
265
mizations for the best sensitivity. Note that while the ellipsometer of this study using a compensator rotating at 20 Hz is theoretically capable of measuring a whole spectrum within less than 50 ms, the uncertenities in the measured re- fractive indices will also rise. For an ideal time resolution and signal-to-noise ratio, an integration time of 3 s was used during thein situ measurements. The
270
refractive indices of the glycerol solutions were measured in repeated sequences similar to the one presented in Fig. 6A and the calculatednvalues were found the same within our sensitivity range.
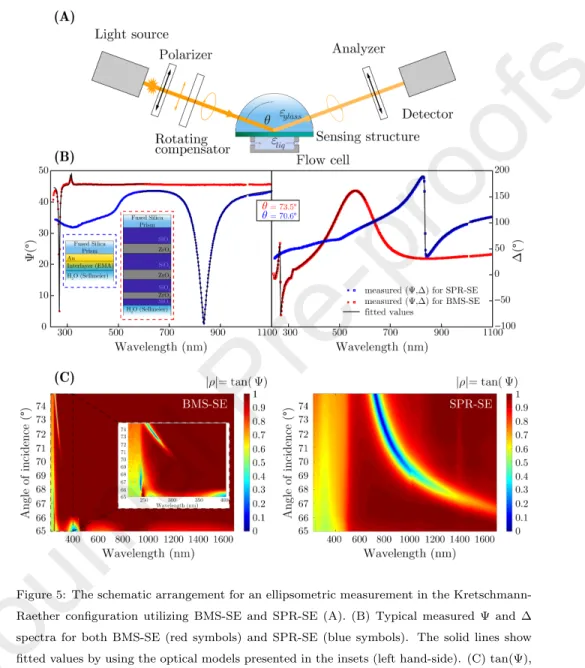
Measured Ψ and ∆ spectra are presented in Figs. 5 and 6A. The illustration of KR configuration is shown in Fig. 5A, together with the measured and fitted
275
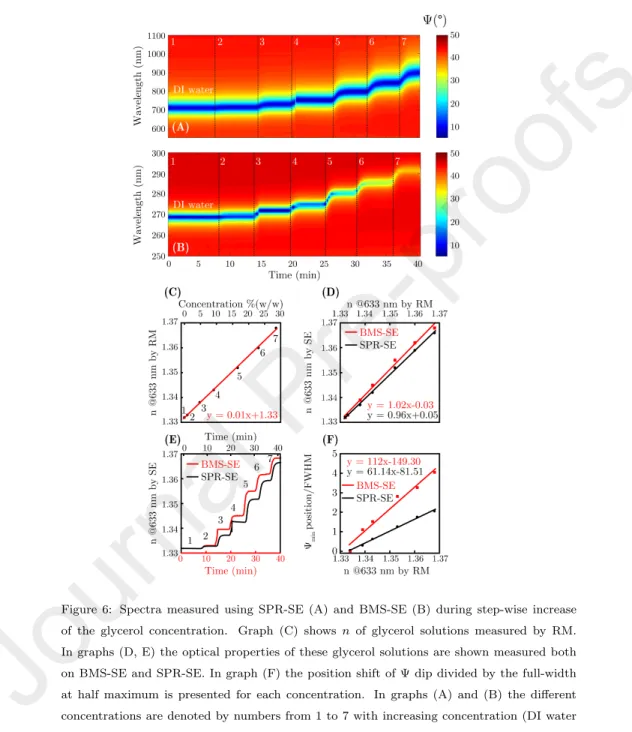
Ψ and ∆ spectra for both the BMS and SPR structure with the optical models in the inset (Fig. 5B). The absolute vale of the measured complex reflectance ratio (|ρ| = tan(Ψ)) is also presented in Fig. 5C. Figs. 6A and 6B show a map of Ψ for each time slice for both SPR-SE and BMS-SE, respectively. The glycerol concentration was increased step-wise from 0 to 29% (w/w) supplied by
280
a peristaltic pump. From this figure we conclude that the BMS structure has a much favorable FWHM of only≈3-4 nm, in contrast to the ≈61-63 nm of the SPR approach. Another notable feature is that the shift of the resonant dip in the case of the SPR layer is approximately eight times larger but less significant
than that of BMS-SE, when normalized to the FWHM (Fig. 6F).
285
The spectra of Figs. 6A and 6B were evaluated using the BMS and SPR structure and the depolarization caused by the angular spread of the focused light beam was also fitted. The shift in the measured data caused by the stress in the hemicylinder was taken into account using offset values. The dispersion of n for the glycerol solution, fitted using the Sellmeier model of Eq. 3, was
290
determined as a function of the concentration. Then values at λ = 633 nm were calibrated using refractometry (RM) as shown in Fig. 6C. A comparison with both the BMS and SPR approaches (Figs. 6D) reveals a good agreement.
Note that the concentration dependence ofnis available for the whole measured range ofλ= 200−1690 nm from the SE measurements.
295
Taking advantage of the 3 s temporal resolution of the SE measurements,n was plotted as a function of time (Fig. 6E) for both the BMS-SE and SPR-SE approaches atλ= 633 nm in order to be comparable with the RM results of Fig.
6C. The difference between the BMS-SE and SPR-SE curves of Fig. 6E is less than 10−3 refractive index unit (RIU). The slight deviation might be caused by
300
the different surface materials (Au vs. SiO2) influencing the adsorption process.
Fig. 6F shows the shift of the position of Ψmin dip (relative to the position corresponding to the DI water) normalized to the FWHM (∆Ψmin/FWHM is also called figure of merit (FOM) [39]), revealing an almost two times better resolution for BMS-SE.
305
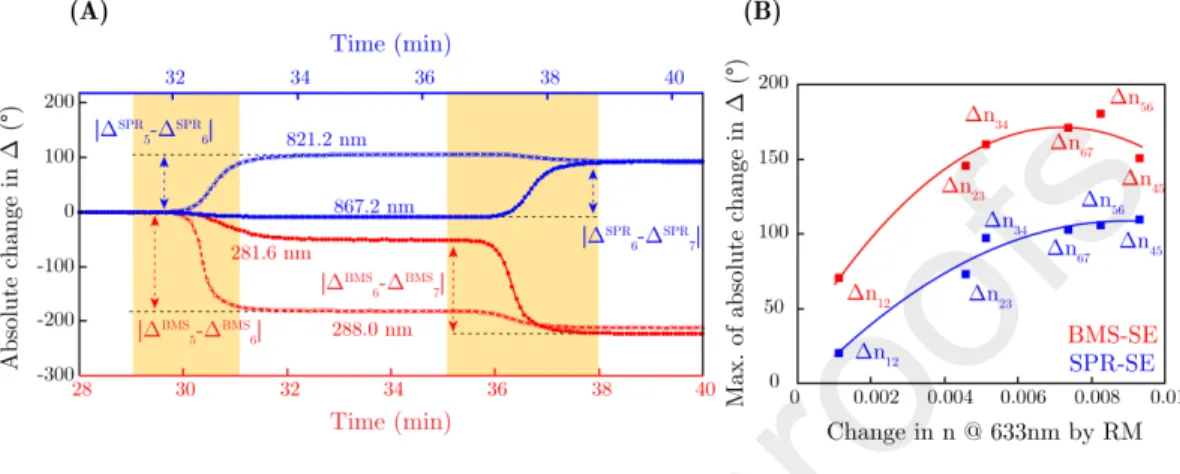
The phase information, represented by the ∆ ellipsometric angle was also investigated for both structures (Fig. 7). The most sensitive wavelengths were identified for each glycerol solution transition (∆nij=nj−ni @ 633 nm, where i andj denote the regions marked in Fig. 6A) and the maximum of absolute changes in ∆ were plotted at a given wavelength in Fig. 7B. For demonstrating
310
this method four curves were plotted in Fig. 7A for transitions between glycerol samples ’5’→’6’ and ’6’→’7’ at four different wavelengths. From this analysis the measurement of BMS-SE shows an enhanced sensitivity compared to SPR-SE.
Note that in the case of BMS-SE we suppose that due to its sharp-resonance manner we are not necessarily able to find the biggest change in ∆ ellipsometric
315
angle due to the final wavelength resolution of 1.5 nm and thus we obtained a smaller value to the ∆n45 transition compared to the other transitions in Fig.
7B.
A limit of detection (LOD), as the smallest detectable bulk refractive index change was calculated using the expression LOD = 3·σmeas/S, where σmeas
320
is the standard deviation of ∆ time-point values of a given wavelength for a baseline for the same solution. S is the sensitivity defined as S = ∆∆/∆n.
Sensitivity of ∆ is usually higher than for Ψ, thus in the further analysis all values were calculated using the phase information. Based on the measurements a bulk refractive index LOD of 4.35·10−5 RIU and 3.32·10−5RIU were found
325
for BMS-SE and SPR-SE, respectively. This result shows that BMS-SE has almost the same biosensor performance as SPR-SE, even in the presence of a higher measurement noise.
Further supporting calculations based on numerical TMM calculations are also presented in the Supporting Information, emphasizing the significance of
330
the effect of emerging depolarization on the measured Ψ and ∆ spectra.
3.4. Investigation of Fgn adsorption
The spectral range of in situ bioellipsometry is usually limited either by the transparency of the water [40, 41], the optical components or the lack of information of the dispersion of protein in the UV range. Thenandkspectra of
335
protein can usually be fitted using a polynomial [40] and an exponential function, respectively. However, as the transmission and absorption results in Fig. S1 show, the polynomial and exponential dispersions must be completed with an oscillator model for an accurate description of the features belowλ≈280 nm.
One of the most important applications of the proposed layer structure and also of plasmonic layers is the monitoring of various bioprocesses near the sens- ing surface. For demonstrating the performance of BMS-SE, Fgn was chosen as a model protein to study the adsorption onto the surface of SiO2 (BMS-SE) and Au (SPR-SE). The dispersion ofn for this kind of adsorbed protein layer is usually described by the Cauchy-dispersion. However, due to the absorption
of Fgn in the UV region, further investigations were needed prior to the optical modelling. For this reason, Fgn adsorption was also monitored in a conven- tional flow cell (introduced in Ref. [40]) where the light beam travels through the window and the liquid, to be reflected from the surface of SiO2 on the Si substrate. An appropriate optical model was built to describe the system with- out the adsorbed protein layer (consisting of a Sellmeier ambient (PBS) with a SiO2/Si structure), thus after a 30-min protein adsorption process only one additional layer was needed in the model to describe the optical properties of the formed protein layer. It is important to emphasize that the buffer ambient was the same for describing the structure without/with the protein layer. A point-by-point analysis was performed with a fixed d= 6.5 nm corresponding to the thickness of an adsorbed monolayer. From this analysis two peaks were identified ink, which were fitted by two Kramers-Kronig consistent Gaussian oscillators. ε2 for thejth oscillator is given by
ε2=AGj·
ΓGE−Enj
σj + ΓGE+Enj
σj +i
exp
−
E−Enj
σj 2
exp
−
E+Enj
σj
2 , (5)
whereEis the photon energy of incident light in eV,σj =Brj/2p
( ln 2). Here,
340
AGis the amplitude,Enis the center energy in eV andBris the broadening in eV. ΓG is a convergence series that produces a line shape forε1 in a Kramers- Kronig consistent manner [42]. An additional parameter, a constant value from KK-integrationεG∞was also fitted, and was found to beεG∞= 1.27±0.03. k is in turn the imaginary part of (ε1+ iε2)1/2. The calculated results are shown
345
in Fig. 8C and in Table 2, where ˆn and the oscillator parameters of the Fgn layer are presented. Note that the calculated optical properties may be valid only for an Fgn layer with a given volume fraction, since numerical random sequential adsorption models showed that there is a maximum coverage that can be achieved during protein adsorption [43].
350
During protein adsorption the ˆnvalues of the Fgn layer (nF gn) were fixed and only the thickness of the layer (dF gn) was fitted. The surface mass density
Table 2: Values of the oscillator parameters from Eq. 5 fitted on a measurement of Fgn ad- sorbed on a Si wafer. The uncertainty values behind the ”±” sings refer to the 90% confidence limits. The last column shows the center energy of the oscillators in nm.
Oscillator parameter AG Br(eV) En(eV) En(nm)
j= 1 0.18±0.01 0.43±0.03 4.41±0.01 280.1±0.6 j= 2 0.25±0.01 0.80±0.05 5.79±0.02 214.0±0.9
(SMD, ΓF gn) was calculated fromdF gn using the de Feijter equation [44]:
ΓF gn= dF gn(nF gn−nP BS)
a , (6)
where nP BS is the refractive index of the PBS ambient, and a denotes the refractive index increment of the Fgn solution (ns) with the Fgn concentration (dns/dcF gn) at the wavelength value of 632.8 nm. The value ofawas fixed at 0.18 mL/g. ΓF gn is calculated in the unit of ng/mm2.
The temporal evolution of ΓF gn is shown in Fig. 8D for both the BMS-SE
355
and SPR-SE measurements. From the similar profiles we conclude that there is only a slight difference between the two adsorption curves stemming probably from the different surface materials of the BMS and SPR structures (SiO2 vs.
Au, respectively). The calculated SMD is in good agreement with several other results published before [45, 46, 47]. The absolute changes in Ψ and ∆ during
360
the adsorption are also presented for the most sensitiveλin Figs. 8A and 8B.
The variations corresponding to the BMS are comparable with those of the SPR, revealing an excellent sensitivity in both cases. Apart from the amplitude ratio (tan(Ψ) = |ρ| =|rp/rs|) the phase (∆) of ρ is also measured by SE showing a variation that is six times larger than that of Ψ (Fig. 8B vs. 8A) for both
365
the BMS and SPR structure, which leads to a sensitivity that is significantly larger than that of simple amplitude and intensity measurements [6]. Also note that apart from the capability of the accurate sensing at the selected λ and θ, SE adds a modeling opportunity due to the large number of data in a broad spectral range. Although most of the spectral regions do not offer a high
370
sensitivity, the models can be used to have an insight in the layer structures and
inhomogeneities, to have a better understanding of the complex processes that occur during the high-sensitivity variation of the signal at the most favorableλ.
The limit of detection was also calculated for the smallest detectable surface mass density by using the expression of LODSM D = 3·σmeas/SSM D, where
375
σmeas is the standard deviation of ∆ at a given wavelength for several time points, circulating only PBS in the flow cell, andSSM Dis the sensitivity in ∆ to the protein adsorption. For both SPR-SE and BMS-SE LODSM Dwas calculated and were found to be 16.50 pg/mm2 and 43.39 pg/mm2respectively. Note that the reason of the slightly worse LOD for BMS-SE is the significantly higher
380
σmeas in the UV wavelength range. It means that the BMS-SE method used for absorption features above the UV range can reveal a much better sensitivity.
There is also room for the improvement ofσin other areas of instrumentation that increases the signal-to-noise ratio and the stability.
3.5. Selectivity properties of BMS
385
The biosensing capability and properties of BMS in terms of bulk and thin film sensitivity and adsorption monitoring was discussed in the above sections.
Although it was not investigated here in detail, it is important to point out the potential of the proposed approach for a high-selectivity measurement of pro- cesses in non-adsorbing solutions and various proteins with different absorption
390
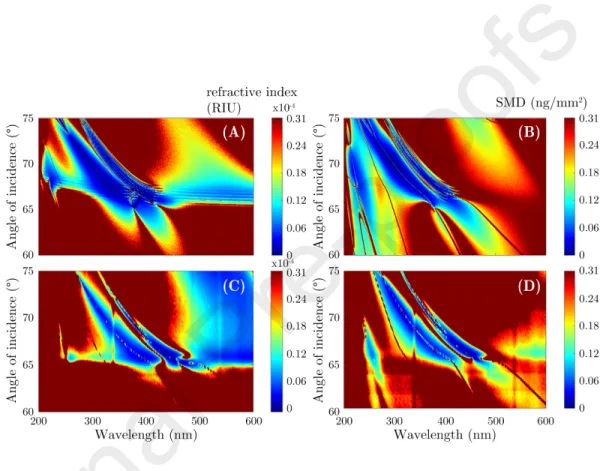
peaks. The individual sensitivities of bulk n variations and layer formations can be estimated by simulations using the optical parameters of the systems determined above. Numerical TMM calculations were performed to calculate the deviation of ∆ between PBS and DI water using the values of the measured dispersion ofn(ADIS = 0.908 andAP BSS = 0.914, respectively, in the Sellmeier
395
model of Eq. 3). Using the CompleteEASE software a typical amount of noise was added to the simulation stemming from the measurement equipment and also from the layer structure. The sensitivity in this case is given as the variation in nor SMD corresponding to the smallest detectable change in ∆ defined as five times the noise of a ∆ spectra at a given angle of incidence. The simulation
400
was performed in the range of λ = 200−600 nm andθ = 60−75◦ in steps
of 0.05◦. The same calculation was also performed with/without a 6.5 nm thin Fgn layer that has the optical properties as shown in Fig. 8C. The results are presented for n(bulk) and SMD (layer) sensitivity in Fig. 9. It is remarkable that in the range of λ < 300 nm completely different structures appeared in
405
the sensitivity maps. These calculations are also supported by measurements for the same ranges of λand θ, shown in Figs. 9C and 9D including the ex- perimental noise of the measurements. From the simulation minimum values of 1.23·10−6RIU and 6.7 pg/mm2 were identified as the smallest detectable bulk refractive index change and SMD change, respectively. From the measurements
410
these values were found to be 6.55·10−6 RIU and 10.4 pg/mm2.
4. Conclusion
Three pairs of SiO2and ZrO2 layers were evaporated on FS slides to create a multilayer structure with a sharp (FWHM=3-4 nm) absorption feature in surface-enhanced internal reflection Kretschmann-Raether configuration for SE.
415
The thicknesses and optical properties of the layers were designed to position the absorption nearλ= 280 nm, at which many protein-based materials absorb the light. The λ and θ position of the absorption peak can be controlled by multilayer design, offering opportunities for high-selectivity measurements. The spectral distributions of ˆn for glycerol and Fgn were determined for a spectral
420
range ofλ= 200−1690 nm and used in KRSE configuration to reveal a detection limit of 10−5and below 45 pg/mm2in terms ofn(glycerol as bulk medium) and surface mass density (Fgn layer). The optical modeling capability of SE was pointed out extending the sensing features with quantitative multiparameter measurement of complex structures. The SE configuration of this experiment
425
was capable of achieving a lateral and temporal resolution of ≈0.5 mm and
≈3 s, respectively. It was shown that imperfections such as the depolarization caused by the focusing as well as the surface nanoroughness have a large effect on the measurement and the sensitivity, and therefore must be included in the optical model. The main advantages of the BMS-SE approach are (1) the
430
tunable resonance wavelength, (2) the larger selection of interface materials most suitable for the chemistry of the investigated process, (3) and its smaller sensitivity to the surface nanoroughness.
Acknowledgments
Support from National Development Agency grants of OTKA K131515 and
435
2019-2.1.11-TET-2019-00004 is gratefully acknowledged.
References
[1] P. Kozma, F. Kehl, E. Ehrentreich-F¨orster, C. Stamm, F. Bier, Biosensors and Bioelectronics 58 (2014) 287–307. doi:10.1016/j.bios.2014.02.049.
[2] K. Hinrichs, K.-J. Eichhorn, Ellipsometry of Functional Organic Surfaces
440
and Films, Springer Series in Surface Sciences 52, 2nd ed. ed., Springer International Publishing, 2018.
[3] J. Homola, Chemical reviews 108 (2008) 462–93. doi:10.1021/cr068107d.
[4] E. Wijaya, C. Lenaerts, S. Maricot, J. Hastanin, S. Habraken, J. Vilcot, R. Boukherroub, S. Szunerits, Current Opinion in Solid State and Mate-
445
rials Science - CURR OPIN SOLID STATE MAT SCI 15 (2011) 208–224.
doi:10.1016/j.cossms.2011.05.001.
[5] E. Kretschmann, H. Raether, Zeitschrift f¨ur Naturforschung A 23 (1968) 615–617. doi:10.1515/zna-1968-0424.
[6] B. Kalas, J. Nador, E. Agocs, A. Saftics, S. Kurunczi, M. Fried, P. Petrik,
450
Applied Surface Science (2017) S0169433217310802. URL: http://doi.
org/10.1016/j.apsusc.2017.04.064. doi:10.1016/j.apsusc.2017.04.
064.
[7] M. Svedendahl, R. Verre, M. K¨all, Light: Science & Applications 3 (2014) e220. doi:10.1038/lsa.2014.101.
455
[8] R. M. A. Azzam, N. M. Bashara, Ellipsometry and Polarized Light, 1977.
[9] H. Arwin, Sensors and Actuators A: Physical 92 (2001) 43–51. doi:10.
1016/S0924-4247(01)00538-6.
[10] M. Poksinski, H. Arwin, Sensors and Actuators B: Chemical 94 (2003) 247–252. doi:10.1016/S0925-4005(03)00382-4.
460
[11] H. Arwin, M. Poksinski, K. Johansen, Applied optics 43 (2004) 3028–36.
doi:10.1364/AO.43.003028.
[12] I. De Leon, P. Berini, Phys. Rev. B 78 (2008). doi:10.1103/PhysRevB.78.
161401.
[13] X. Li, J. Zhu, B. Wei, Chem. Soc. Rev. 45 (2016) 3145–3187. URL:http:
465
//dx.doi.org/10.1039/C6CS00195E. doi:10.1039/C6CS00195E.
[14] Q. Ouyang, S. Zeng, L. Jiang, L. Hong, G. Xu, X.-Q. Dinh, J. Qian, S. He, J. Qu, P. Coquet, K.-T. Yong, Scientific Reports 6 (2016) 28190. URL:
http://doi.org/10.1038/srep28190. doi:10.1038/srep28190.
[15] G. Nenninger, P. Tobiˇska, J. Homola, S. Yee, Sensors and Actua-
470
tors B: Chemical 74 (2001) 145–151. URL: http://doi.org/10.1016/
s0925-4005%2800%2900724-3. doi:10.1016/s0925-4005(00)00724-3.
[16] J.-Y. Jing, Q. Wang, W.-M. Zhao, B.-T. Wang, Optics and Lasers in En- gineering 112 (2019) 103–118. doi:10.1016/j.optlaseng.2018.09.013.
[17] P. Yeh, A. Yariv, A. Cho, Applied Physics Letters 32 (1978). doi:10.1063/
475
1.89953.
[18] F. Villa, L. E. Regalado, F. Ramos-Mendieta, J. Gaspar, T. Lopez-R´ıos, Optics letters 27 (2002) 646–8. doi:10.1364/OL.27.000646.
[19] V. Konopsky, E. Alieva, Analytical chemistry 79 (2007) 4729–35. doi:10.
1021/ac070275y.
480
[20] V. Paeder, V. Musi, L. Hvozdara, S. Herminjard, H. Herzig, Sen- sors and Actuators B: Chemical 157 (2011) 260 – 264. URL: http:
//www.sciencedirect.com/science/article/pii/S0925400511002565.
doi:https://doi.org/10.1016/j.snb.2011.03.060.
[21] A. Sinibaldi, A. Anopchenko, R. Rizzo, N. Danz, P. Munzert, P. Rivolo,
485
F. Frascella, S. Ricciardi, F. Michelotti, Analytical and bioanalytical chem- istry 407 (2015). doi:10.1007/s00216-015-8591-8.
[22] A. Sinibaldi, C. Sampaoli, N. Danz, P. Munzert, L. Sibilio, F. Sonntag, A. Occhicone, E. Falvo, E. Tremante, P. Giacomini, F. Michelotti, Biosen- sors and Bioelectronics 92 (2017). doi:10.1016/j.bios.2017.02.012.
490
[23] A. Occhicone, A. Sinibaldi, F. Sonntag, P. Munzert, N. Danz, F. Michelotti, Sensors and Actuators B: Chemical 247 (2017) 532 – 539. URL: http:
//www.sciencedirect.com/science/article/pii/S0925400517304586.
doi:https://doi.org/10.1016/j.snb.2017.03.041.
[24] W. Kong, Z. Zheng, Y. Wan, S. Li, J. Liu, Sensors and Actuators
495
B: Chemical 193 (2014) 467 – 471. URL: http://www.sciencedirect.
com/science/article/pii/S0925400513014512. doi:https://doi.org/
10.1016/j.snb.2013.11.101.
[25] H. Inan, M. Poyraz, F. Inci, M. Lifson, M. Baday, B. Cunningham, U. Demirci, Chemical Society reviews 46 (2016). doi:10.1039/c6cs00206d.
500
[26] A. Sinibaldi, N. Danz, E. Descrovi, P. Munzert, U. Schulz, F. Sonntag, L. Dominici, F. Michelotti, Sensors and Actuators B:
Chemical 174 (2012) 292 – 298. URL: http://www.sciencedirect.
com/science/article/pii/S0925400512006958. doi:https://doi.org/
10.1016/j.snb.2012.07.015.
505
[27] N. Brestrich, M. R¨udt, D. B¨uchler, J. Hubbuch, Chemical Engineer- ing Science 176 (2018) 157 – 164. URL: http://www.sciencedirect.
com/science/article/pii/S0009250917306462. doi:https://doi.org/
10.1016/j.ces.2017.10.030.
[28] I. Tanabe, Y. Y. Tanaka, K. Watari, T. Hanulia, T. Goto, W. Inami,
510
Y. Kawata, Y. Ozaki, Scientific Reports 7 (2017) 1.
[29] Y. Guti´errez, R. Alcaraz de la Osa, D. Ortiz, J. Saiz, F. Gonz´alez, F. Moreno, Applied Sciences 8 (2018). doi:10.3390/app8010064.
[30] W. G. Yasmineh, Clinical Biochemistry 21 (1988) 239 – 243. URL:http:
//www.sciencedirect.com/science/article/pii/S0009912088800079.
515
doi:https://doi.org/10.1016/S0009-9120(88)80007-9.
[31] F. Schmid, Biological Macromolecules: UV-visible Spectrophotometry, 2001. doi:10.1038/npg.els.0003142.
[32] J. Nador, B. Kalas, A. Saftics, E. Agocs, P. Kozma, L. Korosi, I. Szekacs, M. Fried, R. Horvath, P. Petrik, Opt Express 24 (2016) 4812–4823.
520
[33] J. Mor´e, Proceedings of the 1977 Dundee conference on numerical analysis 630 (1978) 630–668.
[34] P. Hausler, C. Genslein, C. Roth, T. Vitzthumecker, T. Hirsch, R. Bierl, pp. 63–66.
[35] H. W. Lehmann, K. Frick, Applied Optics 27 (1988). doi:10.1364/AO.27.
525
004920.
[36] E. A. Irene, M. Losurdo, K. Hingerl, Ellipsometry at the Nanoscale, 1 ed., Springer-Verlag Berlin Heidelberg, 2013.
[37] J. N. Hilfiker, B. Pietz, B. Dodge, J. Sun, N. Hong, S. Schoeche, Applied Surface Science 421 (2017) 500–507. doi:10.1016/j.apsusc.2016.09.154.
530
[38] D. W. Lynch, W. Hunter, in: E. D. PALIK (Ed.), Hand- book of Optical Constants of Solids, Academic Press, Boston, 1998, p. 341. URL: http://www.sciencedirect.com/science/
article/pii/B9780080556307500183. doi:https://doi.org/10.1016/
B978-0-08-055630-7.50018-3.
535
[39] M. Qing-Qing, Z. Xin, L. Cheng-You, C. Shu-Jing, D. Ying-Chun, C. Zhao- Yang, Sensors 17 (2017) 1846. doi:10.3390/s17081846.
[40] S. Kurunczi, A. N´emeth, T. H¨ulber, P. Kozma, P. Petrik, H. Jankovics, A. Sebesty´en, F. Vonderviszt, M. Fried, I. B´arsony, Applied Surface Science 257 (2010) 319–324. URL:http://doi.org/10.1016/j.apsusc.2010.06.
540
095. doi:10.1016/j.apsusc.2010.06.095.
[41] P. Kozma, D. Kozma, A. Nemeth, H. Jankovics, S. Kurunczi, R. Hor- vath, F. Vonderviszt, M. Fried, P. Petrik, Applied Surface Science 257 (2011) 7160–7166. URL: https://linkinghub.elsevier.com/retrieve/
pii/S0169433211004454. doi:10.1016/j.apsusc.2011.03.081.
545
[42] D. De Sousa Meneses, G. Gruener, M. Malki, P. Echegut, Journal of Non- Crystalline Solids 351 (2005) 0–129. URL: http://doi.org/10.1016/j.
jnoncrysol.2004.09.028. doi:10.1016/j.jnoncrysol.2004.09.028.
[43] Z. Adamczyk, Current Opinion in Colloid & Interface Science 17 (2012).
doi:10.1016/j.cocis.2011.12.002.
550
[44] J. A. De Feijter, J. Benjamins, F. A. Veer, Biopolymers 17 (1978). doi:10.
1002/bip.1978.360170711.
[45] M. Malmsten, Journal of Colloid and Interface Science 166 (1994) 333 – 342. doi:https://doi.org/10.1006/jcis.1994.1303.
[46] F. H¨o¨ok, J. V¨or¨os, M. Rodahl, R. Kurrat, P. B¨oni, J. Ramsden, M. Tex-
555
tor, N. Spencer, P. Tengvall, J. Gold, B. Kasemo, Colloids and Sur- faces B: Biointerfaces 24 (2002) 155 – 170. doi:ttps://doi.org/10.1016/
S0927-7765(01)00236-3.
[47] M. M. Santore, C. F. Wertz, Langmuir 21 (2005) 10172–10178.
Figure 1: Cell design, layer structure and distribution of the electric field at the angle of incidence of 74◦(A). Intensity of the electric field together with depolarization at the interface to the liquid (B) is also shown calculated by the transfer matrix method (TMM) and the finite element method (FEM).
Figure 2: Ψ and ∆ spectra of BMS (A) measured from the front-side (layer-side) of the FS slide at differentθvalues shown in the inset. The depolarization from the reflection measurement and the transmission intensity (C) are also plotted. All the lines present calculated values.
The optical model with the fit parameters and a transmission electron microscopy (TEM) picture of the structure are also included (B). In graph (D) the calculated optical properties of SiO2and ZrO2 are presented with ˆnof water used for the simulations.
Figure 3: Fitted spectra for thin Au layer, solid lines represent the calculated values. In the insets the fitted transmission spectra and the used optical model are included, from left to right, respectively.
Figure 4: Absorption characteristics of Fgn measured spectrophotometry (A) and SE (B).
The inset in A shows the schematic arrangement of the spectrophotometric measurement.
Figure 5: The schematic arrangement for an ellipsometric measurement in the Kretschmann- Raether configuration utilizing BMS-SE and SPR-SE (A). (B) Typical measured Ψ and ∆ spectra for both BMS-SE (red symbols) and SPR-SE (blue symbols). The solid lines show fitted values by using the optical models presented in the insets (left hand-side). (C) tan(Ψ), i.e.|rp/rs|, measured on the BMS (left hand-side) and Au (right hand-side) layer in the whole wavelength range in the Kretschmann-Raether configuration. The inset in BMS-SE shows the spectra closer to the BMS resonance wavelength.
Figure 6: Spectra measured using SPR-SE (A) and BMS-SE (B) during step-wise increase of the glycerol concentration. Graph (C) shows nof glycerol solutions measured by RM.
In graphs (D, E) the optical properties of these glycerol solutions are shown measured both on BMS-SE and SPR-SE. In graph (F) the position shift of Ψ dip divided by the full-width at half maximum is presented for each concentration. In graphs (A) and (B) the different concentrations are denoted by numbers from 1 to 7 with increasing concentration (DI water
= 1).
Figure 7: Changes in ∆ in absolute values during the circulation of the glycerol. (A) is for demonstrating the absolute value change between samples ’5’→’6’ and ’6’→’7’. The time evolution of ∆ is presented at wavelength values of 281.6 nm and 288.0 nm for BMS-SE (red color) and at 821.2 nm and 867.2 nm for SPR-SE (blue color), respectively. The yellow bands show the ranges where transitions occur between the solutions. (B) represents the maxima of absolute changes in ∆ for both BMS-SE and SPR-SE at the most sensitive wavelengths. In (B) solid lines are plotted to guide the eyes.
Figure 8: Ψ and ∆ changes (A and B, respectively) in time during Fgn adsorption for both layer structures in the Kretschmann-Raether configuration. The complex refractive index ˆ
n=n+ ikof Fgn from reflection measurement is shown in graph (C) whereas the calculated surface mass density (SMD) curves are presented in graph (D), .
Figure 9: Calculated (A,B) and measured (C,D) sensitivity-maps for bulkn(A, C) and ΓF gn
of Fgn (B,D) in refractive index unit (RIU) and ng/mm2, respectively. The smallest values in the simulated maps of (A) and (B) are 1.23·10−6RIU and 6.7 pg/mm2, respectively, whereas the measurements reveal best values of 6.55·10−6RIU and 10.4 pg/mm2in the graphs of (C) and (D), respectively.
1 HIGHLIGHTS
- Surface enhanced measurement of protein adsorption with a variable resonant wavelength
- Bragg structure for adsorption measurements with enhanced sensing at the wavelength of 280 nm
- Realization of Kretschmann-Raether ellipsometry utilizing the deep-ultraviolet absorption
- Resonance position can be adjusted for enhanced selectivity
- Verification of the optical model by a spectroscopic ellipsometry fit
- Quantitative spectroscopy combined with high-sensitivity sensing
CRediT authorship contribution statement
B. Kalas: conceptualization, methodology, validation, formal analysis, investigation, data
curation, writing - original draft, writing - review and editing, visualization. K. Ferencz:
conceptualization, methodology, validation, formal analysis, investigation, resources. A.
Saftics: methodology, investigation, resources. Z. Czigany: methodology, investigation. M.
Fried: resources, project administration, funding acquisition. P. Petrik: conceptualization,
methodology, resources, writing - original draft, writing - review and editing, supervision,
project administration, funding acquisition.
Declaration of interests
☒The authors declare that they have no known competing financial interests or personal relationships that could have appeared to influence the work reported in this paper.
☐The authors declare the following financial interests/personal relationships which may be considered as potential competing interests:
Graphical Abstract