Soldering & Surface Mount Technology
Numerical Investigation on the Effect of Solder Paste Rheological Behaviour and Printing Speed on Stencil
Printing
Journal: Soldering & Surface Mount Technology Manuscript ID SSMT-11-2019-0037.R1
Manuscript Type: Research Paper
Keywords: stencil printing, numerical modelling, suspension rheology, non- Newtonian material models
Soldering & Surface Mount Technology
Numerical Investigation on the Effect of Solder Paste Rheological Behaviour and Printing Speed on Stencil PrintingStructured abstract:
Purpose
Purpose of this paper was to investigate the effect of different viscosity models (Cross and Al-Ma’aiteh) and different printing speeds on the numerical results (e.g., pressure over stencil) of a numerical model regarding stencil printing.
Design/methodology/approach
A finite volume model was established for describing the printing process. Two types of viscosity models for non-Newtonian fluid properties were compared. The Cross model was fitted to the measurement results in the initial state of a lead-free solder paste, and the parameters of a Al-Ma’aiteh material model were fitted in the stabilised state of the same paste. Four different printing speeds were also investigated from 20 to 200 mm/s.
Findings
Noteworthy differences were found in the pressure between utilising the Cross model and the Al-Ma’aiteh viscosity model. The difference in pressure reached 33–34% for both printing speeds of 20 and 70 mm/s, and reached 31% and 27% for the printing speed of 120 and 200 mm/s. The variation in the difference was explained by the increase in the rates of shear by increasing printing speeds.
Originality/value
Parameters of viscosity model should be determined for the stabilised state of the solder paste. Neglecting the thixotropic paste nature in the modelling of printing can cause a calculation error of even ~30%. By using the Al-Ma’aiteh viscosity model over the stabilised state of solder pastes can provide more accurate results in the modelling of printing, which is necessary for the effective optimisation of this process, and for eliminating soldering failures in highly integrated electronic devices.
Keywords: stencil printing; numerical modelling; suspension rheology; non-Newtonian material models 3
4 5 6 7 8 9 10 11 12 13 14 15 16 17 18 19 20 21 22 23 24 25 26 27 28 29 30 31 32 33 34 35 36 37 38 39 40 41 42 43 44 45 46 47 48 49 50 51 52 53 54 55
Soldering & Surface Mount Technology
1. Introduction The stencil printing is one the most widespread technique for depositing the solder paste onto the printed circuit board in reflow soldering technology. This is probably one of the most critical processes in this technology; many of the reflow soldering failures (50–60%) can be originated from the printing failures, as demonstrated by Tsai (2008).The yield of this process depends on the process parameters on the one hand, like printing velocity, squeegee pressure, or the stencil cleaning frequency, as investigated by Huang (2018) and by Yu et al. (2019). The optimisation of the respective process parameters is absolutely critical, which can be carried out by empirical methods, by numerical modelling, or even by utilising machine learning techniques like in the paper of Martinek (2019). Nevertheless, numerical models have been established by discarding important factors like the thixotropic behaviour of solder pastes. The solder paste is a dense suspension of solid particles and the flux with a 50% in V/V%. Therefore, it exhibits both non-Newtonian and thixotropic properties in viscosity. This means, on the one hand, that the apparent viscosity of solder pastes changes significantly by the change in the rate of shear, i.e., at different printing velocities. On the other hand, the thixotropic behaviour yields changes in viscosity between the printing cycles. These phenomena should absolutely be considered in the modelling approaches.
The non-Newtonian behaviour of solder pastes has extensively been investigated by many researchers. Barbosa et al. (2019) et al. analysed the rheological behaviour of lead- free solder pastes and also the flux in them separately. They found that the flux itself also exhibits non-Newtonian behaviour. So the non-Newtonian behaviour of solder pastes originates not just from the pastes’ suspension nature but from the properties of the
3 4 5 6 7 8 9 10 11 12 13 14 15 16 17 18 19 20 21 22 23 24 25 26 27 28 29 30 31 32 33 34 35 36 37 38 39 40 41 42 43 44 45 46 47 48 49 50 51 52 53 54
Soldering & Surface Mount Technology
respective flux too. Pietriková and Kravcik (2012) demonstrated the thixotropic behaviour of solder pastes by measuring the viscosity of lead-free solder pastes over time at a constant rate of shear. Besides, Pietriková and Kravcik (2011) found also that the thixotropic index depends on the metal content in the solder paste. This index increased with increasing metal content; it was more pronounced for solder pastes intended for stencil printing. Vachaparambil et al. (2018) also characterised the rheological and thixotropic behaviour of solder pastes based on structure kinetics. They showed that during the idle time in stencil printing, there is a structure build-up in the solder paste, which increases its viscosity. The idle time in stencil printing originates from the board transport (and stencil cleaning by chance) between individual print strokes, and its length is in the range between 15 s and 60 s. The thixotropic behaviour of solder pastes was also investigated by Krammer et al. (2018a). They measured the viscosity curve of lead-free solder pastes over the rate of shear in a sequence, where a pause (15 s, 30 s, and 60 s) was inserted between the measurement cycles, thus addressing the idle time in the process of stencil printing. They showed that there were differences in viscosity between the initial state and stabilised state of solder pastes, where the initial state related to the first stencil printing cycle, and the stabilised state was reached only after some (5–6) printing strokes.In the numerical modelling of the stencil printing process, Glinski et al. (2001) analysed the effect of utilising non-Newtonian fluid behaviour on the numerical results.
Thakur et al. (2015) also established a CFD model, including non-Newtonian fluid properties, for investigating the flow of solder pastes into the stencil apertures during printing. In these works, and also similarly in the works of Durairaj et al. (2002) and Clements et al. (2007), the necessity of using non-Newtonian fluid properties instead of
3 4 5 6 7 8 9 10 11 12 13 14 15 16 17 18 19 20 21 22 23 24 25 26 27 28 29 30 31 32 33 34 35 36 37 38 39 40 41 42 43 44 45 46 47 48 49 50 51 52 53 54 55
Soldering & Surface Mount Technology
Newtonian one in the modelling of stencil printing was emphasized. They utilised the Cross material model, presented, e.g., in the book by Ferguson and Kemblowski (1991) for describing the fluid properties. However, al the mentioned authors fitted the Cross model parameters to a viscosity curve measured in the initial state of solder pastes.Krammer et al. (2018a) showed that the initial state of solder pastes (during the first print), the Cross model can follow the viscosity curve. But in their stabilised state (after some 5–6 print strokes), the Cross model has a high error at low shear-rates because the shape of the viscosity curve is also affected by the thixotropic behaviour of solder pastes;
actually the curve of the viscosity – as a function of the rate of shear – changes from a decaying exponent to an inversed sigmoid like function.
Consequently, a new viscosity model should be applied in the numerical modelling of stencil printing, which can address the viscosity curve of solder pastes in their stabilised state. Besides, the effect of different viscosity models on the numerical results should be evaluated at different printing velocities to address the whole range of shear rates, which can take place in stencil printing.
3 4 5 6 7 8 9 10 11 12 13 14 15 16 17 18 19 20 21 22 23 24 25 26 27 28 29 30 31 32 33 34 35 36 37 38 39 40 41 42 43 44 45 46 47 48 49 50 51 52 53 54
Soldering & Surface Mount Technology
2. Materials and methods The transfer efficiency of the stencil printing (ratio of the deposited paste volume to the respective aperture volume) depends on several factors, like the rheology of the solder paste, manufacturing technology of the stencil (chemical etching, laser-cutting, electroforming), size of the aperture within the stencil and the process parameter of stencil printing. The latter includes the specific printing force along the squeegee length (typically 0.3 N/mm), the printing speed, the snap-off distance and the speed of stencil separation. In this paper, we focused on the effects of printing speed and solder paste rheology on the pressure along with the stencil, which implies static modelling for the investigation.The numerical model of the stencil printing was built according to the paper of Krammer and Dušek (2019). The geometry of the finite volume model included the loaded angle of the printing squeegee of 53°. This value was found by Krammer et al.
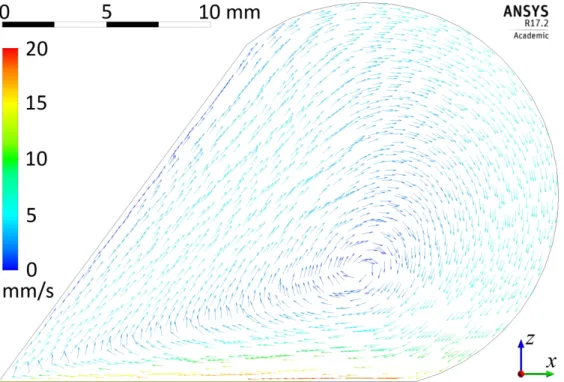
(2018b) being the actual attack angle for a squeegee with an unloaded angle of 60°, and for the widely used specific printing force of 0.3 N/mm. A no-slip wall boundary condition was set both to the squeegee and the stencil, whereas a free-slip boundary condition was utilised at the paste-air interface. Considering an opposite frame of reference, the stencil was traveling in the opposite direction to the squeegee with the printing speed. The investigated printing speeds were 20, 70, 120, 200 mm/s. By this printing angle, and these printing speeds, the roll of the solder paste was ensured in the modelling, like in our previous work (Krammer, 2019b), as illustrated in Fig. 1.
Fig. 1. Velocity field in the rolling solder paste – printing speed is 20 mm/s (Krammer, 2019b) 3
4 5 6 7 8 9 10 11 12 13 14 15 16 17 18 19 20 21 22 23 24 25 26 27 28 29 30 31 32 33 34 35 36 37 38 39 40 41 42 43 44 45 46 47 48 49 50 51 52 53 54 55
Soldering & Surface Mount Technology
The solder paste was considered being a homogenous, incompressible fluid, with non-Newtonian properties in the modelling. For incompressible fluids, the mass continuity law simplifies to the volume continuity equation (1), as presented in the work of Illés et al. (2016):(1)
u 0
where u is the flow velocity.
The range of the printing speeds and the fluid properties implies that the Reynolds number is much lower than 1. This indicates that the Stokes flow equation (2) can describe the state of the system in steady-state, as shown by Constantinscu (1995).
2 (2)
p µ u f
where p is the pressure, u is the flow velocity, µ is the dynamic viscosity, and f represents body accelerations acting on the continuum. The f is zero in our case.
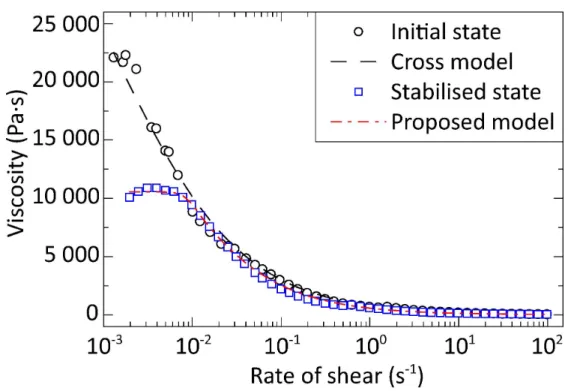
In the modelling, two types of viscosity models for non-Newtonian fluid properties were compared. On the one hand, the Cross model (3) was fitted to a viscosity curve measured in the initial state of a Type-4 solder paste (particle size is 20–38 µm). On the other hand, the parameters of the Al-Ma’aiteh viscosity model (4), which is proposed in the work of Al-Ma’aiteh (2019), were fitted to a viscosity curve measured in the stabilised state of the same solder paste.
0 (3)0 _ 0 _ 0
1 0
Cross n
&
3 4 5 6 7 8 9 10 11 12 13 14 15 16 17 18 19 20 21 22 23 24 25 26 27 28 29 30 31 32 33 34 35 36 37 38 39 40 41 42 43 44 45 46 47 48 49 50 51 52 53 54
Soldering & Surface Mount Technology
(4)
1
2
0 _1 _1 0 _ 2 _ 2
1
2 1
( ) (1 )( ) where 1 if
1 0 if 1
t
a n n
a a t
& &
&
& &
&
&
where ηCross and ηa are the apparent viscosity by the Cross and the Al-Ma’aiteh model, η0_i and η∞_i are the asymptotic viscosity values belonging to zero and infinite rates of shear, respectively, λi are time constants, is the rate of shear, & ni are dimensionless exponents, and β is a weighting parameter depending on &t. The measurement results and the fitted curves are illustrated in Fig. 2., whereas the parameters obtained by the fitting were as follows:where η0_0 = 44 500, η0_1 = 10 560, η0_2 = 31 500 Pa·s, η∞_0 = 19, η∞_1 = 24, η∞_2 = 30, λ0 = 730, λ1 = 110, λ2 = 340, n0 = 0.61, n1 = 0.36, n2 = 0.69, a = 7.
The modelling was performed in Ansys Fluent, and the different material models were implemented via user-defined functions (UDF). The calculations were executed up to 110 iterations, and the pressure profiles over the stencil were captured for the different material models and printing speeds.
Fig. 2. Viscosity curves and fitted material models for describing the solder paste rheological behaviour
3 4 5 6 7 8 9 10 11 12 13 14 15 16 17 18 19 20 21 22 23 24 25 26 27 28 29 30 31 32 33 34 35 36 37 38 39 40 41 42 43 44 45 46 47 48 49 50 51 52 53 54 55
Soldering & Surface Mount Technology
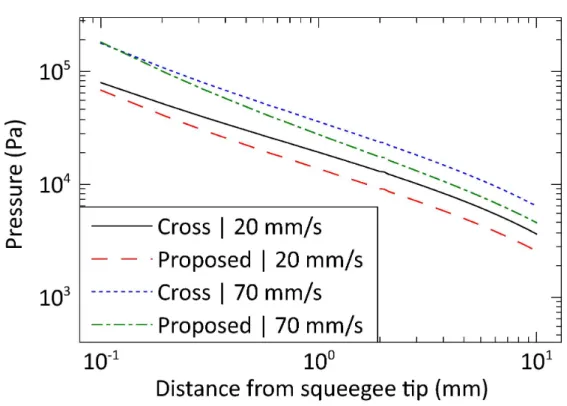
Results and discussion The properties of the flow field, depending on the various input parameters (viscosity model, printing speed) can be characterised mainly with the pressure over the stencil.This parameter significantly affects, for example, the hole-filling by the solder paste in pin-in-paste technology. The pressure profiles for the printing speeds of 20 mm/s and 70 mm/s are illustrated in Fig. 3.
Fig. 3. Pressure profile over the stencil for printing speeds of 20 mm/s and 70 mm/s, respectively
Generally, a significant difference was found in the pressure profile between utilising the Cross model and the Al-Ma’aiteh viscosity model. Though the difference in pressure was low in the proximity of the squeegee tip (place of contact between the squeegee and the stencil), it was increasing gradually as proceeding farther on the stencil. The difference in pressure at the 10 mm distance from the squeegee tip reached 33–34% for both printing speeds of 20 mm/s and 70 mm/s, respectively.
The shape of the pressure profiles over the stencil was also similar for the printing speeds of 120 mm/s and 200 mm/s. The corresponding results are illustrated in Fig. 4.
Fig. 4. Pressure profile on the stencil for printing speeds of 20 mm/s and 70 mm/s, respectively
The differences in the pressure between the Cross and the Al-Ma’aiteh viscosity models were slightly lower in these cases. At the 10 mm distance from the squeegee tip, the differences took the value of 31% and 27% for the printing speed of 120 mm/s and 200 mm/s. For visualising the effect of the printing speed on the pressure over the stencil,
3 4 5 6 7 8 9 10 11 12 13 14 15 16 17 18 19 20 21 22 23 24 25 26 27 28 29 30 31 32 33 34 35 36 37 38 39 40 41 42 43 44 45 46 47 48 49 50 51 52 53 54
Soldering & Surface Mount Technology
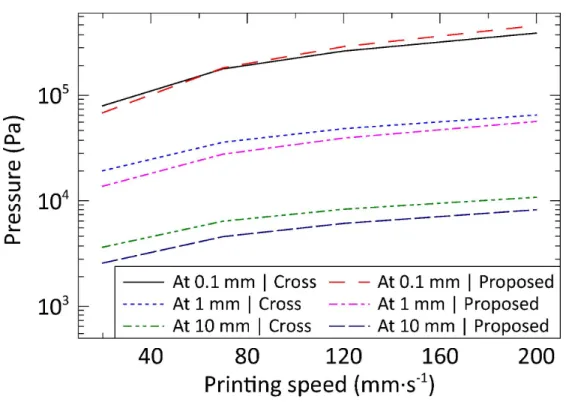
the values of pressure are captured at the specific distances from the squeegee tip of 0.1 mm, 1 mm, and 10 mm (Fig. 5).Fig. 5. The pressure at the specific distance of 0.1 mm, 1 mm, and 10 mm for the Cross and the Al- Ma’aiteh viscosity models
The variation of the difference in pressure profile over the stencil, i.e., smaller difference closer to the squeegee tip, can be explained by analysing the rate of shear and the respective viscosity within the solder paste. It should be noted that the pressure on the stencil at a specific location depends on the squeegee angle (which is fixed), on the printing speed and on the viscosity of the solder paste, according to the analytical model by Riemer (1988). In that model, the viscosity was considered being constant, but utilising non-Newtonian fluid properties, the viscosity will depend on the rate of shear.
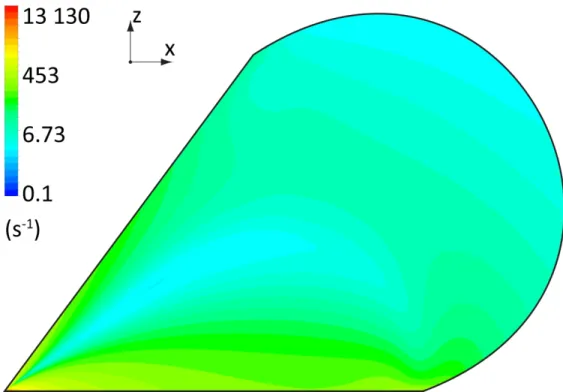
Typically, much larger rates of shear can be found closer to the squeegee tip, where the rotating solder paste turns up and back from the stencil to the squeegee. Contrary, much lower rates of shear can be found farther from the squeegee; at the paste-air interface, its value can approach zero. By analysing the viscosity curve of the investigated solder paste (Fig. 2), one can observe that the difference in the measured viscosity is much larger for low rates of shear than that for larger rates of shear. This yields that the difference in the numerical results will be lower at the places, where higher rates of shear exist, i.e., in the proximity of the squeegee tip. The spatial distribution of the shear rates within the solder paste is illustrated in Fig. 6. The smallest and the largest values of the shear rates were 0.1 s-1 and 1 800 s-1, respectively, for a printing speed of 20 mm/s.
Fig. 6. Rates of shear within the solder paste for the printing speed of 20 mm/s 3
4 5 6 7 8 9 10 11 12 13 14 15 16 17 18 19 20 21 22 23 24 25 26 27 28 29 30 31 32 33 34 35 36 37 38 39 40 41 42 43 44 45 46 47 48 49 50 51 52 53 54 55
Soldering & Surface Mount Technology
The variation of the difference in pressure as a function of printing speed can be explained in the same manner. By increasing the printing speeds, the rates of shear within the solder paste are also increasing. This yields that the range of the viscosity values within the solder paste proceeds gradually toward lower values (the range shifts to the left in Fig. 2), where the difference in the viscosity is smaller between the Cross and the Al- Ma’aiteh viscosity model. The spatial distribution of the shear rates within the solder paste is illustrated in Fig. 7. The smallest and the largest values of the shear rates were~1.7 s-1 and 18 100 s-1, respectively, for a printing speed of 200 mm/s.
Fig. 7. Rates of shear within the solder paste for the printing speed of 200 mm/s
To sum up, the numerical results, i.e., the pressure over the stencil depends significantly on the utilised viscosity models and the respective parameters. By using viscosity model parameters, which were determined in the stabilised state of the solder paste, can result in a calculation error of even ~30%. The overview of the parameters, which describe the solder paste flow, are collected in Table. 1., for the different viscosity models and for different printing speeds.
3 4 5 6 7 8 9 10 11 12 13 14 15 16 17 18 19 20 21 22 23 24 25 26 27 28 29 30 31 32 33 34 35 36 37 38 39 40 41 42 43 44 45 46 47 48 49 50 51 52 53 54
Soldering & Surface Mount Technology
Table 1. Overview of the parameters describing the flow of the solder paste in the case of the different viscosity modelsSpeed 20 mm·s-1 70 mm·s-1 120 mm·s-1 200 mm·s-1
Model Cross Prop. Cross Prop. Cross Prop. Cross Prop.
Min shear rate
(s-1) 0.09 0.11 0.43 0.51 0.81 1.02 1.46 1.89
Max shear
rate (s-1·103) 1.79 1.81 6.30 6.34 10.8 10.9 18.1 18.1 Min viscosity
(Pa·s) 27.3 33.2 22.8 31.3 21.8 30.9 21.0 30.6
Max viscosity
(kPa·s) 3.08 2.39 1.31 0.91 0.90 0.58 0.64 0.39
Pressure at
10 mm (kPa) 3.6 2.6 6.4 4.6 8.3 6.1 10.8 8.2
Rel. diff. 34% 33% 31% 27%
3 4 5 6 7 8 9 10 11 12 13 14 15 16 17 18 19 20 21 22 23 24 25 26 27 28 29 30 31 32 33 34 35 36 37 38 39 40 41 42 43 44 45 46 47 48 49 50 51 52 53 54 55
Soldering & Surface Mount Technology
ConclusionThe effect of the different viscosity models and different printing speeds on the numerical modelling of stencil printing has been investigated. Significant differences (up to 34%) in the pressure profile were observed between utilising the Cross viscosity model (parameters obtained in the initial state of solder paste) and the Al-Ma’aiteh model (parameters obtained in the stabilised state of solder paste). By the differences, it was proven that the parameters of the viscosity model should be determined for the stabilised state of the solder paste.
The early phase of product design can be aided by investigating the manufacturing processes with numerical methods. For these cases, the following procedure is recommended: a) measure the rheological curve of solder pastes in their stabilised state down to at least the rate of shear of 0.01 (see min shear rate in Table 1.); b) utilise an appropriate squeegee attack angle based on its overhang size and unloaded angle; c) fit a correct material model to the viscosity curve over the whole range of shear rate; d) include the geometry of the most critical components, .e.g., fine-pitch integrated circuits or through-hole for pin-in-paste technology; e) if pin-in-paste technology applies, perform calculation over the range of printing speeds to find the optimal one for a given solder paste hole-filling. Addressing the effect of dynamic parameters, e.g., the stencil separation speed in numerical investigation, can also be carried out more precisely by taking the recommendation about the use of correct viscosity models of solder pastes.
Obtaining accurate and precise numerical results in the modelling of stencil printing is absolutely necessary for the effective optimisation of this process, and for eliminating
3 4 5 6 7 8 9 10 11 12 13 14 15 16 17 18 19 20 21 22 23 24 25 26 27 28 29 30 31 32 33 34 35 36 37 38 39 40 41 42 43 44 45 46 47 48 49 50 51 52 53 54
Soldering & Surface Mount Technology
accurate numerical models by utilising the presented viscosity model can also aid the design optimisation even in the early phase of product design.3 4 5 6 7 8 9 10 11 12 13 14 15 16 17 18 19 20 21 22 23 24 25 26 27 28 29 30 31 32 33 34 35 36 37 38 39 40 41 42 43 44 45 46 47 48 49 50 51 52 53 54 55
Soldering & Surface Mount Technology
ReferencesAl-Ma’aiteh, T.I. and Krammer, O. (2019), "Non-Newtonian numerical modelling of solder paste viscosity measurement", Solder. Surf. Mount. Technol., Vol. 31 No. 3, pp. 176-180.
Barbosa, F., Teixeira, J., Teixeira, S., Lima, R., Soares, D. and Pinho, D. (2019), "Rheology of F620 solder paste and flux", Solder. Surf. Mount. Technol., Vol. 31 No. 2, pp. 125-132.
Clements, D.J., Desmulliez, M.P.Y. and Abraham, E. (2007), "The evolution of paste pressure during stencil printing", Solder. Surf. Mount. Technol., Vol. 19 No. 3, pp. 9-14.
Constantinscu, V.N. (1995), Laminar viscous flow, New-York, Springer-Verlag, ISBN: 978-1- 4612-8706-3.
Durairaj, R., Jackson, G.J., Ekere, N.N., Glinski, G. and Bailey, C. (2002), "Correlation of solder paste rheology with computational simulations of the stencil printing process", Solder. Surf.
Mount. Technol., Vol. 14 No. 1, pp. 11-7.
Ferguson, J. and Kemblowski, Z. (1991), Applied Fluid Rheology, 1st edition, Springer Netherlands, ISBN: 978-1-85166-588-4
Glinski, G.P., Bailey, C. and Pericleous, K.A. (2001), "A non-Newtonian computational fluid dynamics study of the stencil printing process", P. I. Mech. Eng. C-J. Mec., Vol. 215 Issue 4, pp.
437-446.
Huang, C. (2018), "Applying the Taguchi parametric design to optimize the solder paste printing process and the quality loss function to define the specifications", Solder. Surf. Mount. Technol., Vol. 30 No. 4, pp. 217-226.
Illés, B., Géczy, A., Skwarek, A. and Busek, D. (2016), "Effects of substrate thermal properties on the heat transfer coefficient of vapour phase soldering", Int. J. Heat Mass Trans., Vol. 101, pp.
69-75.
Krammer, O., Gyarmati, B., Szilágyi, A., Illés, B., Bušek, D. and Dušek, K. (2018a), "The effect of solder paste particle size on the thixotropic behaviour during stencil printing", J. Mater.
Process. Tech., Vol. 262, pp. 571-576.
Krammer, O., Jakab, L., Illés, B., Bušek, D. and Pelikánová, I.B. (2018b), "Investigating the attack angle of squeegees with different geometries", Solder. Surf. Mount. Technol., Vol. 30 No. 2, pp.112-117.
3 4 5 6 7 8 9 10 11 12 13 14 15 16 17 18 19 20 21 22 23 24 25 26 27 28 29 30 31 32 33 34 35 36 37 38 39 40 41 42 43 44 45 46 47 48 49 50 51 52 53 54
Soldering & Surface Mount Technology
Krammer, O. and Dušek, K. (2019a), "Numerical investigation on the effect of the printing force and squeegee geometry on stencil printing", J. Manuf. Process., Vol. 45, pp. 188-193.Krammer, O., Al-Ma'aiteh, T. and Martinek, P. (2019b), "Investigating the Effect of Viscosity Models on the Stencil Printing by Numerical Modelling", Proceedings of the 2019 42nd International Spring Seminar on Electronics Technology (ISSE 2019), IEEE, Wroclaw, Poland, pp. 1-6.
Martinek, P. and Krammer, O. (2019), "Analysing machine learning techniques for predicting the hole-filling in pin-in-paste technology", Comput. Ind. Eng., Vol. 136, pp. 187-194.
Pietriková, A. and Kravcik, M. (2011), "Boundary value of rheological properties of solder paste", Proceedings of the 2011 34th International Spring Seminar on Electronics Technology (ISSE 2011), IEEE, Tratanska Lomnica, Slovakia, pp. 94-97.
Pietriková, A. and Kravcik, M. (2012), "Investigation of rheology behavior of solder paste", Proceedings of the 2012 35th International Spring Seminar on Electronics Technology (ISSE 2012), IEEE, Bad Aussee, Austria, pp. 138-143.
Riemer, D. (1988), "Analytical engineering model of the screen printing process: part I.", Solid State Technol., pp. 107–11.
Thakur, V., Mallik, S. and Vuppala, V. (2015), "CFD Simulation of Solder Paste Flow and Deformation Behaviours during Stencil Printing Process", Int. J. Recent Adv. Mech. Eng., Vol. 4 No. 1, pp. 1-13.
Tsai, T.N. (2008), "Modeling and optimization of stencil printing operations: a comparison study", Comput. Ind. Eng., Vol. 54 No. 3, pp. 374-89.
Vachaparambil, K., Mårtensson, G. and Essén, L. (2018), "Rheological characterization of non- Brownian suspensions based on structure kinetics", Solder. Surf. Mount. Technol., Vol. 30 No. 1, pp. 57-64.
Yu, J., Cao, L., Fu, H. and Guo, J. (2019), "A method for optimizing stencil cleaning time in solder paste printing process", Solder. Surf. Mount. Technol., Vol. 31 No. 4, pp. 233-239.
3 4 5 6 7 8 9 10 11 12 13 14 15 16 17 18 19 20 21 22 23 24 25 26 27 28 29 30 31 32 33 34 35 36 37 38 39 40 41 42 43 44 45 46 47 48 49 50 51 52 53 54 55
Soldering & Surface Mount Technology
Figure and table captionsFig. 1. Velocity field in the rolling solder paste – printing speed is 20 mm/s (Krammer, 2019b) Fig. 2. Viscosity curves and fitted material models for describing the solder paste rheological behaviour
Fig. 3. Pressure profile over the stencil for printing speeds of 20 mm/s and 70 mm/s, respectively Fig. 4. Pressure profile on the stencil for printing speeds of 20 mm/s and 70 mm/s, respectively Fig. 5. The pressure at the specific distance of 0.1 mm, 1 mm, and 10 mm for the Cross and the proposed viscosity models
Fig. 6. Rates of shear within the solder paste for the printing speed of 20 mm/s Fig. 7. Rates of shear within the solder paste for the printing speed of 200 mm/s
Table 1. Overview of the parameters describing the flow of the solder paste in the case of different viscosity models
3 4 5 6 7 8 9 10 11 12 13 14 15 16 17 18 19 20 21 22 23 24 25 26 27 28 29 30 31 32 33 34 35 36 37 38 39 40 41 42 43 44 45 46 47 48 49 50 51 52 53 54
Soldering & Surface Mount Technology
Fig. 1. Velocity field in the rolling solder paste – printing speed is 20 mm/s (Krammer, 2019b) 80x54mm (714 x 714 DPI)
3 4 5 6 7 8 9 10 11 12 13 14 15 16 17 18 19 20 21 22 23 24 25 26 27 28 29 30 31 32 33 34 35 36 37 38 39 40 41 42 43 44 45 46 47 48 49 50 51 52 53 54 55
Soldering & Surface Mount Technology
Fig. 2. Viscosity curves and fitted material models for describing the solder paste rheological behaviour 80x54mm (600 x 600 DPI)
3 4 5 6 7 8 9 10 11 12 13 14 15 16 17 18 19 20 21 22 23 24 25 26 27 28 29 30 31 32 33 34 35 36 37 38 39 40 41 42 43 44 45 46 47 48 49 50 51 52 53 54
Soldering & Surface Mount Technology
Fig. 3. Pressure profile over the stencil for printing speeds of 20 mm/s and 70 mm/s, respectively 80x55mm (600 x 600 DPI)
3 4 5 6 7 8 9 10 11 12 13 14 15 16 17 18 19 20 21 22 23 24 25 26 27 28 29 30 31 32 33 34 35 36 37 38 39 40 41 42 43 44 45 46 47 48 49 50 51 52 53 54 55
Soldering & Surface Mount Technology
Fig. 4. Pressure profile on the stencil for printing speeds of 20 mm/s and 70 mm/s, respectively 80x55mm (600 x 600 DPI)
3 4 5 6 7 8 9 10 11 12 13 14 15 16 17 18 19 20 21 22 23 24 25 26 27 28 29 30 31 32 33 34 35 36 37 38 39 40 41 42 43 44 45 46 47 48 49 50 51 52 53 54
Soldering & Surface Mount Technology
Fig. 5. The pressure at the specific distance of 0.1 mm, 1 mm, and 10 mm for the Cross and the proposed viscosity models
80x55mm (600 x 600 DPI)
3 4 5 6 7 8 9 10 11 12 13 14 15 16 17 18 19 20 21 22 23 24 25 26 27 28 29 30 31 32 33 34 35 36 37 38 39 40 41 42 43 44 45 46 47 48 49 50 51 52 53 54 55
Soldering & Surface Mount Technology
Fig. 6. Rates of shear within the solder paste for the printing speed of 20 mm/s 80x55mm (599 x 599 DPI)
3 4 5 6 7 8 9 10 11 12 13 14 15 16 17 18 19 20 21 22 23 24 25 26 27 28 29 30 31 32 33 34 35 36 37 38 39 40 41 42 43 44 45 46 47 48 49 50 51 52 53 54
Soldering & Surface Mount Technology
Fig. 7. Rates of shear within the solder paste for the printing speed of 200 mm/s 80x55mm (599 x 599 DPI)
3 4 5 6 7 8 9 10 11 12 13 14 15 16 17 18 19 20 21 22 23 24 25 26 27 28 29 30 31 32 33 34 35 36 37 38 39 40 41 42 43 44 45 46 47 48 49 50 51 52 53 54 55