Analyzing the overfitting of boosted decision trees for the modelling of stencil printing
Péter Martinek, Oliver Krammer*
Department of Electronics Technology, Faculty of Electrical Engineering and Informatics, Budapest University of Technology and Economics, H-1521 Budapest, P.O.B. 91, Hungary
* Corresponding author, e-mail: krammer@ett.bme.hu Abstract
Stencil printing is one of the key steps in reflow soldering technology, and by the spread of ultra-fine-pitch components, analysis of this process is essential. The process of stencil printing has been investigated by a machine learning technique utilizing the ensemble method of boosted decision trees. The phenomenon of overfitting, which can alter the prediction error of boosted decision trees has also been analyzed in detail. The training data set was acquired experimentally by performing stencil printing using different printing speeds (from 20 to 120 mm/s) and various types of solder pastes with different particle sizes (particle size range 25–45 µm, 20–38 µm, 15–25 µm) and different stencil aperture sizes, characterized by their area ratio (from 0.35 to 1.7). The overfitting phenomenon was addressed by training by using incomplete data sets, which means that a subset of data corresponding to a particular input parameter value was excluded from the training. Four cases were investigated with incomplete data sets, by excluding the corresponding data subsets for: area ratios of 0.75 and 1.3, and printing speeds of 70 mm/s and 85 mm/s. It was found that the prediction error at input parameter values that have been excluded from the training can be lowered by eliminating the overfitting; though, the decrease in the prediction error depends on the rate of change in the output parameter in the vicinity of the respective input parameter value.
Keywords
stencil printing, machine learning, decision tree, boosted decision trees, overfitting
1 Introduction
The mass manufacturing of electronic circuits is dominated by the usage of surface mount technology nowadays, in which the components are connected to the printed circuit board by reflow soldering technology [1, 2]. The essence of this technology is that the solder material is provided onto the assembly board in a paste form, the electronic components are placed into the deposited solder paste, then the assembly is transported through an oven. The assembly is heated above the melting point of the solder alloy (lead- free ones have been used generally since 2006), the solder melts and wets the metallizations, then it solidifies when the assembly is cooled down at the end of the process, thereby forming the solder joints between the components and the printed circuit board. The component sizes are continuously decreasing in electronics to meet the functional requirements of IoT (Internet of Things) and 5G devices. The decrease in the component sizes challenges the most critical step in reflow soldering technology, namely the (step of) stencil printing [3, 4]. The stencil printing is responsible for the deposition of solder paste (suspension of solder particles and flux vehicle) onto the soldering pads of the printed circuit board. Based on the literature, most of the reflow soldering failures (50–60%) can be rooted to stencil printing, which renders it a process
needed to be analyzed and optimized continuously [5]. The need for optimization became even more crucial by the spread of ultra-fine-pitch components (e.g., QFN – Quad Flat No-lead, µBGA – Micro Ball Grid Array) [6], since smaller apertures belong to the assembly of these components, and the solder paste is harder to be deposited through these apertures. As a consequence, the detailed analyzes and thorough optimization of the stencil printing process by new techniques and methods, like machine learning-based methods, is inevitable to comply with the approach of zero-defect manufacturing.
Machine learning-based methods consist of such algorithms (within the field of artificial intelligence), which can evolve through empirical learning (by datasets) and provide more accurate results. By utilizing the learning dataset, these methods can create a model that can predict the values of parameters or make appropriate decisions without being developed or programmed to the specific subject. Recently, computing resources have been advancing to a level which allows the application of computational demanding methods to predict and optimize the output of non-linear processes. Optimizing in the early design phase of the electronics manufacturing process can greatly increase their first-pass yield, thereby reducing the need for repair and rework. Several ensemble methods
(within the field of machine learning) were used for assessing the technology of reflow soldering or stencil printing, like fuzzy logics [7], decision trees or random forests [8] and artificial neural networks [9]. Though, the stencil printing process was modelled either by neglecting the main characteristic of the stencil aperture, namely the area ratio [5], or has been investigated for the application of through-hole components in the pin-in-paste technology [9]. Furthermore, boosted decision tree ensemble methods have though proven to be appropriate for electronics technology processes, they suffered from the risk of overfitting. Consequently, we decided to analyze the effect of overfitting on the predicting capability of boosted decision trees for the process of stencil printing by also taking the area ratio of stencil apertures into consideration.
2 Materials and methods 2.1 Theoretical background
Decision trees construct a categorization for the training instances by forming branches from well-defined true/false questions in a tree structure. In the structure of the decision tree, the letters represent the appropriate instance category, and the branches represent the connection of features that lead to these categories. If the target value is continuous, e.g. in the case of real numbers, the tree is called a regression tree. The common relevant term, CART (Classification and Regression Trees), covers both regression and classification trees [10]. The main advantage of decision trees is that the data do not require any preparation/pre-shaping, and they can easily be applied to large data sets. However, the accuracy and robustness of the method may be lower compared to other approaches.
The so-called hybrid models apply techniques (e.g., boosting or bagging) which help to overcome these disadvantages, while gradient scaling helps to maintain the required low computation time.
The idea of boosting is based on an iterative method, with an input of
{ (x yi, i) }
ni=1 and with a loss function of
(
, ( ))
L y F x . The predicting model
( ) 1( ) ( )
m m m m
F x =F− x +
γ
h x is getting more precise stepwise, while the learner – for example, a decision tree –m( )
h x is aligned by solving the following optimization problem (1):
1 1
arg min n ( , ( ) ( ))
m i m i m i
i
L y F h x
γ
γ −γ
=
=
∑
x + (1)where F xm( ) is the updated model after iteration step m.
Trees with a predefined size are used in gradient boosting,
where the base learner is a regression tree h( )x having L leaves. This regression tree divides the x vector space into L independent regions
{ }
Rlm lL=1 in every iteration step m.The solution for the minimization problem, in the end, is (2) [11]:
arg min ( , 1( ) )
i lm
lm i m i
R
L y F
γ
γ −γ
∈
=
∑
+x x (2)
One can use simple regularization method as well, which defines the contribution of the base learners by using a ν factor [11] as follows (3):
( ) 1( ) ( )
m m lm lm
F x =F − x + ⋅v
γ
I x∈R (3) where ν is mainly called the "learning rate".Using a machine learning method means that an optimal solution is sought for a system of equations with several parameters. It can happen that if the parameters are chosen incorrectly, the system is overparameterized, i.e., the so- called overfitting phenomenon occurs [12]. In addition, in the case of overfitting, a seemingly excellent and accurate model and solutions are provided to a given problem – that is, the output data is determined with a high accuracy based on the input data. However, an over-fitted model will most likely estimate the output with a high error rate for other input combinations which are not included in the training data set.
There are many approaches for preventing overparameterization. For example, suppose the number of parameters can be reduced so that the accuracy of the model does not deteriorate significantly. In that case, one can avoid overfitting (at the same time) by considering fewer parameters in the teaching, thus utilizing less memory and computational resources. As a result, the required runtime can be reduced significantly. The most common approaches include building a model that consists of the appropriate input parameters but excludes parameters that are not suitable for the general description of the system. Hence, this approach seeks to reduce the number of parameters used by the training method [13, 14].
Another approach is the partitioning of the data (used for teaching) into multiple data sets to validate the model.
During the validation, the efficiency of the created model is examined on these different data sets, so it can be determined if the model has been overfitted on a given set of the training data; the model calculates the output with rather high error rate for one or more validation date sets in this case. Because in this approach the teaching is performed in multiple iterations (a model considered inaccurate during the validation process is rejected and
possibly re-training is also initialized), so it may not be applicable for large data sets due to the significant increase in the training time [15].
2.2 The training data set
The data set for training the decision tree-based method was obtained by experiments. Stencil printing was carried out on a testboard by utilizing different printing speeds (in an EKRA X4 stencil printer), stencil aperture sizes, and lead- free solder paste types (varying solder particle diameter), as detailed in the work [16]. The printing speeds were the following: 20, 40, 75, 85, 120 mm/s, and the area ratio of the stencil apertures was varied between 0.35–1.7. The investigated solder paste types were Type-3, Type-4, Type5, in which the diameter range of the solder particles were 25–45 µm, 20–38 µm, 15–25 µm, respectively.
Though, the particle sizes in the different solder paste types were analyzed in detail. The particle diameter distribution was approached by a log-normal distribution, and the parameters of the geometric mean (µg = eµ) and geometric deviation (σg = eσ) were used for characterizing the different solder paste types quantitatively. The output parameters which determine the quality of the stencil printing process were the area, thickness and volume of the solder paste deposits. These parameters were measured by a Koh-Young aSPIre II solder paste inspection (SPI) machine.
The experimental runs were repeated 5 times, i.e., using 5 testboards for each printing speed and solder paste type.
As a result, the experiment yielded a data set with 15 675 vectors consisting of the input and output parameters.
2.3 Analyzing the over-fitting of decision trees
Boosted decision trees (using the technique of Least Squares Boosting) were used for the analyzes. The decision tree models were implemented in Matlab and optimized by splitting the input data set into training and test set stochastically and minimizing the Root Mean Squared Error (RMSE) of the model prediction to the test set.
Besides, a validation data set was created, which consisted of 345 vectors of the input and output parameters, strictly including only one instance of each input parameter value. The output parameter values in the validation set were obtained by calculating the mean of the corresponding output values. The predicting capability of the decision trees (non-boosted and boosted) was characterized by the Mean Absolute Percentage Error of the prediction to the output values in the validation data set.
The phenomenon of overfitting was analyzed by preparing so-called incomplete data sets. This means that
one value of an input parameter was omitted entirely from the training together with the corresponding output parameter values. For example, the vectors for the printing speed of 70 mm/s were entirely omitted from the training set. As a second step, the decision trees were trained by this incomplete data set. Finally, the predicting capability was analyzed by setting the excluded value as an input value (e.g., 70 mm/s printing speed) and comparing the predicted output values to the excluded experimental output values.
By this method, one can simulate the effect when a new (formerly unknown) input parameter value appears in the process of stencil printing, and the decision trees are used to predict the quality of the printing (area, thickness and volume of solder paste deposits). Incomplete data sets can be created similarly by omitting values of the stencil aperture size (area ratio). By going through the steps mentioned above, one can simulate the effect when a new (formerly unknown) aperture size appears in the manufacturing, e.g. when a new electronic component is introduced into the electronics product. In this investigation, the predicting capability was analyzed for 4 incomplete data sets; by omitting the value of printing speed 70 mm/s or 85 mm/s, or by omitting the value of area ratio 0.75 or 1.3 (always omitting only one input value at once).
Training by incomplete data sets can reveal the phenomenon of overfitting immediately. If the output values are predicted for an input value included in the training set, the prediction error is expected to be low.
Contrary, if the output values are predicted for an input value which was excluded from the training, the predicting error is expected to be relatively high. By eliminating the phenomenon of overfitting, the predicting error at input values included in the training can be slightly higher, but the prediction error at an input value excluded from the training can be lower at the same time. The elimination of overfitting was solved in this investigation by changing the training parameters and evaluating the changes of the prediction error for both omitted and included input data combinations in different training data sets. Learning parameters for the boosted decision trees were: minimum leaf size, learning rate and number of learning iterations.
Overfitting may occur if minimum leaf size and learning rate are low, while the number of learning iterations is high.
Hence, if validation for omitted input parameters showed a high error rate, parameters for the minimum leaf size and learning rate were increased and the number of learning iterations were decreased to prevent overfitting by also analysing the changes in error rate for multiple validation
data sets in multiple training iterations for various training data.
3. Results and discussion
The phenomenon of overfitting was investigated for boosted decision trees. By analyzing the mean absolute percentage of the prediction for incomplete data sets the phenomenon of overfitting was found. Figure 1 and Figure 2 illustrate the prediction error for the cases when data vectors corresponding to the stencil aperture area ratio of 0.75 were excluded. In Figure 1, the prediction error for AR 0.9 is illustrated – presenting the case when the output parameters (area, thickness, volume) are predicted for an input parameter value that has been included in the training.
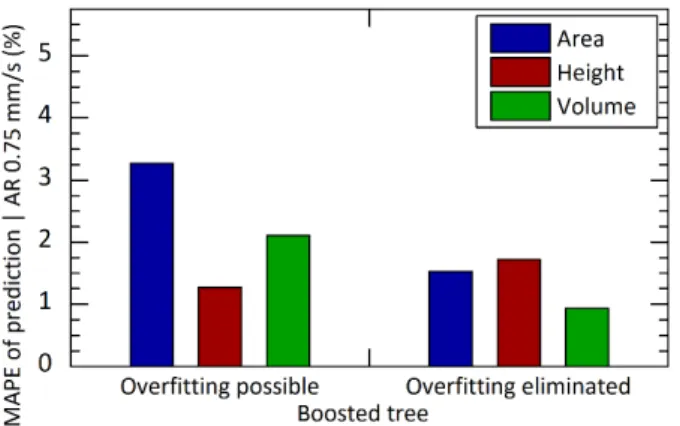
On the contrary, the prediction error for AR 0.75 is illustrated in Figure 2 – presenting the case when the output parameter values are predicted for an input parameter value that has been excluded from the training.
Fig. 1 Prediction error of area, height and volume of deposited solder paste at a stencil aperture area ratio 0.9 (the data subset for AR 0.75 has
been excluded from the training)
Fig. 2 Prediction error of area, height and volume of deposited solder paste at a stencil aperture area ratio 0.75 (the data subset for AR 0.75 has
been excluded from the training)
As it can be observed in the figures, when the overfitting is not eliminated, boosted decision trees can predict the quality of stencil printing with low error, [below 1% (Fig. 1 left part)] for input parameters that have been included in
the data set. On the contrary, the prediction error is much higher for an input parameter value that has not been included in the training (simulating when a new input parameter value is introduced in the process); the prediction error can reach 3% (Fig. 2 left part).
If the overfitting is eliminated, the prediction capability of boosted trees can be enhanced for the process of stencil printing. The prediction error can be lowered from 2.2% to 1.4% in average for an input parameter value (AR 0.75) that has not been included in the training set, as illustrated in the right part of Fig. 2. Nevertheless, eliminating the overfitting can increase the prediction error, particularly for the input parameter values included in the training, as illustrated in the right part of Fig. 1. Generally, if boosted tree-based prediction is necessary for a process parameter value that is not available at the moment but is expected to be introduced in the future, overfitting can be eliminated.
Nevertheless, eliminating overfitting may not reduce the prediction error for excluded parameter values but does not significantly increase the error either. Figure 3 illustrates the prediction error for the stencil aperture area ratio of 1.3 (in this case, this value was excluded from the training).
Fig. 3 Prediction error of area, height and volume of deposited solder paste at a stencil aperture area ratio 1.3 (the data subset for AR 1.3 has
been excluded from the training)
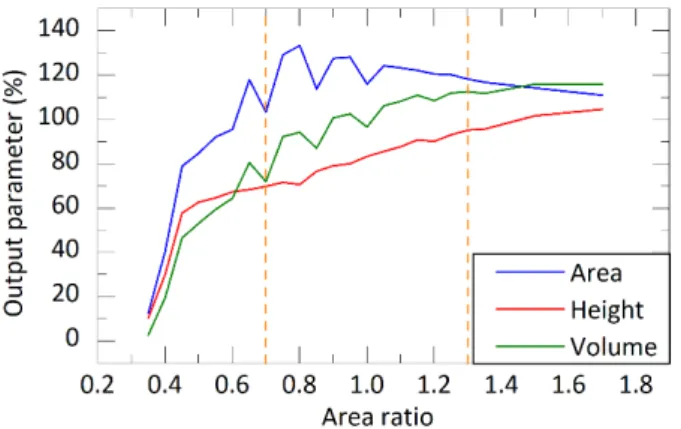
This can be because the change of output values (area, thickness, volume) is lower in the vicinity of the specific input value; that is, the slope of the output function is lower at that region. Figure 4 illustrates the area, height and volume of solder paste deposits as functions of stencil aperture area ratio. As it can be seen, the slope or the change in the function is much pronounced at the area ratio of 0.7 than at the ratio of 1.3 (indicated by orange dashed lines), except for the parameter of height. If Figure 2 is reanalyzed, it can be found there too that the prediction error of height was not decreased by eliminating overfitting.
Fig. 4 Output parameters as a function of stencil aperture area ratio (note, the percentage value for the height is calculated by dividing the height
values by 150 µm, which is the stencil thickness)
The prediction error of boosted trees was analyzed for such incomplete data sets also in which data vectors were excluded for specific printing speeds (not for particular area ratios). Figures 5–7 illustrate the corresponding prediction errors. At first, a case is presented in Figure 5, where the specific printing speed was included in the training.
Fig. 5 Prediction error of area, height and volume of deposited solder paste at a printing speed of 45 mm/s (the data subset for speed 70 mm/s
has been excluded from the training
Like when data vectors for particular area ratios were excluded, the prediction error is increasing for input values that have been included in the training by eliminating the overfitting; from ~0.6% to 2% in this case. Figure 6 and Figure 7 illustrate the prediction error for printing speeds which were not included in the training.
By eliminating overfitting, no significant decrease in the prediction error was found at the printing speed of 70 mm/s, i.e., using an input parameter which was excluded from the training. Similar results were obtained with the printing speed of 85 mm/s. The change in the average prediction error of the output parameters (mean of error for the area, height and volume) for the two printing speeds were 2.57%-
>2.4% and 3.85%->3.45%, respectively.
Fig. 6 Prediction error of area, height and volume of deposited solder paste at a printing speed of 70 mm/s (the data subset for speed 70 mm/s
has been excluded from the training
Fig. 7 Prediction error of area, height and volume of deposited solder paste at a printing speed of 85 mm/s (the data subset for speed 85 mm/s
has been excluded from the training
The reason for the insignificant decrease in the prediction error (by eliminating overfitting) is the same as in the case presented in Figure 3, that is, the output parameters (area, height, volume) do not change significantly as the function of the input parameter (printing speed), as illustrated in Figure 8.
Fig. 8 Output parameters as a function of printing speed (note, the percentage value for the height is calculated by dividing the height values
by 150 µm, which is the stencil thickness)
4 Conclusion
Boosted decision trees have been investigated for predicting the quality of stencil printing, and the phenomenon of overfitting was analyzed, which can alter the performance of boosted trees and the prediction error. Generally, overfitting causes problems (high prediction error) only if the outputs of a process are needed to be predicted for input parameter values that cannot be included in the training data set, because they are not available at the time of training.
Specifically, if the outputs change rapidly in the vicinity of a particular input value, high prediction error is expected for that input if overfitting is not eliminated. On the other hand, if the change in the output is small, or all the inputs are / can be included in the training, a possible overfitting does not yield in the increase of prediction error. In this case, the decision tree can be utilized without overfitting, providing faster predictions.
Acknowledgement
This paper was supported by the János Bolyai Research Scholarship of the Hungarian Academy of Sciences.
The research reported in this paper and carried out at the BME has been supported by the NRDI Fund based on the charter of bolster issued by the NRDI Office under the auspices of the Ministry for Innovation and Technology.
References
[1] Illés, B., Géczy, A., Skwarek, A., Busek, D. "Effects of substrate thermal properties on the heat transfer coefficient of vapour phase soldering", International Journal of Heat and Mass Transfer, 101, pp.
69–75, 2016.
https://doi.org/10.1016/j.ijheatmasstransfer.2016.04.116
[2] Illés, B., Géczy, A. "Investigating the heat transfer on the top side of inclined printed circuit boards during vapour phase soldering", Applied Thermal Engineering, 103, pp. 1398–1407, 2016.
https://doi.org/10.1016/j.applthermaleng.2016.04.153
[3] Lau, C.S., Khor, C.Y., Soares, D., Teixeira, J.C., Abdullah, M.Z.
"Thermo–mechanical challenges of reflowed lead–free solder joints in surface mount components: a review", Soldering & Surface Mount Technology, 28(2), pp. 41–62, 2016.
https://doi.org/10.1108/SSMT-10-2015-0032
[4] Skwarek, A., Synkiewicz, B., Kulawik, J., Guzdek, P., Witek, K., Tarasiuk, J. "High temperature thermogenerators made on DBC substrate using vapour phase soldering", Soldering & Surface Mount Technology, 27(3), pp. 125–128, 2015.
https://doi.org/10.1108/SSMT-04-2015-0017
[5] Tsai, T.N. "Modeling and optimization of stencil printing operations: A comparison study", Computers & Industrial Engineering, 54(3), pp. 374–389, 2008.
https://doi.org/10.1016/j.cie.2007.08.001
[6] Pan, J., Tonkay, G.L., Storer, R.H., Sallade, R.M., Leandri, D.J.
"Critical Variables of Solder Paste Stencil Printing for Micro–BGA and Fine–Pitch QFP", IEEE Transactions on Electronics Packaging
Manufacturing, 27(2), pp. 125–132, 2004.
https://doi.org/10.1109/TEPM.2004.837965
[7] Aamir, M., Waqas, M., Iqbal, M., Hanif, M.I., Muhammad, R.
"Fuzzy logic approach for investigation of microstructure and mechanical properties of Sn96.5–Ag3.0–Cu0.5 lead free solder alloy", Soldering & Surface Mount Technology, 29(4), pp. 191–198, 2017. https://doi.org/10.1108/SSMT-02-2017-0005
[8] Wu, H. "Solder joint defect classification based on ensemble learning", Soldering & Surface Mount Technology, 29(3), pp. 164–
170, 2017. https://doi.org/10.1108/SSMT-08-2016-0016
[9] Martinek, P., Krammer, O. "Analyzing machine learning techniques for predicting the hole-filling in pin-in-paste technology", Computers & Industrial Engineering, 136, pp. 187–194, 2019.
https://doi.org/10.1016/j.cie.2019.07.033.
[10] Breiman, L., Friedman, J. H., Olshen, R. A., Stone, C. J.
"Classification and regression trees", Chapman & Hall/CRC Taylor
& Francis Group, Suite 300 Boca Raton, FL 33487-2742, United States, 1984. ISBN 978-0-412-04841-8
[11] Friedman, J. H. "Stochastic Gradient Boosting", Computational Statistics & Data Analysis, 38(4), pp. 367–378, 2002.
https://doi.org/10.1016/S0167-9473(01)00065-2
[12] Ying, X. "An Overview of Overfitting and Its Solutions", Journal of Physics: Conference Series, 1168(2), pp. 1–7, 2019.
https://doi.org/10.1088/1742-6596/1168/2/022022
[13] Srivastava, N., et. al. "Dropout: A Simple Way to Prevent Neural Networks from Overfitting", Journal of Machine Learning Research,
15, pp. 1929–1958, 2014.
https://www.cs.toronto.edu/~rsalakhu/papers/srivastava14a.pdf [14] Jabbar, H. K., Khan, R. Z. "Methods to Avoid Over-fitting and
Under-fitting in Supervised Machiene Learning (Comparative Study)", Computer Science, Communication & Instrumentation Devices, December, pp. 163-172, 2014.
https://doi.org/10.3850/978-981-09-5247-1_017
[15] Berrar, D. "Cross-validation", Encyclopedia of Bioinformatics and Computational Biology, 1, pp. 542–545, 2019.
https://doi.org/10.1016/B978-0-12-809633-8.20349-X
[16] Krammer, O., Al-Ma'aiteh, T., Martinek, P., Anda, K., Balogh, N.
"Predicting the Transfer Efficiency of Stencil Printing by Machine Learning Technique", In: 2020 43rd International Spring Seminar on Electronics Technology (ISSE), Demanovska Valley, Slovakia 2020, pp. 1–6.
https://doi.org/10.1109/ISSE49702.2020.9121032
Subject: [EE] Editor Decision: 19274 From: Balázs Illés <billes.sci@gmail.com>
Date: 2021.09.27. 13:40
To: Péter Mar nek <mar nek@e .bme.hu>, Olivér Krammer <krammer@e .bme.hu>, Anna Dobóczi <doboczi.anna@bme.hu>, Alma Véghseő <veghseo.alma@bme.hu>
Dear Péter Mar nek, Olivér Krammer,
We have reached a decision regarding your submission to Periodica Polytechnica Electrical Engineering and Computer Science, "Analyzing the over‐fi ng of boosted decision trees for the modelling of stencil prin ng".
Our decision is: Accept Submission on condi on that the final version meets formal requirements
Please upload your paper in final form. The final version is due within 4 weeks. Should you not be able to meet this deadline, please contact us as soon as possible. Otherwise, we assume that the paper is withdrawn. By uploading the final version, you declare that this paper has not been and will not be submi ed to other journals or conferences for publica on.
Here is an MS Word Template, sample file and descrip on for preparing the final version of the manuscript. When the final version is ready, please login the on‐line journal system and select the men oned paper by clicking on its author name/ tle. The program will open the Copyedi ng page where you should start the Copyedi ng Discussions by clicking on the Add discussion link. The files of the final version should be a ached to this discussion by clicking on the Upload File link. The Message body should explain the roles of a ached files. We expect an Ar cle text source prepared with this MS Word Template. Figures should be uploaded as separate files and the text source should not embed them. However, the text source should clearly iden fy where figures are to be inserted by our copy editor.
We also require an Ar cle text PDF file to show the final outlook of the paper. This PDF file is used only for checking the typese ng.
Please follow the instruc ons very carefully to make the final typese ng easy and error free.
Should the submi ed final version not meet the requirements stated here, we shall ask revision and may reject the publica on of your paper even in this phase of the procedure.
ILLUSTRATIONS
Figures should be uploaded in separate files. Bitmap images are expected in jpg, png, gif or ff formats, vector graphics in eps or pdf formats. Please do not create line drawings with the built‐in features of Microso .
It is essen al that the bitmap images have sufficient resolu on to allow faithful reproduc on (300 dpi or more). To determine the op mum resolu on (width x height) of an image, measure the width and height as it appears in your document (in millimeters), and then mul ply those two values by 12. For example, a square image of 80 mm wide, i.e. having the width of a single column, the op mal size is about 1000 x 1000 pixel resolu on and should be at least 600 x 600.
1 of 2 2021.09.28. 15:25
side‐cap on is 120 mm. So try to keep le ering in a figure resized for the manuscript in a readable but moderate size (ideally equivalent to 8‐10 pt).
BIBLIOGRAPHY
Bibliography (References) should be complete. Each item must have proper and not
misunderstandable data (see the sample Word file or its PDF version for examples). Please add the DOI number or URL of a full‐text version if it exists. The DOI of journal papers can be found in page h p://www.crossref.org/SimpleTextQuery/ (you need to register first). DOIs must be given for conference papers, too.
The bibliography style for Mendeley users:
h ps://csl.mendeley.com/styles/481588271/periodica‐polytechnica‐num‐doi‐2
Our Copy Editor will check all figure and bibliography requirements and lets typese ng start only when all of them are met. The precise prepara on of your final version speeds up the publica on of your paper.
As soon as typese ng is ready, you will be asked to check it within a few days. Then, your paper will appear in the "online first" sec on of the journal and will immediately receive a DOI.
Thanks for your coopera on and best regards
________________________________________________________________________
Periodica Polytechnica Electrical Engineering and Computer Science h ps://pp.bme.hu/eecs
2 of 2 2021.09.28. 15:25