In situ characterization of biomaterials at solid-liquid
interfaces using ellipsometry in the UV-visible-NIR wavelength range
Benjamin Kalas1,2, Emil Agocs1, Alekszej Romanenko1, Peter Petrik1
1Centre for Energy Research, Hungarian Academy of Sciences, Konkoly-Thege Str. 29-33, H-1121 Budapest, Hungary
2Doctoral School of Physics, Faculty of Science, University of P´ecs, Ifj´us´ag Str. 6, H-7624 P´ecs, Hungary
Key words: Bioellipsometry, Solid-liquid interface, Optical characterization, Spectroscopic ellipsometry
⇤Corresponding author: e-mailpetrik.peter@energia.mta.hu
Understanding interface processes has been gaining crucial importance in many applications of biology, chem- istry and physics. The boundaries of those disciplines had been quickly vanishing in the last decade, as metrolo- gies and the knowledge gained based on their use improved and increased rapidly. Optical techniques such as microscopy, waveguide sensing or ellipsometry are significant and widely used means of studying solid-liquid interfaces because the applicability of ions, electrons or X-ray radiation is strongly limited for this purpose due to the high absorption in aqueous ambient. Light doesn’t only provide access to the interface making the measurement possible, but utilizing the phase information and the large amount of spectroscopic data, the el- lipsometric characterization is also highly sensitive and robust. In this article we only focus on ellipsometry of biomaterials in the visible wavelength range. We discuss the main challenges of measuring thickness and optical properties of ultra-thin films such as biomolecules. We give an overview on different kinds of flow cells from conventional through internal reflection to combined methods. We emphasize that surface nanostructures and evaluation strategies are also crucial parts ofin situbioellipsometry. We summarize some of the recent trends showing examples mainly from our research.
Copyright line will be provided by the publisher
1 Introduction Interface processes are of primary im- portance in physical, chemical and biological studies since most bioprocesses in our bodies take place at the solid- liquid interfaces. The biomaterials at these interfaces are very often characterized by optical methods [1]. Besides the high sensitivity and sampling speed, optical tools like microscopy, waveguide sensing or ellipsometry are capa- ble of real time monitoring, which is a key to understand the the dynamics of the processes [2–4]. Ellipsometry mea- sures phase differences, such as interferometry, however, in the case of ellipsometry the ”reference beam” is “built in the system” in form of the perpendicularly polarized light [5–8]. This fact is important, because it provides a high sensitivity without the requirement of a coherent source.
That enables a relatively easy realization of spectroscopic instrumentation [9] also of a high speed multi-channel el-
lipsometry [10]. The large number of phase-sensitive spec- troscopic data allows the construction of complex optical models, and the determination of numerous parameters of the investigated systems, also during real time monitor- ing [11,12]. These features make ellipsometry an excellent tool for investigating bio-related systems [13–15].
One possible classification of thin film characterization methods is [16]: (i) depth profiling by sputtering (exam- ples are the Auger depth profiling or the secondary ion mass spectrometry), (ii) whole-layer measurement from the surface (mainly non-destructive but indirect methods such as Rutherford backscattering spectrometry or spec- troscopic ellipsometry), (iii) cross-sectional methods (e.g.
transmission electron microscopy) [16,17]. The lateral res- olution is usually not better than oneµm2, except for the time-consuming and expensive cross-sectional methods
or special approaches such as the scanning Auger elec- tron spectroscopy. While macro imaging ellipsometry can map surfaces of square meters [18], microscopic imag- ing ellipsometry [19] works down to the above-mentioned diffraction limit (not much better than one micron). Be- sides the cross-sectional approach, better lateral resolution can only be achieved using tapping mode methods, such as atomic force microscopy or scanning tunneling mi- croscopy (with special features as nano-lithography [20]) and numerous emerging optical methods including the near-field approach, evanescent-wave enhancement [21], scatterometry [22–24] or nanospheres [25,26]. However, these methods do not provide information on the bulk layer optical properties.
Another typical characteristic of thin film measurement methods is the fairly good vertical resolution down below 10 nm, or even 1 nm. But the sub-angstrom sensitivity of ellipsometry is unique, with a high precision even at buried interfaces [27]. The high sensitivity is also associated with a high sampling speed. While the measurement of most thin film characterization methods takes minutes or even hours and days, a state-of-the-art multi-channel ellipsome- ter is capable of measuring hundreds of spectral points in a broad wavelength range (e.g. 190-1700 nm) within just one second, sometimes utilizing both dual light sources and de- tectors. The high acquisition rate and sensitivity combined with the non-destructive measurement capability can be utilized in many fields fromin situbioellipsometry [28] to large area mapping [18,29], although the increase of lateral resolution remains a challenge.
The methods of thin film characterization can also be classified based on the particles (e.g. electrons, different types of ions) used for excitation and detection. Since there are methods that use different kinds of particles for excita- tion and detection, a matrix can be constructed describing the possible combinations and the locations of the differ- ent methods in the matrix. Table 1 shows a few examples of them – it is naturally far from being a comprehensive overview.
This classification can be helpful to consider the meth- ods from a different point of view, namely that of the pen- etration depth. When measuring at solid-liquid interfaces, the particles of excitation have to reach the surface either through the liquid or through the substrate. The methods using photons provide a good access in both cases, al- though the penetration depth of light in water largely de- creases when leaving the visible range (Fig. 1), and even the measurement from the substrate using e.g. glass is a problem towards both the ultraviolet and infrared direc- tions. The use of X-ray excitation is also a challenge, which can be solved by measuring through thin foils [30]. Simi- larly, the mid-infrared wavelength range requires a com- pletely different cell design, usually measuring through a silicon wafer used as the substrate [31,32].
Therefore, in this topical review we deal with ellipsom- etry around the visible wavelength range, the application of
which in biology goes back to the 1940s [35]. Even a sep- arate chapter on bioellipsometry was published in one of the major books on ellipsometry in the 1970s [5]. However, the number of publications in bioellipsometry started to in- crease only in the middle of ’90s, approximately ten years after a significant increase in ellipsometry articles had been started (Fig. 2).
In the cases of both ellipsometry and bioellipsometry, the number of publications reached a saturation around the year of 2010. The number of bio-related publications in- creased significantly after the year of 2000. In this work, a short summary is given on the developments of ellipsome- try for solid-liquid interface characterization, with empha- sis on the results of our group and the most recent advance- ments for biomaterial investigations. We don’t discuss all solid-liquid interface processes (such as reflectance differ- ence anisotropy spectroscopy [36–38], penetrant-exposed polymer films [39] electrochemical process monitoring [40–43] also in a combination with cyclic voltametry [44]) Table 1 Thin film metrology matrix according to the incident and detected particles. (e , e+ n0, and p+ denote electron, positron, neutron and proton, respec- tively; Raman: Raman spectroscopy; GI-XRD: Grazing- incidence X-ray diffraction; AXES: Angle-dependent X- ray emission spectroscopy; XRF (EDX): X-ray fluo- rescence (EDX: Energy dispersive X-ray spectroscopy);
SHG: Second harmonic generation; XPS: X-ray photo- electron spectroscopy; AES: Auger electron spectroscopy;
TEM: Transmission electron microscopy; SEM: Scan- ning electron microscopy; GD-OES: Glow-discharge op- tical emission spectrometry; PIXE: Particle-induced X- ray emission; SIMS: Secondary ion mass spectrometry;
RBS: Rutherford backscattering spectrometry; ND: neu- tron diffraction; SNMS: Sputtered neutral mass spectrom- etry; GD-MS: Glow discharge mass spectrometry; )
INCIDENT DETECTED
Photons e ,e+ n0,p+, Ions Photons Ellipsometry XPS
Reflectometry Raman GI-XRD AXES XRF (EDX) SHG
e ,e+ Positron AES
annihilation TEM SEM
n0,p+, Ions GD-OES SIMS
PIXE RBS
ND SNMS GD-MS
Figure 1The optical properties of water from [33,34] and the calculated penetration depth of light in water. Above the wavelength of 10µm the Kramers-Kronig consistency of the reference data are doubtful, therefore the penetration depth data are only approximately correct.
in general, since the topic is huge. The theory of ellipsom- etry will also not be included, because it can be found in many books and articles [5–8,45–48]. We rather focus on the frequently used measurement configurations of ellip- sometry applied for studying the interface between liquids and solids, mainly using examples from our research.
Figure 2Number of articles with the words ”ellipsome- try” and ”bio*” (”Bioellipsometry”) or only ”ellipsometry”
(”Ellipsometry / 10”) in the title, abstract or keywords. The number of articles for ”ellipsometry” are divided by 10 in the plot for the better visibility.
2 Measurements in air The first applications of ellipsometry for studying systems related to biology have been made on biofilms in air. The measurement of biomolecules has been a challenge because of the small thicknesses to be measured. The first tool named ”ellip- someter” has been demonstrated in 1945 [35], revealing a sensitivity of±0.3 ˚A for the measurements of thin films on metal surfaces. The most used substrates and structures were microelectronic-grade materials and layers, mainly silicon wafers and thin films created by ion implantation [49,50] or other coating technologies. Due to the good adhesion, protein films have also been studied on silicon wafers that have an oxide layer both for native and oxidized wafers, providing glass-like chemical surface properties.
Most of the studied protein molecules form compact monolayers, the dielectric function of which can be de- termined by ellipsometry with high precision [51]. How- ever, there are fundamental problems about the evaluation of such thin films. Most importantly, the simultaneous de- termination of the refractive index (n), the extinction coef- ficient (k) and the layer thickness (d) of ultrathin films is challenging due to a nearly singular Jacobian matrix in the inversion process that requires a high accuracy of the raw measured values. This limitation can usually be circum- vented by taking advantage of the spectral correlations be- tween the optical properties (dispersion ofnandk) of the film and the substrate [52]. In the case of semiconductors, there are sophisticated ways for the independent determi- nation of the oxide layer thickness by analyzing artifacts in the dispersion of the dielectric function [53,54], the re- flectance data [55] or using the virtual interface method [56,57].
For proteins, on the other hand, there is another possi- bility: the amount of deposited material can be determined in a robust and reliable way using the de Feijter’s method [58]. When the dependence of the refractive index on the concentration of the solution (a= dn/dc) as well as both the refractive index of the ambient (n0) and the layer (n) are known, the concentration of the protein (mass per unit surface) can be determined using the following equation (see also Refs. [28] and [59]):
= d(n n0)
a , (1)
whereddenotes the thickness of the layer. The importance of this approach is that even if the thickness and the refrac- tive index of the ultrathin protein layers are correlated, the amount of material is proportional to their product, which can be determined in a more robust and reliable way.
The determination of the intrinsic dielectric function of protein is also a critical issue, because these dielectric functions depend on the compactness and adhesion of the protein molecules, and therefore depend on the preparation conditions. It is remarkable that the same problem holds for most inorganic thin films as well, because their prop- erties depend very much on the preparation methods and
parameters. That is the reason why dielectric function ref- erences of thin films have to be used very carefully. Never- theless, it can be shown that the amount of protein can even be determined by a simple intensity measurement using an off-null ellipsometer configuration [60]. This fact can also be utilized in quantitative imaging ellipsometry on protein covered surfaces [19].
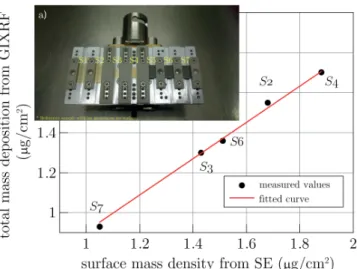
Finally, the characterization of ultra-thin films is a gen- eral problem, because any surface or interface aberrations (nanoroughness, contamination, etc.) result in a larger pro- portional influence on the measured layer parameters than in the case of thicker layers. ”Thicker” means in this con- text tens or hundreds of nanometers. If few nanometers have to be measured in air, the contamination from the ambient is also a significant problem, which consists of water molecules and hydrocarbons accumulated in a few weeks [61]. Extensive comparative investigations showed that the systematic deviation of some measured thin film parameters is primarily also coming from the contamina- tion and the above mentioned aberrations [62–64], which results in a larger thickness and amount of material mea- sured by ellipsometry in air than measured by other tech- niques such as vacuum ultraviolet reflectometry [63] or X-ray fluorescence [64]. When comparing many different techniques [62], sub-nanometer accuracy is a challenge not only because of a possible contamination, but also because of the different spot-sizes, the different interpretation of the interfaces – even a very small lateral inhomogeneity can cause differences if the spot size or the measurement location cannot be exactly the same in the different tech- niques. Fig. 3 shows an example of a good correlation of the amount of adsorbed fibrinogen protein with systematic differences when comparing the values measured by ellip- sometry in air and by X-ray fluorescence investigated in a vacuum chamber [64].
3 Conventional flow cells The straightforward way of measuring proteins in a flow cell is to guide the light through the liquid to the surface. The optical quality, ge- ometry and location of the window is a crucial point. For larger flow cells the precise and stress-free realization is easier, which leads to a convenient measurement, in which the effect of the glass window can be neglected. However, a large cell has numerous disadvantages. (i) The larger tran- sition time is a great problem if it is important to measure the effect immediately after switching the analytes. During the time the analytes are mingling the measurement is usu- ally not possible because of the turbulences and the optical anisotropies within the flow cell. If this transition takes too much time, the surface adsorption or reaction effect could have already been over at the time the measurement is pos- sible again. (ii) The larger consumption of the analyte is an economic problem – the measurement is more expensive because of consuming more materials.
In many cases, the perfect alignment and stress-free in- sertion of the windows is a problem, which usually leads
Figure 3Comparison of the amount of protein deposited on gold (samples ’S1’–’S4’) and glassy carbon (samples
’S5’–’S7’) surface measured by grazing incidence X-ray fluorescence and spectroscopic ellipsometry [64]. The in- set a) shows the samples mounted on the holder used in the chamber of the X-ray measurements. The samples are numbered consecutively (from ’S1’ to ’S7’) from left to right – see the labels in the inset. Samples ’S1’ and ’S5’
are references without a protein layer.
to a shifted value. It is only a matter of calibration, but this effect certainly makes the measurement more incon- venient. A smaller window can limit the spot size of the light beam, which leads to a decreased signal. However, a smaller path in the liquid increases the signal, leading to a trade-off between the window and the cell size – for windows smaller than the beam. In many cases, focusing through the window is also possible because the distortions caused by the window can be tolerated, meaning negligible errors compared to the investigated effect.
Compared to internal reflection configurations (see the next chapter), the conventional (through-liquid) cells have the advantage of measuring on non-transparent substrates, and being sensitive at larger distances from the surface (i.e.
for thicker layers). This is important when measuring large molecules, such as flagellar filaments [2–4]. The capability of measuring at large distances from the surface allows the reconstruction of long thread-like structuresin situ, during adsorption (Fig. 4).
4 Internal reflection cells Compared to conven- tional (through-liquid) flow cells, internal reflection cells (Figs. 5 and 6) have numerous advantages [65]. (i) The wavelength range can be extended to both directions from the visible region, especially when using special, ultraviolet-grade glasses. (ii) The angle of incidence can be changed arbitrarily, although the very large and very small angles are usually limited by geometrical reasons, and using special arrangement the multiple-angle capabil-
Figure 4Measurement of the adsorption of flagellar fila- ments in a regular flow cell [4]. The graph on the left-hand side shows the normalized mass density distribution of the filaments as a funtion of the distance (z) from the surface described by a parametric model. The schematic drawing on the right-hand side demonstrates the model used for the attachment of the filaments to the surface (see also Ref.
[3]). A 3D image of the regular flow cell used for the study can also be seen in the inset.
Figure 5 (a) Hemi-cylindrical flow cell with a plas- monic gold substrate [70]. Subgraphs (b) and (c) show a schematic image and a photo of the measurement geome- try, respectively. The 10-µl flow cell isolated by an O-ring is shown in subgraph (d).
ity can also be realized in the case of conventional flow cells [66]. (iii) The sensitivity can be further enhanced by special surface layers and structures [67–70] (being espe- cially sensitive to the✏zdirection). (iv) Small cell volumes can easily be realized. (v) It is easier to map or image the interface [71,72].
Using internal reflection cells, the surface plasmon resonance method can be utilized, by having a thin plas- monic metal layer at the interface [74]. The resonance conditions can be determined by changing the angle of incidence or by changing the wavelength. Actually, with a modern ellipsometer we can measure a spectrum in the
Figure 6Sensitivity in a plasmon-enhanced Kretschmann geometry using only the amplitude information (fitting only on the ellipsometric angle of ) or both the amplitude and phase information (fitting on both and ) [73].
UV-Vis-NIR range (⇠200-1700 nm) wavelength range within one second, but measuring at multiple angles at high angle-resolution takes multiple times this duration.
Consequently, to monitor quick processes, it is better to measure at a fixed angle using the spectroscopic capabil- ity. Even in this case, a sensitivity down to the 10 pg/mm2 region can be achieved (Fig. 6 and Ref. [75]).
The high speed is especially required if the multi- channel capability has to be utilized. The first multi- channel cell that our research group realized was capable of moving the measurement spot within the O-ring along the long axis of the cell. In this study half of the surface had been spin-coated with TiO2nanospheres before the el- lipsometric measurement. All the corresponding areas can be measured within the samein situprocess by moving the spot back and forth during the protein adsorption process (Fig. 5). Consequently, this method is a multichannel mea- surement only from the point of view of the detection, the flow channel is the same for the different locations. This way, it can be ensured that all the measurement and analyte parameters are the same, only the surfaces are different, which helps us to get rid of the systematic errors [70].
Focusing is possible even through the hemi-cylinder, using custom-designed optics. The diameter of the spot in the focus is well below 0,5 mm, and even the one elon- gated due to the large angles of incidence can be within the cell (the width of the cell is below 1 mm). If the exten- sion toward the ultraviolet wavelength range is needed, the hemi-cylinder and the focusing optics all can be replaced by ultraviolet-grade components.
Surface enhancement can also be realized by using di- electric multilayer structures [76], e.g. Bragg layers [77,
78]. There are two major advantages of this method. (i) The wavelength of resonance can be custom-designed by using proper material stacks and thicknesses, whereas by plas- monic layers the position of resonance cannot be shifted below or above a certain limit [73]. (ii) Using a Bragg structure the surface layer can be chosen to be a dielectric that may play an important role in the surface chemistry.
In plasmonic configurations only the adsorption on gold, silver or other plasmonic metal surfaces can be studied.
Figure 7 Enhanced electric field using a Bragg multi- layer [77] [subfigures (a)-(c)], and its realization in a hemi- cylindrical Kretschmann geometry [78] [subfigure (d)].
In the case of using Bragg multilayers the width and position of the resonance, the optimum angle of incidence and many other parameters can be tuned by changing the materials, numbers and thicknesses of the layers, which re- sults in a much larger freedom in design than in the case of plasmonic layers.
5 Nanostructured surfaces Surface nanostructures have primarily been used to enhance the adsorption of biomolecules [70], however, they can also be used to en-
hance the sensitivity by increasing the change in the optical signal that was generated by the same amount of protein.
For example, in the case of gold layers it can be shown that besides the usual high-sensitivity plasmonic region in the thickness-angle map (Fig. 8) there is a small-thickness non-plasmonic region with a high sensitivity.
The application of metallic nanoparticles (NPs) is also an attractive method to enhance the optical sensitivity of the measurement. Recently the effect of gold NPs has been demonstrated for the investigation of various proteins mea- sured by ellipsometer in a conventional flow cell [79] and in an internal reflection cell as well [67,68,80].
Low-dimensional nanostructures (Fig. 9) can be used both for the adhesion and for the increase of sensitivity to measure the surface adhesion of molecules, cells or other surface processes [70,81].
Figure 8 Calculated sensitivity (standard deviation in nanometers calculated from the covariance matrix in the wavelength range of 400-1800 nm) for the ellipsometry measurement of a 5-nm thick protein layer on gold in a plasmonic configuration for different gold layer thick- nesses and angles of incidence. The sensitivity values (see color code) are given in nanometer. The lower values show higher sensitivities. The calculation was performed by fit- ting the spectra in the wavelength range of 400-1700 nm, using the optical model shown in the inset (BK7: glass sub- strate; CrOx: chromium oxide layer for better adhesion of gold; Au: gold layer modeled using the B-Spline param- eterization; EMA: effective medium composition of gold and water; FGN: fibrinogen layer modeled by the Cauchy dispersion; PBS: phosphate-buffered solution by the Sell- meier dispersion).
6 Combination of methods Since the measure- ments through the liquid and through the substrate have numerous complementary features, it makes sense to use those methods simultaneously, in order to combine the advantages. For example, ellipsometry measurements
Figure 9 Atomic force microscope image of a silicon wafer covered with a titanate nanotube layer [82] utilized as a sensor surface [81].
through the liquid have larger sensitivities at larger dis- tances from the surface, and internal reflection measure- ment from the substrate have an increased sensitivity in the proximity of the surface. Therefore, combining both can be used to follow the growth of thicker layers at high sensitivity [83].
Among many other possibilities [84–86], we combined grating coupled interferometry (GCI) with spectroscopic ellipsometry (Fig. 10), because in spite of being only a single-wavelength, single-value method, GCI has a signif- icantly higher sensitivity than ellipsometry [87]. On the other hand, ellipsometry has a spectroscopic capability with measuring a large number of spectroscopic values [3].
The chip designed for GCI can be used for the com- bined measurements by a special holder that allows access to the chip by the interferometer from the substrate side, and also holds the small flow cell of ellipsometry that is attached by an O-ring to the waveguide side of the chip.
The area illuminated by the ellipsometer is between the gratings used for incoupling the modulated and the refer- ence beams, i.e. on a non-patterned area. Therefore, the el- lipsometry evaluation can be performed using a relatively simple optical model, which only requires the waveguide layer on the glass substrate and the bio-layer on the waveg- uide, separated by parallel planes.
As shown in Fig. 10, the modulated and unmodulated reference beams of the interferometer are coupled into the waveguide using two gratings at both sides of the flow cell.
The modulated beam travels in the waveguide, the phase of which changes when the refractive index of the ambi- ent above the waveguide changes (e.g. due to adsorption of biomolecules). At the second grating, there is an interfer- ence between the modulated and the incoupled reference beam. The interference signal is coupled out of the waveg- uide, and its intensity is measured as a function of time (Fig. 11). The measured phase difference can then be cor-
Figure 10 Combination of spectroscopic ellipsometry with grating coupled interferometry (GCI). SE denotes the
”Spectroscopic ellipsometer” – the bottom part is GCI with the modulated and unmodulated laser beams. Reprinted from Ref. [83].
Figure 11Measured temporal intensities of the unmodu- lated (I1), modulated (I2), and interference (I) light beams (left axis), as well as the phase difference of the beams (non-accumulated phase, right axis) as a funtion of time (t).
related with the amount of adsorbed molecules at the sur- face of the waveguide.
7 Modeling and evaluation methods Being an in- direct method, both the optical models of the system un- der investigation and the evaluation by multi-parameter op- timization are crucial for a successful measurement. The first problem arises immediately when the light enters the system through the window of the cell or through the hemi- cylindrical or other substrate. Both the non-perpendicular
incidence (due to geometrical problems or to the spreading of angles caused by focusing) and the stress in the glass (quartz) may cause a significant distortion of the measured values (typically an offset of the phase-shift, , [2]).
The next issue is that for a high-sensitivity measure- ment the refractive index of all the media (e.g. the wa- ter, the gold layer, the glass of the hemi-cylinder) have to be known very accurately (see e.g. Fig. 3 in Ref. [73]).
Since the properties of these materials may depend on the preparation conditions, the stress or possible contamina- tions, the use of proper references is a great challenge. The best method is in many cases to fit those references before the process on the actually used system, then fix these pa- rameters and fit only the changing ones during the process (e.g. the thickness and optical properties of the adsorbing layer).
The third challenge is the evaluation. Due to the spec- troscopic capability and the resulting large number of mea- sured data, complex models with many parameters can and have to be constructed. To find the global minimum in such a system, sophisticated methods and algorithms have to be applied [88–90], but even a random parameter search be- fore starting the gradient method is a very important tech- nique to avoid local minima.
An example of this method is shown in Fig. 12 used for the multiple-oscillator parameterization of semicon- ductor nanocrystals [91]. A special global search method was used on the example of a measurement on nanocrys- talline silicon thin films deposited by low pressure chem- ical vapor deposition of Si on quartz. The optical model consisted of the above simple layer structure (nc-Si/quartz) using 19 parameters for the layer thicknesses and for the parameterization of the dielectric funcion of the nanocrys- tals. Every column of Fig. 12 represents one parameter as shown in the caption of Fig. 12.
Before the fitting process, all columns representing the normalized ranges of the model parameters are green, i.e.
fitted in an initial, quasi-arbitrarily chosen range. During the fitting process the random search method is utilized, which means that the values of the parameters are chosen randomly in the previously defined range. The large num- ber of points tested in a reasonably defined range can min- imize the chance finding a local minimum. However, de- pending on the number of parameters and the structure of the multi-dimensional error surface, getting in local min- ima cannot completely be avoided.
Completing the random search, the best 50 points (best parameter sets) are saved, represented by blue crosses.
Subsequently, the Levenberg-Marquardt gradient method is started to find the nearest minimum, which also provides information on the correlations and sensitivities of the pa- rameters (see the sensitivities plotted in Fig. 8). After a pre- defined number of tries we shrink the ranges based on the standard deviation of the best points so far. The red parts represent the excluded areas, in which no parameter values
Figure 12 Normalized values of fit parameters during a searching method used in Ref. [91]. The investigated sys- tem is an SiO2 film with embedded Si nanocrystals on a quartz substrate. d1and d2are the thicknesses of the pure SiO2layer and the SiO2with Si nanocrystalst. V% is the volume fraction of the nanocrystals, whereas the rest of the parameters correspond to the different oscillators that de- scribe the silicon nanocrystals.
are tested any more. The columns in full green correspond to fixed or coupled parameters.
To minimize the number of fit parameters the depen- dence of the data on time and wavelength should be pa- rameterized, of which only the latter has been utilized fre- quently (mainly for semiconductors [92]). Therefore, there is a large potential in the development of data evaluation methods and strategies.
8 Conclusions Optical methods are among the most powerful tools to in situ monitor solid-liquid interfaces due to the large penetration depth of light in liquids and glasses, as well as because of the high speed and the non- destructive capability. There are many configurations with different advantages and disadvantages depending on the purpose of the investigations. The size of the cell, the ma- terials of the surface layer, the angle of incidence and the wavelength of the resonance can be modified by careful flow-cell design. Compared to many optical techniques, the most important advantage of ellipsometry is that high- sensitivity spectroscopy can be utilized by simple instru- mentation (incoherent source, rotating polarizing element, lack of sensitivity to vibration or background noise from stray light, etc.). There are many further possibilities by nanostructured surfaces, multilayers, focusing with multi- channel capabilities, which shows that significant advances are expected in this field in the near future.
Acknowledgements Support from the National Develop- ment Agency grant of OTKA K115852 and M-ERA.NET Water- Safe is greatly acknowledged.
References
[1] K. Hingerl, Polarimetric and Other Optical Probes for the Solid-–Liquid Interface, in: Ellipsometry at the nanoscale, edited by M. Losurdo and K. Hingerl, (Springer, Berlin, Heidelberg, 2013).
[2] A. Nemeth, P. Kozma, T. H¨ulber, S. Kurunczi, R. Horvath, P. Petrik, A. Muskot´al, F. Vonderviszt, C. H˜os, M. Fried, J. Gyulai, and I. B´arsony, Sensor Letters8(2010).
[3] S. Kurunczi, A. Nemeth, T. Hulber, P. Kozma, P. Petrik, H. Jankovics, A. Sebestyen, F. Vonderviszt, M. Fried, and I. Barsony, Appl. Surf. Sci.257(1), 319 (2010).
[4] P. Kozma, D. Kozma, A. Nemeth, H. Jankovics, S. Ku- runczi, R. Horvath, F. Vonderviszt, M. Fried, and P. Petrik, Applied Surface Science257(16), 7160 (2011).
[5] R. M. A. Azzam and N. M. Bashara, Ellipsometry and Po- larized Light (Elsevier, 1977).
[6] M. Fried, T. Lohner, and P. Petrik, Ellipsometric character- ization of thin films, in: Handbook of Surfaces and Inter- faces of materials: ”Solid Thin Films and Layers”, edited by H. S. Nalwa, (Academic Press, San Diego, 2001).
[7] E. A. Irene, Sio2 films, in: Handbook of ellipsometry, edited by E. G. Irene and H. G. Tomkins, (William Andrew, Norwich, NY, 2005).
[8] H. Fujiwara, Spectroscopic Ellipsometry: Principles and Applications (Wiley, New York, 2007).
[9] D. E. Aspnes and A. A. Studna, Appl. Optics14(1), 220 (1975).
[10] J. Lee, P. I. Rovira, I. An, and R. W. Collins, Rev. Sci. In- strum.69, 1800 (1998).
[11] H. Fujiwara, J. Koh, C. R. Wronski, and R. W. Collins, Appl. Phys. Lett.70, 2150 (1997).
[12] J. Koh, Y. Lee, H. Fujiwara, C. R. Wronski, and R. W.
Collins, Appl. Phys. Lett.73, 1526 (1998).
[13] H. Elwing, Biomaterials19, 397 (1998).
[14] J. L. Keddie, Current Opinion in Colloid & Interface Sci- ence6(2), 102 (2001).
[15] K. Hinrichs and K. J. Eichhorn, [Springer Series in Surface Sciences] Ellipsometry of Functional Organic Surfaces and Films Volume 52, 2014).
[16] Abou-Ras D. et al., Microsc. Microanal.17, 728 (2011).
[17] P. Petrik, Journal of Physics: Conference Series 398, 012002 (2012).
[18] M. Fried, G. Juhasz, C. Major, P. Petrik, O. Polgar, Z. Hor- vath, and A. Nutsch, Thin Solid Films519(9), 2730 (2011).
[19] G. Jin, R. Jansson, and H. Arwin, Rev. Sci. Instr.67, 2930 (1996).
[20] L. Tapaszt´o, G. Dobrik, P. Lambin, and L. Bir´o, Nature Nanotechnology3(7), 397 (2008).
[21] S. Roy, S. Pereira, H. Urbach, X. Wei, and O. El Gawhary, Physical Review A96(1), 013814 (2017).
[22] N. Kumar, P. Petrik, G. K. P. Ramanandan, O. El, S. Roy, S. F. Pereira, W. M. J. Coene, and H. P. Urbach22(20), 4443 (2014).
[23] S. Roy, M. Bouwens, L. Wei, S. Pereira, H. Urbach, and P. Van Der Walle, Review of Scientific Instruments86(12), 123111 (2015).
[24] S. Roy, K. Ushakova, Q. Van Den Berg, S. Pereira, and H. Urbach, Physical Review Letters114(10), 103903 (2015).
[25] F. Wang, L. Liu, P. Yu, Z. Liu, H. Yu, Y. Wang, and W. J.
Li, Scientific Reports6(March), 1 (2016).
[26] A. Leong-Hoi, C. Hairaye, S. Perrin, S. Lecler, P. Pfeiffer, and P. Montgomery, Physica Status Solidi (A) Applications and Materials Science215(6), 1700858 (2018).
[27] P. Petrik, T. Lohner, M. Fried, J. Gyulai, U. Boell, R. Berger, and W. Lehnert, J. Appl. Phys.92, 2374 (2002).
[28] H. Arwin, Ellipsometry in life sciences, in: Handbook of ellipsometry, edited by E. G. Irene and H. G. Tomkins, (William Andrew, Norwich, NY, 2005), , 42.
[29] A. Shan, M. Fried, G. Juh´asz, C. Major, O. Polg´ar,
´A. N´emeth, P. Petrik, L. R. Dahal, J. Chen, Z. Huang, N. J.
Podraza, and R. W. Collins, IEEE Journal of Photovoltaics 4(1), 355–361 (2014).
[30] D. Gr¨otzsch, C. Streeck, C. Nietzold, W. Malzer, I. Man- touvalou, A. Nutsch, P. Dietrich, W. Unger, B. Beck- hoff, and B. Kanngießer, Review of Scientific Instruments 88(12), 123112 (2017).
[31] Y. Mikhaylova, L. Ionov, J. Rappich, M. Gensch, N. Esser, S. Minko, K. J. Eichhorn, M. Stamm, and K. Hinrichs, An- alytical Chemistry79(20), 7676–7682 (2007).
[32] J. Rappich, K. Hinrichs, G. Sun, and X. Zhang, Application of In-situ IR-Ellipsometry in Electrochemistry to Study Ultra-Thin Films, in: Ellipsometry of Functional Organic Surfaces and Films, edited by K. Hinrichs and K. J. Eich- horn, (Springer, Berlin Heidelberg, 2014).
[33] G. M. Hale and M. R. Querry, Applied Optics 12, 555 (1973).
[34] M. R. Querry, B. Curnutte, and D. Williams, Journal of the Optical Society of America59, 1299 (1969).
[35] A. Rothen, Rev. Sci. Instr.16, 26 (1945).
[36] B. Sheridan, D. S. Martin, J. R. Power, S. D. Barrett, C. I.
Smith, C. A. Lucas, R. J. Nichols, and P. Weightman, Phys- ical Review Letters85(21), 4618–4621 (2000).
[37] M. C. Cuquerella, C. I. Smith, D. G. Fernig, C. Edwards, and P. Weightman, Langmuir23, 2078 (2007).
[38] C. Goletti, G. Bussetti, A. Violante, B. Bonanni, M. Di Giovannantonio, G. Serrano, S. Breuer, K. Gentz, and K. Wandelt, Journal of Physical Chemistry C 119(4), 1782–1790 (2015).
[39] W. Ogieglo, H. Wormeester, K. J. Eichhorn, M. Wessling, and N. Benes, Progress in Polymer Science 42, 42–78 (2015).
[40] F. Kong, R. Kostecki, F. McLarnon, and R. Muller, Thin Solid Films313-314, 775–780 (1998).
[41] J. Lei, L. Li, R. Kostecki, R. Muller, and F. McLarnon, Journal of The Electrochemical Society 152(4), A774 (2005).
[42] M. A. McArthur, S. Trussler, and J. R. Dahn, Journal of the Electrochemical Society159(3), A198–A207 (2012).
[43] C. Cobet, K. Oppelt, K. Hingerl, H. Neugebauer, G. Kn¨or, N. S. Sariciftci, and J. Gasiorowski, The Journal of Physi- cal Chemistry C, acs.jpcc.8b08602.
[44] M. H. Chien, S. Vazquez-Miranda, R. Sharif, K. Hingerl, and C. Cobet, Journal of Physical Chemistry C122, 8984–
8997 (2018).
[45] H. G. Tompkins, A User’s Guide to Ellipsometry (Aca- demic Press, 1993).
[46] P. Petrik, Characterization of Nanocrystals Using Spectro- scopic Ellipsometry, in: Nanocrystals - Synthesis, Charac- terization and Applications, edited by S. Neralla, (InTech, 2012).
[47] P. Petrik and M. Fried, Ellipsometry of semiconductor nanocrystals, in: Ellipsometry at the nanoscale, edited by M. Losurdo and K. Hingerl, (Springer, Berlin, Heidelberg, 2013).
[48] P. Petrik, Solar cells with photonic and plasmonic struc- tures, in: Characterization of Photovoltaic Materials and Devices by Spectroscopic Ellipsometry, edited by H. Fu- jiwara and R. W. Collins, (Springer, 2018).
[49] M. Fried, T. Lohner, W. A. M. Aarnink, L. J. Hanekamp, and A. van Silfhout, J. Appl. Phys.71, 2835 (1992).
[50] P. Petrik, O. Polg´ar, M. Fried, T. Lohner, N. Kh´anh, and J. Gyulai, J. Appl. Phys.93, 1987 (2003).
[51] H. Arwin, Appl. Spectrosc.40(3), 313 (1986).
[52] K. Flock, Thin Solid Films455-456, 349–355 (2004).
[53] D. E. Aspnes, A. A. Studna, and E. Kinsbron, Phys. Rev. B 29, 768 (1984).
[54] H. Arwin and D. Aspnes, Thin Solid Films113(2), 101–
113 (1984).
[55] I. An, J. Lee, B. Hong, and R. Collins, Thin Solid Films 313-314, 79–84 (1998).
[56] D. E. Aspnes, Applied Physics Letters 62(4), 343–345 (1993).
[57] H. Fujiwara, J. Koh, and R. Collins, Thin Solid Films313- 314, 474–478 (1998).
[58] J. A. De Feijter, J. Benjamins, and F. A. Veer, Biopolymers 17, 1759 (1978).
[59] H. Arwin, Sensors and Actuators, A: Physical92, 43–51 (2001).
[60] H. Arwin, S. Welin-Klintstr¨om, and R. Jansson, Journal of Colloid And Interface Science156, 377 (1993).
[61] E. Strein and D. Allred, Thin Solid Films517, 1011 (2008).
[62] J. A. Van Den Berg, M. A. Reading, A. Parisini, M. Kolbe, B. Beckhoff, S. Ladas, M. Fried, P. Petrik, P. Bailey, T. Noakes, T. Conrad, and S. D. Gendt, ECS Transactions 25, 349 (2009).
[63] P. Petrik, T. Gumprecht, A. Nutsch, G. Roeder, M. Lem- berger, G. Juhasz, O. Polgar, C. Major, P. Kozma, M. Janosov, B. Fodor, E. Ag´ocs, and M. Fried, Thin Solid Films541, 131 (2013).
[64] B. Kalas, B. Pollakowski, A. Nutsch, C. Streeck, J. N´ador, M. Fried, B. Beckhoff, and P. Petrik, physica status solidi (c)14, 1700210 (2017).
[65] A. Nabok and A. Tsargorodskaya, Thin Solid Films516, 8993 (2008).
[66] T. M. Byrne, S. Trussler, M. A. McArthur, L. B. Lohstreter, Z. Bai, M. J. Filiaggi, and J. R. Dahn, Surface Science603, 2888 (2009).
[67] R. Moirangthem, Y. Chang, and P. Wei, Biomedical Optics Express2, 2569 (2011).
[68] A. G. Al-Rubaye, A. Nabok, and A. Tsargorodska, Sensing and Bio-Sensing Research12(02), 30 (2017).
[69] B. Spackova, P. Lebruskova, H. Sipova, P. Kwiecien, I. Richter, and J. Homola, Plasmonics9(08), 729 (2014).
[70] J. N´ador, B. Kalas, A. Saftics, E. Ag´ocs, P. Kozma, L. Ko- rosi, I. Sz´ek´acs, M. Fried, R. Horv´ath, and P. Petrik, Opt.
Express24(5), 4812 (2016).
[71] T. Kang, Y. Niu, and G. Jin, Thin Solid Films571(11), 463 (2014).
[72] L. Wang, C. Zhao, M. H. Duits, F. Mugele, and I. Siretanu, Sensors and Actuators B: Chemical210(04), 649 (2015).
[73] B. Kalas, J. N´ador, E. Ag´ocs, A. Saftics, S. Kurunczi, M. Fried, and P. Petrik, Applied Surface Science421, 585 (2017).
[74] F. Abel´es, Surface Science56, 237 (1976).
[75] P. Westphal and A. Bornmann, Sensors and Actuators B:
Chemical84, 278 (2002).
[76] D. Sofikitis, K. Stamataki, M. A. Everest, V. Papadakis, J. L. Stehle, B. Loppinet, and T. P. Rakitzis, Opt. Lett.
38(8), 1224–1226 (2013).
[77] A. Sinibaldi, A. Anopchenko, R. Rizzo, N. Danz, P. Mun- zert, P. Rivolo, F. Frascella, S. Ricciardi, and F. Michelotti, Anal. Bioanal. Chem.407(14), 3965–3974 (2015).
[78] B. Kalas, A. Romanenko, A. Saftics, K. Ferencz, E. Toth, M. Fried, F. Vonderviszt, and P. Petrik, unpublished (2018).
[79] M. M. Giangregorio, G. V. Bianco, P. Capezzuto, G. Bruno, and M. Losurdo, Thin Solid Films571, 478 (2014).
[80] R. S. Moirangthem, M. T. Yaseen, P. K. Wei, J. Y. Cheng, and Y. C. Chang, Biomedical Optics Express3, 899 (2012).
[81] J. N´ador, N. Orgov´an, M. Fried, P. Petrik, A. Sulyok, J. J.
Ramsden, L. Korosi, and R. Horv´ath, Colloids and Sur- faces B: Biointerfaces122, 491 (2014).
[82] L. K˝or¨osi, S. Papp, V. Hornok, A. Oszk´o, P. Petrik, D. Patko, R. Horvath, and I. D´ek´any, Journal of Solid State Chemistry192, 342 (2012).
[83] E. Ag´ocs, P. Kozma, J. N´ador, A. H´amori, M. Janosov, B. Kalas, S. Kurunczi, B. Fodor, E. Ehrentreich-F¨orster, M. Fried, R. Horv´ath, and P. Petrik, Applied Surface Sci- ence421, 289 (2017).
[84] J. Noordmans, H. Wormeester, and H. J. Busscher, Col- loids and Surfaces B: Biointerfaces15(3), 227 (1999).
[85] F. H¨o¨ok, J. V¨or¨os, M. Rodahl, R. Kurrat, P. B¨oni, J. Rams- den, M. Textor, N. Spencer, P. Tengvall, J. Gold, and B. Kasemo, Colloids Surf B Biointerfaces 24(2), 155 (2002).
[86] E. Bittrich, K. Rodenhausen, K. Eichhorn, T. Hofmann, M. Schubert, M. Stamm, and P. Uhlmann, Biointerphases 5(4), 159 (2010).
[87] P. Kozma, A. Hamori, S. Kurunczi, K. Cottier, and R. Hor- vath, Sensors and Actuators B Chemical 155(07), 446 (2011).
[88] O. Polg´ar, M. Fried, T. Lohner, and I. B´arsony, Surface Science457, 157 (2000).
[89] O. Polg´ar, P. Petrik, T. Lohner, and M. Fried, Applied Sur- face Science253, 57 (2006).
[90] O. Polg´ar, M. Fried, N. Khanh, P. Petrik, and I. Barsony, Phys. Stat. Sol. (c)5, 1354 (2008).
[91] E. Ag´ocs, A. G. Nassiopoulou, S. Milita, and P. Petrik, Thin Solid Films541, 83–86 (2013).
[92] P. Petrik, Physica B: Condensed Matter453, 2 (2014).
![Figure 1 The optical properties of water from [33,34] and the calculated penetration depth of light in water](https://thumb-eu.123doks.com/thumbv2/9dokorg/1323194.106697/3.892.83.435.137.518/figure-optical-properties-water-calculated-penetration-depth-light.webp)
![Figure 6 Sensitivity in a plasmon-enhanced Kretschmann geometry using only the amplitude information (fitting only on the ellipsometric angle of ) or both the amplitude and phase information (fitting on both and ) [73].](https://thumb-eu.123doks.com/thumbv2/9dokorg/1323194.106697/5.892.89.427.494.755/sensitivity-enhanced-kretschmann-amplitude-information-ellipsometric-amplitude-information.webp)
![Figure 7 Enhanced electric field using a Bragg multi- multi-layer [77] [subfigures (a)-(c)], and its realization in a hemi-cylindrical Kretschmann geometry [78] [subfigure (d)].](https://thumb-eu.123doks.com/thumbv2/9dokorg/1323194.106697/6.892.90.430.328.840/enhanced-electric-subfigures-realization-cylindrical-kretschmann-geometry-subfigure.webp)
![Figure 9 Atomic force microscope image of a silicon wafer covered with a titanate nanotube layer [82] utilized as a sensor surface [81].](https://thumb-eu.123doks.com/thumbv2/9dokorg/1323194.106697/7.892.459.810.132.453/figure-atomic-microscope-silicon-covered-titanate-nanotube-utilized.webp)
![Figure 12 Normalized values of fit parameters during a searching method used in Ref. [91]](https://thumb-eu.123doks.com/thumbv2/9dokorg/1323194.106697/8.892.466.805.138.416/figure-normalized-values-parameters-searching-method-used-ref.webp)
