Altering periphery at the border: measuring the border effect in the Hungarian- Romanian and the Hungarian-Ukrainian border zones
1Szabolcs PÁSZTOR2, János PÉNZES3
Abstract. The paper focuses on the empirical confirmation of the so called deborderisation process along the Hungarian and particularly the eastern Hungarian borders. This tendency has been spurred by a number of factors: globalisation tendencies, regional integration, multinational companies and foreign direct investments, etc. so an analysis like this could evaluate many of them as well. To conduct the research the authors make a special algorithm in which they want to test the macro and micro economic effects of the disappearing borders. According to the results the deborderisation process in CEE and in the Hungarian context is verifiable but it shows significant heterogeneity. The eastern borders of Hungary have also different patterns and the role of the European integration is obvious as the Hungarian-Romanian border has a lesser role in distorting the economic interactions.
Keywords: deborderisation, Hungary, eastern borders, gravity approach and method of approximation, Law of One Price
Introduction
The Central and Eastern European (CEE) region including Hungary has seen massive economic, social and structural changes since the beginnings of the 1990’s. The intense shockwaves made by the general transformation affected almost every part of the economic and social framework not only within but between countries too. With the disintegration of former states, new ones emerged as well, several multinational companies turned up and thanks to the enormous capital inflows and – in parallel with the faltering of previous trade links – new relations were taking shape. It was a unique concidence that these tendencies were gaining ground right exactly when the overall globalisation of the world economy, the European integration and the disappearance of the previously isolating borders were the order of the day.4 Thanks to these parallel and to a certain extent related tendencies, the countries of CEE at the turn of the millennium show a strong economic and trade relation network with each other and the world economy. As a consequence, they are regarded as completely open economies.
Hungary’s general geographic and economic state is particulary interesing in this new relation.
On the one hand, it became a kind of border country5 after the transformation of the 1990’s and on the other hand, the largest part of the gross domestic product (GDP) is directly related to the settled multinational companies. In addition the European Union (EU) accession in 2004 and the enlargement of the Schengen Zone in 2007 strongly contributed to setting a hypothesis: Hungary is such an open, small economy where the economic interactions and the individuals’ lives are less and less influenced by the isolating state borders.
However, it is worthwhile to point to those studies which highlights the bottlenecks of economic interactions even in case of totally interdependent and open countries.6 A large number of academic papers proves for example the existence of border effect which represents the difference between intra-national and inter-national trade and price distortions.7 The findings are clear and point to one direction. In the American context for example8, in the US-Canadian relation9, in the EU
1 „This research was realized in the frames of TÁMOP 4.2.4. A/2-11-1-2012-0001 „National Excellence Program – Elaborating and operating an inland student and researcher personal support system convergence program” The project was subsidized by the European Union and co-financed by the European Social Fund.”
2 University of Debrecen, Hungary
3 University of Debrecen, Hungary
4 Kenichi Ohmae, The End of the Nation State: The Rise of Regional Economies, (London: Free Press, 1995), 17.
5 Zoltán Hajdú, “A határon átnyúló együttműködés potenciális lehetőségei Magyarország EU-csatlakozása után”, in: A régiók szerepe a bővülő Európai Unióban, ed Gyula Horváth (Pécs: MTA RKK, 2000), 165.
6 William Collier and Roger Vickerman, “Labour Markets in EU Border Regions: The Case of Kent and Nord-Pas de Calais”, CERTE University of Kent at Canterbury Working Paper 1 (2001): 8.; Marius Brülhart, “The Spatial Effects of Trade Openness: A Survey”, Review of World Economics 147, 1 (2011): 61. inter alia
7 Mahbub Morshed, “Is there really a „border effect”?”, Journal of International Money and Finance 26, 7. (2007): 1235.
8 Holger C. Wolf, “Intranational home bias in trade”, The Review of Economics and Statistics 82, 4. (2000): 560.; Keith Head and Thierry Mayer, “Illusory border effects: Distance mismeasurement inflates estimates of home bias in trade”, Centre
countries10 and in another relations11 confirms the fact the role of state borders affecting economic interactions disappears very slowly or remains strong even in the long run. This feature comes from certain explaining factors: different languages, cultures, mentalities, lack of common currency, asymmetric economic relations, home bias in consumption, etc.
Bearing this in mind, at first it could be highly interesting the test our initial hypothesis and later shed some light on the existence and strength of the border effect along the Hungarian borders.
Finally, analising the heavily transforming easthern borders of Hungary (Hungary-Ukraine and Hungary-Romania) could give us a special insight into the effect of enlargement of the EU and the Schengen Zone in the deborderisation process. These borders represent a gate to the European integration and as a consequence Hungary enjoys a kind of protective status.12 A complete analysis of this kind could not leave out the evaluation of that European integration which could play a significant role in integrating the neighbouring countries and border zones.
This paper has two aims. First of all, it tries to answer the above mentioned questions then it intends to broaden the so far quite poor empirical findings of the Hungarian border effect. After the brief introduction, the theoretical approach of the research is presented and we specify the exact research area and the available data. Finally, we draw some conclusions.
Methodological framework13
We try to present the deborderistation process of CEE and Hungary with the help of a unique, complex method with which we deliberately want to contradict to those one-sided approaches which are extremely popular and abundant in the social sciences.14
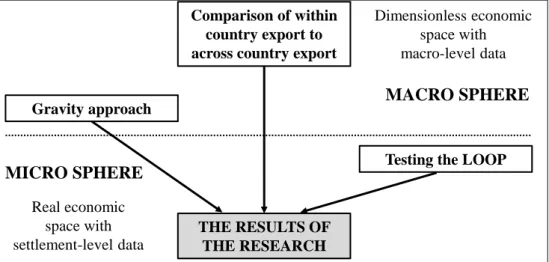
In our research we use different databases, data and non-related statistical methods in a well- defined research algorithm (Figure 1). With this approach we try to describe the main focus of this paper in the most consistent way.
This research algorithm points to several essential facts. First of all, it begins with a method using few data and dimensionless economic space then uses a large number of data from settlement- level. In an other aspect it analyses the existence of border effect at macro and micro level as well.
When creating the methodological approach we placed a huge emphasis on this dual interpretation since according to Fernand Braudel there is a so called double history phenomenon in our everyday life. This idea makes differentiation between the changes at the level of small-scale and public life where macro and micro economic trends are the order of the day. The micro level is characterised by
d’Etudes Prospectives et d’Informations Internationales (CEPII), Paris, Working Paper 1 (2002): 23.; Cletus C. Coughlin and Dennis Novy, “Is the International Border Effect Larger than the Domestic Border Effect? Evidence form U.S. Trade”, Research Division Federal Reserve Bank of St. Louis, Working Paper Series, St. Louis, 2009-057C (2011): 3. inter alia
9 John McCallum, “National Border Matter: Canada-US Regional Trade Patterns”, American Economic Review 85, 3 (1995):
618.; John Helliwell, How Much do National Borders Matter? (Washington DC.: The Brookings Institution Press, 1998), 131. Michael A. Anderson and Stephen L. S. Smith, “Canadian provinces in world trade: engagement and detachment”, Canadian Journal of Economics 32 (1999): 27. inter alia
10 Volker Nitsch, “National Borders and International Trade: evidence from the European Union”, Canadian Journal of Economics 22, 4 (2000): 1095.; Keith Head and Thierry Mayer, “Non-Europe: The Magnitude and Causes of Market Fragmentation in Europe. Weltwirtschafltliches Archiv 136, 2, (2000): 29. Natalie Chen, “Intra-national versus international trade in the European Union: why do national borders matter?” Journal of International Economics 63, 1 (2004): 101.;
Narcissa Balta and Juan Delgado, “Home Bias and Market Integration in the EU”, CESifo Economic Studies 55. 1. (2009):
125.; Consuelo Pacchioli, “Is the EU internal market suffering from an integration deficit? Estimating the ’home-bias effect’”, CEPS Working Document 348 (2011): 23.
11 Morshed, 1230.; Kyoji Fukao and Toshihiro Okubo, “Why Has the Border Effect in the Japanese Machinery Sectors Declined?: The Role of Business Networks in East Asian Machinery Trade”, Journal of Economic Integration, Center for Economic Integration, Sejong University 26 (2011): 659.
12 The Hungarian borders are 2242.4 km long. The Hungarian-Ukrainian (136.7 km), the Hungarian-Romanian (447.8 km), the Hungarian-Serbian (174.4 km) and the Hungarian-Croatian (344.6 km) borderlines belong to the external Schengen Zone.
13 This part does not want to give a comprehensive overview about the methods used in border research like Tagai et. al.
[Gergely Tagai et. al., “Methods of the Analysis of Integration Effect on Border Areas: The Case Of Hungary” Eurolimes 6, 2 (Autumn 2008): 150.] instead it intends to describe the methodology of our own research.
14 Tamás Szentes, Ki, mi és miért van válságban?, (Budapest: Napvilág Kiadó, 2009), 12.; Tamás Szentes, “Tények, adatok és mutatószámok felhasználásának anomáliái”, Köz-gazdaság 8, 1 (2013): 10.; László Csaba, “Kérdőjelek a közgazdaságtanban és oktatásában”, Közgazdasági Szemle 60, 1 (January 2013): 49.
slow and small-scale changes (history of individuals and everyday life) while the macro level (political, economic and social events and the history of intellectual movements) is just the opposite.15
Comparison of within country export to across country export
Dimensionless economic space with macro-level data
Gravity approach
Testing the LOOP
THE RESULTS OF THE RESEARCH Real economic
space with settlement-level data
MACRO SPHERE
MICRO SPHERE
Figure 1 The algorithm of the research Source: edited by the authors
An approach like ours is capable of describing both of them so we could get an insight into the process of macro tendencies appearing in the individuals’ life and the transformation of the narrowly- defined economic space and last but not least into the deborderisation process. The outlined algorithm in the mirror of the above mentioned consists of three approaches (Figure 1). With the help of the gravity approach and the comparison of internal and external export the macro level could be modelled while the so called Law of One Price (LOOP) is good for describing the transformation of the micro level.
1. Gravity approach
Jan Tinbergen16 created the gravity approach in this economic field with which the analysation of bilateral trade tendencies became possible. Similar to other concepts the gravity approach also comes from physics and based on the Newtonian laws it supposes direct positive relation between the size of an economy and its absorbing potential. This means that a relatively big economy generates considerable trade in its neighbourhood which drops significantly with the increasing distance from the partners. So the gravity model argues that trade between two countries depends on the economic development (positive) and relative distance (negative).
The approach was used entirely to estimate the total trade between two countries for many years so the general format of the gravity model was the following:
𝑇
𝑖𝑗= 𝐴 ∙ 𝑌
𝑖∙ 𝑌
𝑗∙ 𝐷
𝑖𝑗 Ɵ1
In this equation Tij represents the total trade between countries, Yi and Yj the GDP of certain countries and Dij the distance between the countries in question. The A is a constant, namely the gravity constant, while Ɵ is such a negative index which indicates the decreasing trade volume by the increasing distance.
Later it became obvious that those borderlines which isolate borderlands play an important role in restricting the natural increase of total trade. No wonder that those researchers who had dealt with this issue tried to extend and refine the general gravity model in order to better understand the exsistence of borders and border effect. They incorporated such dummy variables like border, currency, language, adjacency, internal and external trade and as a consequence it became a general
15 See: Fernand Braudel, Anyagi kultúra, gazdaság és kapitalizmus, XV-XVIII. század. (Budapest: Gondolat, 1985), 24.;
Fernand Braudel, A Földközi-tenger és a mediterrán világ II. Fülöp korában. I-III. kötet. (Budapest: Akadémiai Kiadó–
Osiris, 1996), 18.; Fernand Braudel, Franciaország identitása I-II. (Budapest: Helikon, 2003–2004), 71.; Fernand Braudel, A kapitalizmus dinamikája. (Budapest: Európa Könyvkiadó, 2008), 21.
16 Jan Tinbergen, “Shaping the World Economy”, (New York: The Twentieth Century Fund, 1962), 108.
tendency that the application of a large number of statistically significant variables could lead to more and more exact results.17 For the sake of example an extended gravity approach in loglinear format is represented:
ln 𝑋
𝑖𝑗= 𝛽
0+ 𝛽
1ℎ𝑜𝑚𝑒 + 𝛽
2ln 𝑌
𝑖+ 𝛽
3ln 𝑌
𝑗+ 𝛽
4𝑎𝑑𝑗
𝑖𝑗+ + 𝛽
5𝑐𝑢𝑟
𝑖𝑗+ 𝛽
6𝑙𝑎𝑛
𝑖𝑗+ 𝛽
7ln 𝐷
𝑖𝑗+ 𝜀
𝑖𝑗(2)
In this model the home is such a dummy variable which indicates the internal or external trade.
The adjij illustrates the adjacency. The curij refers to the currency, the lanij to the language, the ɛij is the white noise error. The parameter β1 is the measure of the border effect and this incorporates everything which could trigger bigger intra national trade than inter national trade. Putting differently, β1 is such a degree which shows the difference between internal and external trade placing the gravity model on a more exact ground.
Using this approach a number of studies were made and these expressly conducted research on the phenomenon of border effect and the vision for the future of borderlands.18 In addition, Anderson and van Wincoop19 evolved a completely special gravity model which became well-known and widespread.20 As a consequence, we can draw the conclusion that the different gravity models strongly dominate the border research and the mapping of the exact effects of the deborderisation process.
In our own model not every previously mentioned variables are involved because Hungary and its neighbouring countries have special location, history, society and the individual countries show special features.21 Taking these into consideration we intend to use the following model:
ln 𝑋
𝑖,𝑗= 𝛽
0+ 𝛽
1ℎ𝑜𝑚𝑒 + 𝛽
2ln 𝑌
𝑖+ 𝛽
3𝑙𝑛𝑌
𝑗+ 𝛽
4ln 𝐷
𝑖,𝑗+ 𝛽
5𝑎𝑑𝑗 + 𝜀
𝑖,𝑗(3)
In this loglinear equation we focus on the sign, magnitude and over time change of the variable home which could perfectly illustrate the main features of the deborderisation process.
2. Methods of approximation
After analysing the national level where general tendencies are taken into consideration, it worth narrowing the spatial focus of our research and describe the border effect along a country (in our case Hungary). However conducting such an analysis is impossible with the gravity approach because the statistical offices of Hungary and the neighbouring countries do not record intra national, regional level trade flows. In order to approximate the missing data and describe the phenomenon we have to turn to the methods of approximation.
Among these techniques the most popular one is that approach in which the regional trade flows are estimated by calculating the difference between the annual GDP and the total export of a country.22 In addition when we divide the difference by the total export value of a bilateral destination we can measure the ratio of within and across country export (4). This indicator clearly shows us the level of export within a country and across its borders.
17 McCallum, 618.; Ulrike H. Meinhof et. al., “Border Discourse: Changing Identities, Changing Nations, Changing Stories in European Border Communities”, (Periodic Progress Report, Project No: SERD-1999-00023, 2003), 43.; Alessandro Olper and Valentina Raimondi, “Agricultural market integration in the OECD: A gravity-border effect approach”, Food Policy 33, 2 (2008): 168.
18 Shang-Jin Wei, “Intra-National versus International Trade: How Stubborn are Nations in Global Integration?”, Cambridge (Mass) NBER Working Paper 5531 (1996): 19.; Nitsch, 1096.; Wolf, 558.; Head and Mayer, “Non-Europe: The Magnitude and Causes of Market Fragmentation in Europe”, 290.; Head and Mayer, “Illusory border effects: Distance mismeasurement inflates estimates of home bias in trade”, 13.; Chen, 97. inter alia
19 James A. Anderson and Eric van Wincoop, “Gravity with Gravitas: A Solution to the Border Puzzle”, NBER Working Paper 8079 (2001): 17.; James A. Anderson and Eric van Wincoop, “Trade Costs”, The Journal of Economic Literature 42, 3 (2004): 696.
20 Robert C. Feenstra, “Border Effect and the Gravity Equation: consistent methods for estimation”, Scottish Journal of Political Economy 49, 5 (2002): 27.; Marie Daumal and Soledad Zignago, “The Border Effects in Brazil (preliminary version) (2005)”, www.dauphine.fr/globalisation/daumal2.pdf
21 It would be meaningless to use the dummy variable of common language since the in countries of CEE they speak different languages.
22 Wei, 14.; Nitsch, 1093.; Head and Mayer, 289.; Chen, 98. inter alia
𝐵𝑜𝑟𝑑𝑒𝑟 𝑒𝑓𝑓𝑒𝑐𝑡 = 𝐺𝐷𝑃 − 𝑇𝑜𝑡𝑎𝑙 𝑒𝑥𝑝𝑜𝑟𝑡 𝑇𝑜𝑡𝑎𝑙 𝑏𝑖𝑙𝑎𝑡𝑒𝑟𝑎𝑙 𝑒𝑥𝑝𝑜𝑟𝑡 (4)
When this indicator is relatively high the borders significantly restrict the international trade flows and when it is low the deborderisation process in well underway and there are intense economic interactions across borders.
Based on the approximating feature we have to see the following two aspects. The ratio is suitable for understanding the specific tendencies and magnitudes however it is just to a certain extent capable of measuring the exact border effect. It is because the approximation of within country export as the difference of GDP and total export is too simplistic an in order to get a more nuanced picture of the border effect measure we definitely need a bigger database. This lack of exactness could lead us to test the LOOP which is based on large database and capable of representing spatial data.
3. Law of One Price (LOOP)
There is an alternative method to measure the border effect and the deborderisation process:
the LOOP.23 The initial presumption of this approach is the following: in an efficient market the price of a product or a service expressed in local currency equals to the multiplication of the price of the same items in foreign currency and the exchange rate between the two currencies. This concept, namely the testing of purchasing power parity (PPP), was first used at the time of the Napoleonic wars however it was Cassel24 who coined the name. This method makes a differentiation between the absolute and relative PPP. According to the absolute form the price ratio of consumer goods in two randomly chosen countries approximates the equilibrium exchange rate. The relative PPP theory argues that the fluctuation of relative prices equals to the fluctuation of exhange rate when we choose such a period as a basic when the exchange rate was in balance.
When testing the LOOP they usually compare the within country prices – Dusek25 compares for example the beer prices in Hungary – and later the between country prices. In case of bigger standard deviation the explanatory factors could be detected by a multi-variable regression analysis.26
It was Engel and Rogers27 who called the attention to the possible application of the LOOP in border research. Their paper gave the idea and methodological approach others like Horváth et al28 and us a good starting point. As Engel and Rogers29 in our model we suppose that the product level relative price is the real exchange rate:
𝑄
𝑥,𝑦,𝑡𝑎= 𝑃
𝑥,𝑡𝑎𝑃
𝑦,𝑡𝑎5
Here the 𝑃𝑥,𝑡𝑎 is the nominal price of product a, in location x, at time t. 𝑃𝑦,𝑡𝑎 is also the nominal price of product a, in location y, at time t. The a indicates the different products and x, y the different data points. In order to understand the time-series variability of the relative prices we have to measure its within country and between country standard deviation:
𝜎 𝑞
𝑥,𝑦𝑎(6)
where𝑞
𝑥,𝑦𝑎= ln 𝑄
𝑥,𝑦𝑎(7)
23 Janet Ceglowski, “The law of one price: intranational evidence for Canada”, Canadian Journal of Economics 36, 2 (2003):
375.
24 Gustav Cassel, “Abnormal deviations in international exchanges”, The Economic Journal 28 (December 1918): 414.
25 Tamás Dusek, “Vásárlóerőparitások, területi árkülönbségek, sörárak”, Comitatus 18, 3 (September-October 2008): 73-82.
26 Pinelopi Koujianou Goldberg and Frank Verboven, “The Evolution of Price Dispersion in the European Car Market”, Review of Economic Studies 68, 4 (October 2001): 815.; David C. Parsley, and Shang-Jin Wei, “Explaining the Border Effect: The Role of Exchange Rate Variability, Shipping Costs, and Geography”, Journal of International Economics 55, 1 (2001): 92.; Jonathan Haskel and Holger C. Wolf, “Law of One Price – A Case Study”, Scandinavian Journal of Economics 103, 4 (2001): 549.; Morshed, 1231.; Julius Horváth et. al., “The border effect in small open economies”, Economic Systems 32, 1 (2008): 36. inter alia
27 Charles Engel and John H. Rogers, “How wide is the border?” American Economic Review 86, 5 (1996): 1112-1125.
28 Horváth et. al., 37.
29 Engel and Rogers, 1115.
When the between country standard deviation is systematically bigger than the within country one it is highly important to shed some light on the explanatory factors. In order to reach this goal we use the following multi-variable regression equation:
𝜎
𝑥,𝑦,𝑡𝑎= 𝛽
0+ 𝛽
1𝐻𝐴𝑇
𝑥,𝑦+ 𝛽
2ln 𝑑
𝑥,𝑦+ 𝜀
𝑥,𝑦𝑎(8)
In this model we try to explain the standard deviation between the different data points by two factors. First of all, we take into consideration the data pairs. If it falls into one country then the dummy HAT is zero, otherwise one. The other factor is the distance between locations since the bigger transportation requirements obviously increase the retail prices.30
As the next step we try to understand the role of nominal exchange rate in the existence of border effect. If we filter the price variability out of the nominal exchange rate the border effect could be much better understood. This is definitely needed because the real exchange rate is the sum of price ratio of cross-border data points and the fluctuation of nominal exchange rate. Putting differently, the real exchange rate is such an exchange rate which takes into consideration the different inflation rate of the two partner countries. In case of rigid local prices in the short run, the fluctuation of the exchange rate reflects the fluctuation of the nominal exchange rate. In order to incorporate the role of nominal exchange rate in the within and between country relative prices we have to correct our previous approach of relative price (5). To carry out this we calculate the ratio of local price 𝑃𝑥,𝑡𝑎 and the national price level 𝑃𝑡 . Later we calculate those relative real prices which represent the cross- border data points 𝑃𝑥,𝑡𝑎 and 𝑃𝑦,𝑡𝑎 and the general price indices representing the two countries 𝑃𝑡 and 𝑃𝑡∗ (9):
𝑃
𝑥,𝑡𝑎𝑃
𝑡𝑃
𝑦,𝑡𝑎𝑃
𝑡(9)
Finally with the help of restructuring the sample, we could evaluate other explanatory factors as well. For example, it is worthwhile to restrict our database to those border regions which economies and societies are severely influenced by national borders.31 In this way we can test the notion of double history by Braudel and confronting the macro and micro level border effect is also possible. The database offers an other alternative since it lets to incorporate the special features of the economic history of Hungary, Ukraine and Romania. It is higly important because the Trianon border and the partly common language in certain regions must be taken into account. We can evaluate these factors if we restrict the Ukrainian and Romanian data points to those settlements which previously – before the First World War – belonged to Hungary. This sample correction provides to measure the effect of partly common history and language in the border effect.
The research area and the available data
In our gravity approach Hungary and the neighbouring countries (Austria, Slovakia, Ukraine, Romania, Serbia, Croatia and Slovenia) are taken into consideration (Figure 2). A research like this could prove the deborderisation process in the narrower economic space of Hungary.
To conduct the research we used the nominal GDP of the countries in question between 2001 and 2011. These data were received from the World Bank (WB) database.32 The bilateral trade data is from the United Nations Commodity Trade Statistics Database (UN COMTRADE) database.33 In
30 Anne-Célia Disdier and Keith Head, “The puzzling persistence of the distance effect on bilateral trade”, The Review of Economics and Statistics 90, 1 (2008): 44.
31 Niles Hansen, “Border Regions: A Critique of Spatial Theory and a European Case Study”, Annals of Regional Science, 11, 1 (1977): 8.
32 World Bank, “GDP data (current USD, by countries)”, http://data.worldbank.org/indicator/NY.GDP.MKTP.CD
33 UN COMTRADE, “Total and bilateral export volumes of countries”, http://comtrade.un.org/db/dqBasicQuery.aspx
order to calculate the intra national trade we used the previously mentioned approach: the difference between GDP and total export. When calculating the distance between countries we took into consideration the distance between the capitals. It is widely-known that the observed counties are typical single-centred economies where the production and consumption is clustered around the capitals. To calculate the distance we used the Great Circle Distance (GCD)34 internet application which uses the geographical coordinates of locations. In case of the within country distances we used the Leamer35 method.
Figure 2 The geographic focus of the gravity approach Source: edited by the authors
In case of the method of approximation we used entirely the STADAT database of the Hungarian Central Statistical Office (HCSO).36 The previously mentioned border effect indicator was calculated by the GDP and the total and bilateral export data for the period of 2001 and 2011. Here the same geographic reasearch area was taken into consideration like in the above mentioned case.
To test the LOOP and the deborderisation of the eastern borders of Hungary a much larger database was required. Here we used the data of the HCSO, the Ukrainian Statistical Office (USO) and the Romanian Statistical Office (RSO).37 The data contained narrowly defined consumer items and their retail prices.38 With the retail prices we could record those transaction prices which the consumers had to pay including every tax and duties. So we did not use price indices instead we preferred real and absolute data which describe the real transaction prices. In addition this method is suitable for describing the deborderisation process at micro level where the basic economic interactions are taking place. We used a unique, detailed three-dimensional data panel in our research
34 GCD, “Great Circle Distance Calculator by Ed Williams”, www.williams.best.vwh.net/gccalc.htm
35 Edward E. Leamer, “Access to western markets, and eastern effort levels”, in: Lessons from the Economic Transition:
Central and Eastern Europe in the 1990s, ed Salvatore Zecchini. Norwell: Massachusetts: Kluwer Academic Publishers, 1997), 511.
36 KSH, “STADAT tables”, http://www.ksh.hu/docs/hun/xstadat/xstadat_eves/i_qkt009b.html
37 Let us say thanks here for Borbála Mináry (HCSO), for Mykola Afanasiev (USO), for Maria Radulescu and Corina Maftei (RSO) for their tremendous help in collecting the data.
38 In order to compare the prices we converted them into USD for which we used the official average excange rate recorded on a monthly bases by the national banks.
in which 21 items and their retail prices are listed.39 It has to be mentioned that the list of items in the research was shaped by two important factors. First, it had had to be taken into account the different data recording methodologies of the statistical offices and secondly we had had to find homogeneous products not just within but between countries as well.
These items and their prices are recorded in several stores in different administrative units and settlements by the employees of the central statistical offices. These stores are selected centrally taking into consideration settlement and regional level representativeness so after calculating the arithmetic mean the retail prices are easily comparable. The transportation costs which play a significant role in the variability of relative prices were calculed with the help of the ArcView GIS 3.2 Network Analyst program.40 The distance was interpreted as the road distance between the settlements (regional centres).
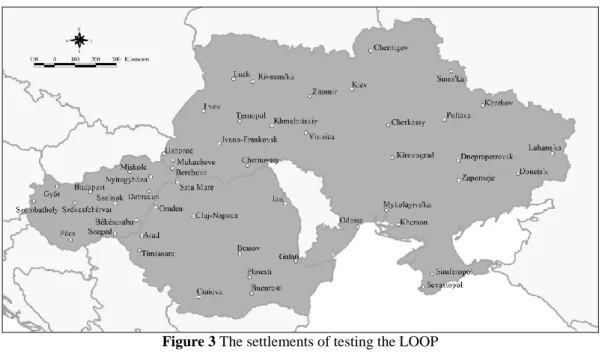
The research covers the period of January 2007 and December 2011 so it comprises 60 month.
It includes 11 Hungarian, 11 Romanian and 28 Ukrainian settlements (data points) (50 altogether) (Figure 3).41
Figure 3 The settlements of testing the LOOP Source: edited by the authors
This means that altogether in Hungary and in Romania equally 13,860 and in Ukraine 35,280 observations are available which constitutes to 63,000 input data. When making settlement pairs we have 55 Hungarian, 55 Romanian and 378 Ukrainian observations and in a single month 1,155 Hungarian, 1,155 Romania and 7,938 Ukrainian data are at hand. In case of cross-country analysis, in the Hungarian-Romanian relation 2,541 and in the Hungarian-Ukrainian relation 6,468 pairs are available in a single month. So to understand the deborderisation process of the easthern borders of
39 Durable goods: paper tissue (100 pieces), ball-point pen (plastic, with push-button, average ink), throw-away plastic razor (double-edged, 5 pieces), water glass (glass, 2 dl), pocket calculator (120-150 functions), peat (30 l) and wallpaper (10 m).
Meat products: turkey breast (fillets) and hams (without bones and knuckle).
Other food products: flour (1 kg), sugar (granulated, 1 kg), potatoe (late), milk (fresh, 2.8% fat content), eggs (10 pieces) and apple.
Services: fittness ticket (10 occations), swimming pool ticket (adult, on a weekday afternoon), taxi (5 km, city), solarium (10 min.), driving licence course (theory, practice, exam fees) men haircut (classic, washing, cutting and drying).
40 Géza Tóth, Az elérhetőség és alkalmazása a regionális vizsgálatokban. (Budapest: Központi Statisztikai Hivatal, 2013):
111.
41 The Hungarian settlements: Békéscsaba, Budapest, Debrecen, Győr, Miskolc, Nyíregyháza, Pécs, Szeged, Székesfehérvár, Szolnok, Szombathely.
The Romanian settlements: Arad, Brasov, Bucharest, Cluj-Napoca, Craiova, Galati, Iasi, Oradea, Ploiesti, Satu Mare, Timisoara.
The Ukrainian settlements: Berehove, Cherkasy, Chernihiv, Chernivtsi, Dnipropetrovsk, Donetsk, Ivano-Frankivsk Kharkiv, Kherson, Kirovohrad, Kmelnytskiy, Kyiv, Luhansk, Lutsk, Lviv, Mukacheve, Mykolaiv, Odessa, Poltava, Rivne, Sevastopol, Simferopol, Sumy, Ternopil, Uzhorod, Vinnytsya, Zaporizhya, Zhytomyr.
Hungary – taken every data and the five-year time frame into account – we have altogether 152,460 (Hungary-Romania) and 540,540 (Hungary-Ukraine) observations.
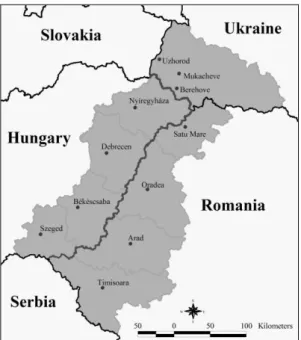
With the determination of the previously mentioned narrowly defined research area (Figure 4) the micro and individual level effect of the deborderisation process can be better understood. In this research area those spatial units and settlements are represented in which everyday life is largely influenced by the national borders.42
Figure 4 The micro region of the testing of the LOOP Source: edited by the authors
Figure 5 The research area of the testing the previous territorial coherence Source: edited by the authors
Finally, as a last momentum we intended to evaluate the previous spatial coherence so we restricted the Ukrainian and Romanian data points to marked settlements in Figure 5 not amending the Hungarian dataset.
42 In order to conduct a micro area research we selected the following settlements. Hungary: Békéscsaba, Debrecen, Nyíregyháza, Szeged. Romania: Arad, Oradea, Satu Mare, Timişoara. Ukraine: Berehove, Mukacheve, Uzhgorod.
Main findings
The gravity approach verifies the deborderisation process and the effect of borders in shaping the economic interactions. The efficiency (R2) of our model proved to be around 90% in every single year so with the strong correlation between the variables, the volume of trade could be explained. The distance negatively, the economic potential and adjacency positively influenced the volume of trade.
As we have already mentioned, among the parameters the home variable β value was the most interesting for us. It became significant at 1% in every year and showed a declining trend (Figure 6).
The 4.23 value measured in 2001 means that an average country in the researh area traded 67.71 times more within its borders than with an another country. In the following years we could see a steady decline in case of the parameter β and by 2011 the difference between internal and external trade dropped to 23.53.
4.23 4.07 3.96
3.84 3.8 3.72
3.53 3.39 3.71
3.43 3.2
0 1 2 3 4 5
2001 2002 2003 2004 2005 2006 2007 2008 2009 2010 2011
Border effect
Years
Figure 6 The border effect indicator according to the gravity approach (2001-2011)
Source: calculated by the authors from the data of World Bank (2001-2011), UN COMTRADE (2001-2011), GCC (2013)
These results enabled us to draw some valuable conclusions. First of all, in economic terms the resticting effect of the borders is easily specified so despite the globalisation forces, the European and world economy integration tendencies, etc. the state borders are still shaping the cross-country economic interactions. It is true however that in the period of 2001 and 2011 the deborderisation process showed spectacular results. This tendency proved to be significant despite the fact that some countries from the research area are still outside the EU and do not use the common currency, the euro. According to Figure 6 the EU membership of Hungary, Slovakia and Slovenia in 2004 did not bring any direct effect on the deborderisation process because the dynamics of the phenomenon did not change after gaining full integration. As a matter of fact, the same is true for the 2007 enlargement round and the enlargement of the Schengen Zone. It is quite interesting that the financial and economic crisis of 2008 has had a direct effect – owing to the decreasing export volumes – on the deborderisation process resulting in increased border effect indicators. It is also true however, that these numbers dropped to the previous levels. We do not want to give a detailed analysis on the effect of crisis on the deborderisation process however we truly believe that crisis accompanied with dwindling export volumes and faltering import demand have a clear negative effect on the dynamics of deborderisation.
As previously mentioned we measured the results of the deborderisation process along the Hungarian borders by one of the methods of approximation. According to Figure 7 the border effect is palpable in case of every Hungarian borderline and in accordance with the gravity approach shows a cleary negative tendency between 2001 and 2011. As long as Hungary traded 68.6 times more within its borders on average in 2001, in 2011 this value dropped to 11.83. The figure indicates that along the
Hungarian borders two well-defined groups have been formed so the deborderisation process was strongly asymmetric. The first group includes those countries (Austria, Romania, Slovakia) where the border effect is perceptibly lower. Among the possible reasons the following factors could be mentioned: European integration tendencies, longer border lines with several border crossing possibilities (Romania, Slovakia), higher economic integration with significant absorbing potential (Austria), the capitals and the central regions are closer to the borders (Austria, Slovakia). The second group is characterised by those countries (Serbia, Ukraine, Slovenia, Croatia) where the border effect indicator is markedly higher. We can also point to some explanatory factors in this case: shorter border lines with limited border crossing possibilities, lower economic integration, the capitals and the centre regions are far from the borderlines, generally lower world economy embeddedness, external Schengen Zone status (three countries belong to this category from the group).
0 10 20 30 40 50 60 70 80 90 100 110 120 130 140 150
2001 2002 2003 2004 2005 2006 2007 2008 2009 2010 2011
Border effect
Year
HUN-SK
HUN-UA
HUN-ROM
HUN-HOR
HUN-SLO
HUN-AUT
HUN-SRB Figure 7 Border effect along the Hungarian borders (2001-2011)
Source: calculated by the authors from the data of HCSO
The figures indicate that the EU integration of 2004 and 2007 did not bring spectacular change because the main tendencies stroke roots weel before these years. The same is true for the opening up of the Schengen borders while the crisis of 2008 largely distorted the process.
As for the eastern borders of Hungary it is clear that the Hungarian-Ukrainian and the Hungarian-Romanian borders are not homogeneous. According to 2011 data in the former case 4.07 times high and in the latter one 12.16 times high border effect indicator can be detected. As a consequence a more detailed analysis could shed more light on the differences.
Testing the LOOP in the Hungarian-Ukrainian and in the Hungarian-Romanian relations confirms the results of the approximation method: the deborderisation process represented diverse dynamism and features in the two cases. Generally, the variability of the relative prices is indeed lower in within country comparison than in the cross-country case. However it is not true for the ball-point pen, the pocket calculator and the swimming pool ticket in the Hungarian-Ukrainian relation. In the other relation the same things and the wallpaper, the fitness ticket and the solarium are the exceptions.
This means that in the former case every product group shows larger cross-country standard deviation while in the latter one the durable goods and the services are exceptions. The standard deviaton is 0.2479 in the Hungarian-Ukrainian relation and 0.1941 in the Hungarian-Romanian one. This difference (almost 30%) confirms in itself the conclusions of the method of approximation. A further interesting fact emerges since in both relations; the standard deviation of durable goods and locally produced services is bigger in both relations than the two food industry product categories. This can be extremely interesting in the mirror of such a general presumption that the prices of traded goods show
a much lower standard deviation in time. Sanyal and Jones43 however pointed to the fact that behind the bigger standard deviation the larger ratio of locally produced inputs could also have a role.
Nonetheless it is quite interesting that in the three countries the food industry products (other food industry products and meat products) represented the lowest within country standard deviation.
In case of a micro region analysis we can draw almost the same conclusions: the Hungarian- Ukrainian relation shows 0.2151 and the Hungarian-Romanian relation 0.1476 values. Both values are lower than the macro level results however the bigger cross-country standard deviation is still clear. It obviously points to one direction: behind the bigger price variability the border with its special economic interaction shaping feature has a massive role.
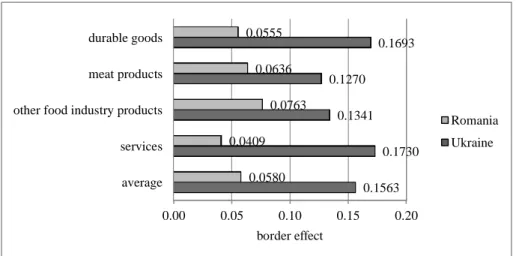
In order to get a more nuanced picture of the role of borders, we dissolved the within and across country standard deviations (8). According to the results, in the Hungarian-Ukrainian relation the border effect is strong and permanent because the parameter β1 was positive in every case and remained significant at 1%. Taken every products into consideration we calculated a 0.1563 strong border effect indicator which means that the standard deviation of cross-country data points is increased by 16.92% in comparison with a within country case. The efficiency of our model was around 65% which means that the standard deviation can be explained by these two factors. Apple produced the lowest value (0.0595) while the highest was recorded in case of sugar (0.2693). In the Hungarian-Romanian context the border effect is also existent but the parameter of milk and solarium was not significant (the other parameters were significant at 1% level). The average value of the border effect was “justˮ 0.0580 which means that the border increases the standard deviation by 5.97%. In this relation our model did not prove to be as good as in the previous case (25%) which confirms in itself the lower explanatory feature of the border.The lowest value was calculated in case of fitness ticket (0.0323) while the highest was in case of potatoe (0.1280). 44 When we compare the two relations (Figure 8) we could easily detect the heterogeneity of the border effect.
0.00 0.05 0.10 0.15 0.20
average services other food industry products meat products durable goods
0.1563 0.1730 0.1341 0.1270
0.1693
0.0580 0.0409
0.0763 0.0636 0.0555
border effect
Romania Ukraine
Figure 8 Proving the border effect along the east Hungarian borders (2007-2011) Source: calculated by the authors from the data of HCSO, RSO, USO
According to the results a more or less 3 times higher border effect can be observed in case of the Hungarian-Ukrainian borderline than in the Hungarian-Romanian case. This diverse trait raises two highly interesting questions. First of all, the determination of the explanatory factors and the
43 Kalyan K. Sanyal and Ronald W. Jones (1982): “The theory of trade in middle products”, American Economic Review 72, 1 (1982): 28.
44 Here we would like to call the attention to an interesting feature. The regression results produced in some cases negative distance parameters which indicates that with the increase in distance and the standard deviation of cross-country data pairs decreases. This obviously contradicts to the findings of Engel and Rogers (Engel and Rogers, 1117.) and Horváth et al (Horváth et. al. 40). Behind the negative parameters there is a specieal economic geograpic explanation. In the countries in question the neighbouring borderlands are peripheries while the far-away central regions show high economic integration;
these are natural production spatial units [Béla Baranyi, A határmentiség dimenziói Magyarországon. (Budapest–Pécs:
Dialóg Campus Kiadó, 2007), 41.]. As a consequence, in the product price purchased in border regions a larger transportation cost is reflected so ceteris paribus the central region-central region comparison (larger distance) definitely results in lower standard deviation than the central region-borderland case.
macro and micro level differences of the border effect are investigated. In case of a micro level research we have to draw the following initial conclusion: the isolating feature taking shape in border effect is palpable at the micro level as well.
0.00 0.05 0.10 0.15 0.20
average services other food industry products meat products durable goods
0.1563 0.1730 0.1341 0.1270
0.1693
0.1279 0.1265
0.1684 0.0877
0.1060
border effect
Micro region Macro region
Figure 9 The border effect of the macro and micro level of the Hungarian-Ukrainian border (2007-2011) Source: calculated by the authors from the data of HCSO, USO
In the Hungarian-Ukrainian relation (Figure 9) we measured 0.1279 (13.64% increase in standard deviation) and in the Hungarian-Romanian one 0.0547 (5.62%) (Figure 10). These data are a bit lower than those calculated at macro level, the difference however remains below 20% and 10%
respectively. This made us to draw the conclusion that those who live in borderlands are a bit better touched by the deborderisation process but their economic interactions are still significantly affected by the presence of the state borders. The values of the parameter β1 in the Hungarian-Ukrainian relation are almost the same like at the macro level. However peat and the swimming pool ticket are not significant at 1%. The lowest border effect was recorded in case of peat (0.0561) and the highest was sugar’s (0.2531). It is also interesting to point to the fact that only the other food industry category produced such products (milk, egg, apple, potatoe) where the border effect was larger than at macro level.
0.00 0.02 0.04 0.06 0.08
average services other food industry products meat products durable goods
0.0547 0.0496
0.0731 0.0376
0.0483
0.0580 0.0409
0.0763 0.0636 0.0555
border effect
Micro region Macro region
Figure 10 The macro and micro level border effect of the Hungarian-Romanian borderland (2007-2011) Source: calculated by the authors from the data of HCSO, RSO
The Hungarian-Romanian micro area has a special feature, namely the border effect indicator of the pocket calculator, peat, solarium did not prove to be significant. In addition the pocket
calculator represented negative value (-0.0011).45 In comparison with the macro area the border effect indicator at micro level was once below and once over the values. The lowest parameter was 0.0215 in case of milk, the highest (0.1097) was recorded in potato prices.
Later we tried to unearth those factors which contributed to the existence of border effect. First we took into consideration the effect of common language and economic history. With the help of restricting the Ukrainian sample to three and the Romanian sample to four settlements, we expected lower border effect indicator due to the common past. However the results did not verify the total disappearance of the parameter β1. In the Hungarian-Ukrainian case we detected 0.1188 (12.61%
standard deviation increase) which means that the isolating feature of the borders are still palpable and not only the foreign language is responsible for the existence of the border effect. The parameter β1 was significant in every case and except for the potato, flour, egg and apple every product showed a lower border effect than at macro level.
The Hungarian-Romanian relation represented the same pattern as far as the impact of the partly common language and history are concerned. The general border effect was lower (0.0477, 4.89% standard deviation increase) and regarding pocket calculator, peat, wallpaper and solarium were not significant. In case of the other products lower of the macro level values could be detected. Putting it cleary this relation confirmed our previous finding: the border effect is caused not only by the different languages spoken and it exists in previously united spatial units as well.
Finally, we evaluated the role of nominal exhange rate in the values of parameter β1. Our hypothesis was that the border effect is caused by the different inflation rates of the countries involved. The results contradicted this. In case of the Hungarian-Ukrainian border the parameter was 0.1555 (16.82% increase in the standard deviation) which strongly confirmed that the border effect is not just the result of the fluctuation of the nominal exchange rate. In the Hungarian-Romanian case we calculated 0.0586 (6.04% increase in the standard deviation) which made it clear that along the eastern borders of Hungary not the nominal exchange rate is responsible for the existence of the border effect.
Conclusions and discussion
The paper clearly and consistently pointed to the existence of border effect in the CEE region and in Hungary. According to the gravity approach the role of borders is still strong in shaping the economic interaction however this role is faltering in time. In 2001 the CEE countries were less open to trade and they traded 68 times more within their borders. By 2011 this indicator dropped to 23 indicating the above mentioned tendencies.
The border effect is clear along the Hungarian borders but in accordance with the general tendency it weakened between 2001 and 2011. The deborderisation process however represents large heterogeneity because two different groups of countries can be detected. The Hungarian-Austrian, the Hungarian-Slovakian and the Hungarian-Romanian relations show a systematically lower indicator than in the Hungarian-Slovenian, the Hungarian-Serbian, Hungarian-Croatian and the Hungarian- Ukrainian. So the disappearance of borders and their economic effects are quite varied along the Hungarian borders. When checking the tendency of the indicator it became clear that the EU and the Schengen membership have spurred the opennes and the deborderisation process however they did not bring direct changes right after the accession dates. (The actual realignment had taken place well before the offical accession dates.) The financial and economic crisis of 2008 has had a clear and direct negative effect on the deborderisation process so the protective umbrella of the EU and the internal market proved to be insufficient.
Our micro level analysis strongly confirmed our previous findings. The Hungarian-Ukrainian and the Hungarian-Romanian borders have undergone a quite different deborderisation process which results in perceptible differences and heterogeneity. Thanks to the European integration, closer trade links and a couple of other factors the Hungarian-Romanian border is more permeable and its role in shaping the economic interactions is disappearing. The deborderisation process is also detected at micro level with a little difference. This cleary indicates that the individuals residing close to the border are affected by the changing borders.
45 This is not surprising at all because it simply means that buying at the other side of the border is systematically cheaper than at home.
All in all, these patterns in case of the eastern borders of Hungary point to the fact that while in the Hungarian-Romanian relation the disappearing borders could pave the way for more intense economic interactions and development, the Hungarian-Ukrainian borderland is facing huge challenges. Here the globalisation and European integration tendencies are not so pervasive so the ground for increased cross-country economic links is partly or mostly missing.
BIBLIOGRAPHY
Anderson, James A. and Eric van Wincoop. “Gravity with Gravitas: A Solution to the Border Puzzle.”
NBER Working Paper 8079 (2001): 42.
Anderson, James A. and Eric van Wincoop. “Trade Costs.” The Journal of Economic Literature. 42, 3 (2004): 691-751.
Anderson, Michael A. and Stephen L. S. Smith. “Canadian provinces in world trade: engagement and detachment.” Canadian Journal of Economics 32 (1999): 22-38.
Balta, Narcissa and Juan Delgado. “Home Bias and Market Integration in the EU.” CESifo Economic Studies 55, 1 (2009): 110-144.
Baranyi, Béla. A határmentiség dimenziói Magyarországon [Dimensions of Borders in Hungary].
Budapest–Pécs: Dialóg Campus Kiadó, 2007.
Braudel, Fernand. Anyagi kultúra, gazdaság és kapitalizmus, XV-XVIII. század [Civilisation matérielle, économie et capitalisme, XVe-XVIIIe siècle]. Budapest: Gondolat, 1985.
Braudel, Fernand. A Földközi-tenger és a mediterrán világ II. Fülöp korában I-III. [La Méditerranée et le Monde Méditerranéen a l'époque de Philippe II. I-III.] Budapest: Akadémiai Kiadó–Osiris, 1996.
Braudel, Fernand. Franciaország identitása I-II. [L'Identité de la France I-II.]. Budapest: Helikon, 2003-2004.
Braudel, Fernand. A kapitalizmus dinamikája [La Dynamique du Capitalisme]. Budapest: Európa Könyvkiadó, 2008.
Brülhart, Marius. “The Spatial Effects of Trade Openness: A Survey.” Review of World Economics 147, 1 (2011): 59-83.
Cassel, Gustav. “Abnormal deviations in international exchanges.” The Economic Journal 28 (December 1918): 413-415.
Ceglowski, Janet. “The law of one price: intranational evidence for Canada.” Canadian Journal of Economics 36, 2 (2003): 373-400.
Chen, Natalie. “Intra-national versus international trade in the European Union: why do national borders matter?” Journal of International Economics 63, 1 (2004): 93-118.
Collier, William and Roger Vickerman. “Labour Markets in EU Border Regions: The Case of Kent and Nord-Pas de Calais”. CERTE University of Kent at Canterbury Working Paper 1 (2001):
11.
Coughlin, Cletus C. and Dennis Novy. “Is the International Border Effect Larger than the Domestic Border Effect? Evidence form U.S. Trade”. Research Division Federal Reserve Bank of St.
Louis Working Paper Series 2009-057C (2011): 29.
Csaba, László. “Kérdőjelek a közgazdaságtanban és oktatásában [Challenges in economic research and education].” Közgazdasági Szemle 60, 1 (January 2013): 47-63.
Daumal, Marie and Soledad Zignago. “The Border Effects in Brazil (preliminary version)”, www.dauphine.fr/globalisation/daumal2.pdf, (accessed June 10 2013).
Disdier, Anne-Célia and Keith Head. “The puzzling persistence of the distance effect on bilateral trade.” The Review of Economics and Statistics 90, 1 (2008): 37-48.
Dusek, Tamás. “Vásárlóerőparitások, területi árkülönbségek, sörárak [Purchasing power parities, regional price differences, beer prices].” Comitatus 18, 3 (September-October 2008): 73-82.
Engel, Charles and John H. Rogers. “How wide is the border?” American Economic Review 86, 5 (1996): 1112-1125.
Feenstra, Robert C. “Border Effect and the Gravity Equation: consistent methods for estimation.”
Scottish Journal of Political Economy 49, 5 (2002): 23-43.
Fukao, Kyoji and Toshihiro Okubo. “Why Has the Border Effect in the Japanese Machinery Sectors Declined?: The Role of Business Networks in East Asian Machinery Trade.” Journal of Economic Integration, Center for Economic Integration, Sejong University 26 (2011): 651- 671.
GCD, “Great Circle Distance Calculator by Ed Williams”, www.williams.best.vwh.net/gccalc.htm (accessed February 20, 2013).
Goldberg, Pinelopi Koujianou and Frank Verboven. “The Evolution of Price Dispersion in the European Car Market.” Review of Economic Studies 68, 4 (October 2001): 811-848.
Hajdú, Zoltán. “A határon átnyúló együttműködés potenciális lehetőségei Magyarország EU- csatlakozása után [The Potencial Opportunities of Cross-Border Co-operations after the Accession of Hungary to the European Union]”, in: A régiók szerepe a bővülő Európai Unióban, ed Gyula Horváth, 163-173. Pécs: MTA RKK, 2000.
Hansen, Niles. “Border Regions: A Critique of Spatial Theory and a European Case Study.” Annals of Regional Science 11, 1 (1977): 1-14.
Haskel, Jonathan and Holger C. Wolf. “Law of One Price – A Case Study.” Scandinavian Journal of Economics 103, 4 (2001): 545-558.
Head, Keith and Thierry Mayer. “Non-Europe: The Magnitude and Causes of Market Fragmentation in Europe”. Weltwirtschafltliches Archiv 136, 2 (2000): 285-314.
Head, Keith and Thierry Mayer. “Illusory border effects: Distance mismeasurement inflates estimates of home bias in trade.” Centre d’Etudes Prospectives et d’Informations Internationales (CEPII), Paris, Working Paper No. 2002-01 (2002): 29.
Helliwell, John. How Much do National Borders Matter? Washington DC: The Brookings Institution Press, 1998.
Horváth, Julius, Attila Rátfai and Botond Döme. “The border effect in small open economies.”
Economic Systems 32, 1 (2008): 33-45.
KSH, “STADAT tables”, http://www.ksh.hu/docs/hun/xstadat/xstadat_eves/i_qkt009b.html (accessed March 24, 2013).
Leamer, Edward E. “Access to western markets, and eastern effort levels”, in: Lessons from the Economic Transition: Central and Eastern Europe in the 1990s, ed Salvatore Zecchini, 503- 526. Norwell: Massachusetts: Kluwer Academic Publishers, 1997.
McCallum, John. “National Border Matter: Canada-US Regional Trade Patterns”. American Economic Review 85, 3 (1995): 615-623.
Meinhof, Ulrike H., Heidi Armbruster and Craig Rollo (2003): Border Discourse: Changing Identities, Changing Nations, Changing Stories in European Border Communities. Project No:
SERD-1999-00023 Periodic Progress Report, 62.
Morshed, Mahbub. “Is there really a „border effect”?” Journal of International Money and Finance 26, 7 (2007): 1229-1238.
Nitsch, Volker. “National Borders and International Trade: evidence from the European Union.”
Canadian Journal of Economics 22, 4 (2000): 1091-1105.
Ohmae, Kenichi. The End of the Nation State: The Rise of Regional Economies. London: Free Press, 1995.