LABOUR MARKET IN 2018
Tamás Bakó & Judit Lakatos
Hungary’s key economic indicators showed positive trends in 2018: the gross domestic product increased by 5.1, exports by 4.3 and fixed capital formation by 17.1 per cent. There was excess demand in the labour market in 2018 and labour reserves that may be mobilized significantly shrank from the previous year. Accordingly, the Government continued to reduce public works head- counts in order to encourage former public works participants to enter the primary labour market. Excess demand for labour and wage-related measures by the Government resulted in a significant wage growth only slightly weaker than in the previous year.
Despite growing labour supply problems, the Government continued to en- courage job creation. In the period 2011–2017, 255.6 billion HUF non-re- fundable grants created 35.3 thousand new jobs and a further 27 billion HUF created 1,400 more in 2018. Because of the relationship between Hungarian wages and the quality of labour available, Hungary is an attractive location for foreign investors to establish business premises, and especially so because the Government supports their investment directly with non-refundable grants and indirectly with infrastructure improvements. However, the depletion of domestic labour reserves and the scarcity of cross-border supply put a limit to job creation investments.
It remains to be seen what steps current and future investors are forced to take because of increasing labour costs (even though the government has been trying to counteract this increase by reducing contributions payable by em- ployers) and worsening difficulties of obtaining labour. Alternatives include moving production capacities to another country as well as stepping up au- tomation and robotization. Since the Hungarian economy is open, it is also vulnerable. Moreover, the automotive industry, which is sensitive to business cycles, has recently played a key role in industrial development, therefore exter- nal factors will continue to have a major influence on labour market changes.
Recognising the economic processes from the end of 2018 to the first quar- ter of 2020, we can see that in addition to the classic business cycles, difficult- to-predict external shocks can also have a large impact on the labour market.
As a result of the COVID-19 epidemic that appeared in Hungary in March 2020, the favourable labour market processes were spectacularly broken. The average monthly number of persons employed was already 56 thousand less
3,500 3,700 3,900 4,100 4,300 4,500
The number of employed persons of age group 15–74
2018 2017 2016 2015 2014 2013 2012 2011
2010 45
50 55 60 65 70 The employment rate
of age group 15–74
Thousand persons Percent
Quarters
in March than in the previous month and 22 thousand less than in March of the previous year. Although at the time of writing these sentences, it is not yet known for sure how much unemployment officially increased in April 2020, an estimate can be made using the relationship between the number of Google searches and the number of the registered unemployed. This was also done by Köllő–Kónya (2020), who found that the number of registered unemployed could have exceeded 400,000 in April 2020, an increase of roughly 120,000 compared to February.
DRIVERS OF CHANGE IN EMPLOYMENT
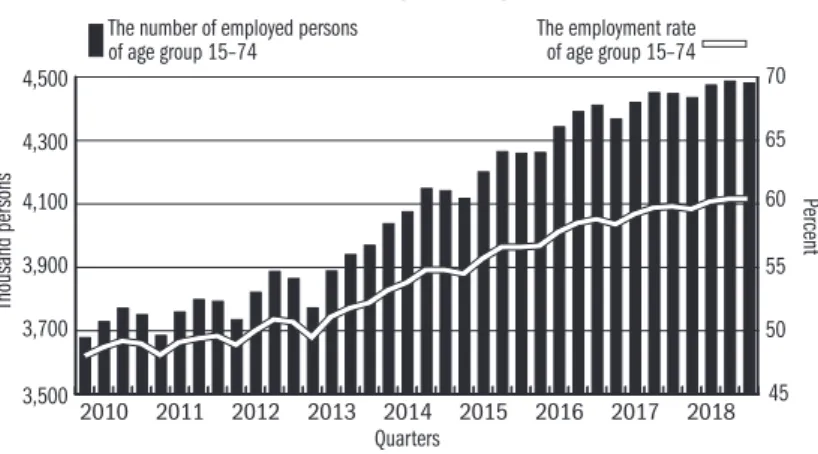
The number of those in employment continued to expand in 2018 but the rate of the increase was lower than in the previous two years. Based on the Labour Force Survey, the average annual number of employees rose to 4 million 470 thousand, by 1.1 percent, which is 47 thousand higher than the year before, compared with a 1.6 per cent increase in 2017 and a 3.4 per cent one in 2016.
The growth rate also slowed down during the year and, due to seasonal effects, in the last quarter it slightly lagged behind the peak of the third quarter of the previous year (4 million 487 thousand). The slowdown in the expansion in employment was due to the diminishing labour supply, indicated by the number of vacancies growing at the same rate as over the previous year. Ac- cording to statistical reports, employers would have needed nearly 84 thou- sand more employees in 2018 on average.
Figure 1: The number of employees in the 15–74 age group and the employment rate among those aged 15–74, 2010–2018
Source: LFS, Central Statistical Office (CSO).
One of the reasons for the insufficient labour supply is the fact that the size of generations entering the labour market is significantly smaller than that of the generations exiting. While in 2010 the number of working-age persons (aged 15–64) living in private households was 6 million 736 thousand, it de-
clined to 6 million 415 thousand in 2017 and by a further 46 thousand to 6 million 369 thousand in 2018. This negative trend is possible to be offset by the gradual raising of the retirement age until 2020 but from 2021 onwards retirement will be uniformly linked to reaching the age of 65. The opportu- nity for women to retire after 40 qualifying years has been announced repeat- edly not to be changed by the Government; however, an increasing propor- tion of women who were full-time students will be able to claim it, therefore the number of persons retiring prior to the date applicable to them may in- crease.1 There is no precise data available as to what extent of the working- age population is indeed at the disposal of employers.2 It is known that 105 thousand of the 4 million 470 thousand employees in 2018 reported work- ing abroad, indicating a decrease within the margin of sampling error com- pared with one year prior.
Several measures have been adopted recently to increase labour supply. Ac- cess to employment was improved for Serbian and Ukrainian workers in 2017 and there is even organised recruitment in Serbia and Ukraine. Although Hungarian wages are higher than wages in Ukraine and employers also pro- vide for accommodation and transport for workers, Hungary is less attractive than the Czech Republic or Poland, where both the wages offered are higher and where it is easier to overcome language barriers because of belonging to the same language family. Even though the number of work permits issued rose sharply in 2018,3 the statistical reports of employers only included 40 thousand foreign employees, which implies a 17 percent increase from the previous year. This alleviated the problems of a few large employers adapted to employing large numbers of foreign workers but had little impact on the general lack of labour supply.4
Due to lower birth rates, women stayed away less from their jobs than for example in the 1980s; however, the length of their absence barely changed.
According to a survey conducted four years ago, more than three-quarters of mothers wish to use up the entire maternity leave to stay at home with their children (CSO, 2015). Measures to expand nursery care and removing the sus- pension of work from the eligibility criteria of provision both aimed at encour- aging women to return to the labour market sooner after giving birth.5 The measures have not yet produced impressive results. In 2014, when the number of births was similar to that in 2018, 16.8 thousand women claiming parental leave benefits were employed (undertaking gainful work during the week of the survey), while this figure was 21.1 thousand in 2018.6
1 Graduates from 4-year pro- grammes potentially had 40 qualifying years in 2018 and graduates from 5-year pro- grammes in 2019.
2 The source of uncertainty is the population estimate used for multiplication, since at the time of its annual update the accurate number of persons staying abroad for work is not known. There is unambiguous information only about those who are documented as a mem- ber of a household in Hungary by the Labour Force Survey.
According to CLFS (Commu- nity Labour Force Survey), 327.7 thousand Hungarian citizens, aged 20–64, were staying not only occasionally in 2017 in EU–EFTA countries, 80.6 per cent of which were employed.
The share of women and men among the registered persons was similar and presumably a significant proportion of them were living in a household which had no member living in Hungary to provide infor- mation about them. Although both the absolute number of the Hungarians registered and their proportion relative to the appropriate population were lower than in most other post- communist countries, the la- bour migration of Hungarians between 2010 and 2015 grew above the average.
3 According to data from the Directorate-General for Aliens Policing (former Immigration and Asylum Office), 150 per cent more foreigners arrived in Hungary up to the end of the third quarter of 2018 to take up employment, compared with one year prior. While last year one-third of applicants for residence permits arrived for employment or gainful activi- ties, in 2018 more than half of them arrived for such purposes.
4 The large-scale employment of Ukrainian citi- zens sometimes reduces the chances of commut- ers from regions with few jobs, as the latter are less likely to work overtime and their employ- ment may be more expensive.
5 Incentives also include the family tax allow-
ance because both members of a couple have to have a taxable income in order to be eligible for the total amount.
6 Due to proxy interviews (response from an- other member of the family) there is higher than above uncertainty about data analysed here.
Full time students and old-age pensioners are also potential labour force.
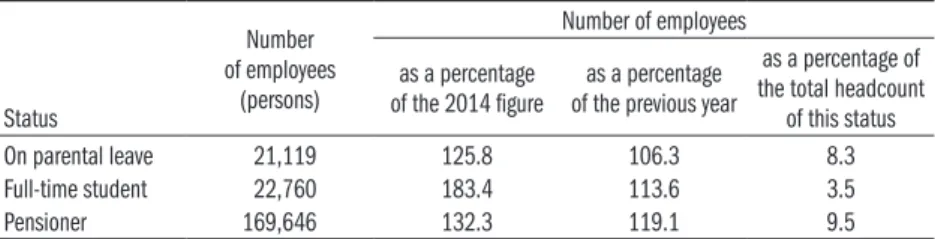
In order to boost the interest of the latter, pensioner cooperatives were intro- duced, modelled on student cooperatives, and since January 2019 old-age pensioner employees and their employers have been exempt from taxes and contributions. According to the Labour Force Survey, 12.4 thousand full- time students and 128.2 thousand pensioners were in employment in 2014 on average, while in 2018 the figures were 22.8 thousand and 169.6 thou- sand respectively. Although the number of pensioners working is significant, it must be taken into account that due to the rising retirement age a growing proportion of them may not be able to work because of their health even if they wanted. Compared to a low base, the number of students meeting the eligibility criteria for employment increased sharply. The absolute figure is probably underestimated7 but the surge is real (Table 1). The increasing em- ployment of students was primarily the result of increasing wages driven by excess demand for labour (as well as the increasing cost of living, especially accommodation costs of those living in separate households); however, work- ing during studies is still less common in Hungary than in most Northern and Western European countries.
Table 1: Employee groups according to their secondary status, 2018
Status
Number of employees
(persons)
Number of employees as a percentage
of the 2014 figure as a percentage of the previous year
as a percentage of the total headcount
of this status
On parental leave 21,119 125.8 106.3 8.3
Full-time student 22,760 183.4 113.6 3.5
Pensioner 169,646 132.3 119.1 9.5
Source: LFS, CSO.
Public works participants are also a source of labour supply for the primary labour market. Increasing the headcounts of public works in 2012 princi- pally aimed at tackling unemployment but probably also at satisfying pub- lic opinion, which resists the idea of an income without work (that is to say unemployment benefits). The annual headcount of public works participants is determined by the Government and not by the demand for such work- places. Because of increasing demand in the primary labour market, the headcounts of public works participants were reduced already in 2017, fol- lowed by a similar step in 2018 (Figure 2). Employers are encouraged by, in addition to doubling the employment allowance in November, the fact that the public works wage did not change in 2018 after a slight raise in 2017.8 The increased labour demand was mainly exploited by better qualified pub-
lic works participants with fewer health and family problems and living in towns with better transport links: they were more likely to be able to enter the primary labour market.
7 Old-age pensioners, and es- pecially students, often under- take casual employment, there- fore the annual headcount may be substantially greater than the average headcount.
8 When introduced in 2012, the public works wage was 77.2 per cent of the “normal” minimum wage but this proportion had decreased to 59.1 per cent by 2018.
0 50,000 100,000 150,000 200,000 250,000
2018 2017 2016 2015 2014 2013 2012 2011
2010 Months
Figure 2: Changes in the headcount of public works participants, 2010–2018
Source: CSO, Monthly labour report.
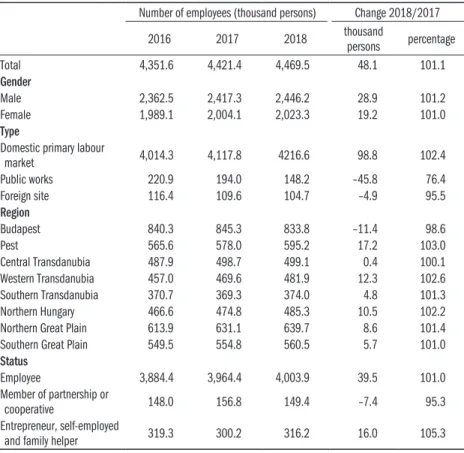
An increase in headcount was only seen in the primary labour market in 2018, with 98.8 thousand new jobs (Table 2). In addition to the unemployed and inactives, some of the former public works participants also managed to find employment and the number of respondents reporting a job abroad declined in the labour force survey as well.9
Table 2: Changes in the number of employees broken down by major characteristics Number of employees (thousand persons) Change 2018/2017
2016 2017 2018 thousand
persons percentage
Total 4,351.6 4,421.4 4,469.5 48.1 101.1
Gender
Male 2,362.5 2,417.3 2,446.2 28.9 101.2
Female 1,989.1 2,004.1 2,023.3 19.2 101.0
Type
Domestic primary labour
market 4,014.3 4,117.8 4216.6 98.8 102.4
Public works 220.9 194.0 148.2 –45.8 76.4
Foreign site 116.4 109.6 104.7 –4.9 95.5
Region
Budapest 840.3 845.3 833.8 –11.4 98.6
Pest 565.6 578.0 595.2 17.2 103.0
Central Transdanubia 487.9 498.7 499.1 0.4 100.1
Western Transdanubia 457.0 469.6 481.9 12.3 102.6
Southern Transdanubia 370.7 369.3 374.0 4.8 101.3
Northern Hungary 466.6 474.8 485.3 10.5 102.2
Northern Great Plain 613.9 631.1 639.7 8.6 101.4
Southern Great Plain 549.5 554.8 560.5 5.7 101.0
Status
Employee 3,884.4 3,964.4 4,003.9 39.5 101.0
Member of partnership or
cooperative 148.0 156.8 149.4 –7.4 95.3
Entrepreneur, self-employed
and family helper 319.3 300.2 316.2 16.0 105.3
Source: LFS, CSO.
9 The Labour Force Survey in- cludes persons working abroad who commute abroad daily or work abroad for extended pe- riods but regularly come home and contribute to the subsist- ence of the household provid- ing the data.
Since 2010 a total of 609 thousand unsupported new jobs have emerged in the Hungarian economy, which amounts to an annual average increase of nearly 70 thousand. In 2018 the number of employees rose in all regions (if Budapest and Pest county are considered jointly, in line with the earlier regional classi- fication). Proportionately to the labour force, the largest increase was seen in Western Transdanubia, in spite of the depletion of internal labour reserves.
Thus the main source of the increase was presumably internal migration, still modest because migration is restricted by the regionally considerably differ- ent accommodation costs.
The employment rate of the population aged 15–64 was 69.2 per cent in 2018; however, half of the 1.1 percent year-on-year improvement was due to a decline in the population size used in the denominator of the rate. The em- ployment rate of men slightly exceeded the EU-28 figure, while that of women was slightly lower. The Europe 2020 strategy sets 75 per cent as a target for the population aged 20–64, and the Hungarian rate of 74.4 per cent was only slightly below that in 2018. This target may even be reached with stagnating employee numbers owing to the continuous population decline.
While 82.1 per cent of men in the age group was in employment in 2018, the rate was only 66.8 per cent for women (Figure 3). One of the reasons for the significant difference in the employment rate of genders is the consider- ably long parental leave, compared to other European countries, and the re- cipients of parental leave benefits (unless they undertake gainful work during the week of the survey) are regarded by Hungarian statistics as economically inactive irrespective of their employment status. Another important reason is that although the rising retirement age applies equally to both genders, only women can retire after 40 qualifying years. Therefore whereas in the fourth quarter of 2018 56.4 per cent of men aged 60–64 were in employment, only 27.3 per cent of women worked. Furthermore, the gap between the employ- ment rates of men and women has slightly widened in recent years. A further, less significant, factor for the difference is that a larger proportion of women in the younger age groups follow higher education studies and therefore en- ter the labour market at a later age. Caring for the family, another reason for inactivity, is also almost exclusively undertaken by women.
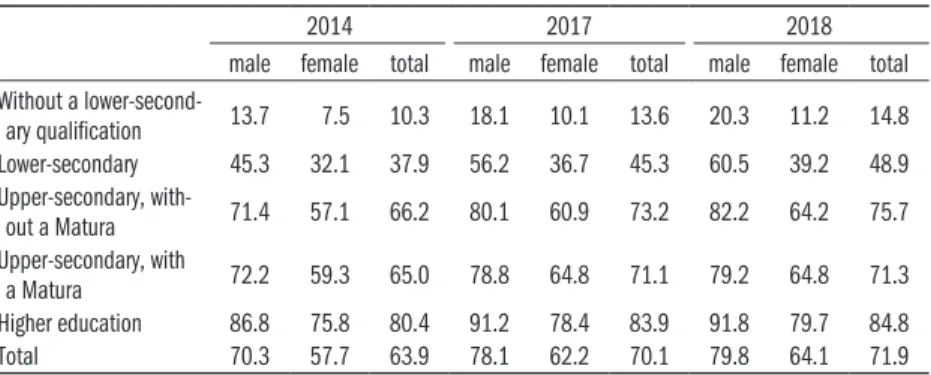
The employment chances of the low-qualified used to be below the EU av- erage in Hungary but as a result of public works schemes, which increasingly became a type of employment typically for the low-qualified, the difference has disappeared. In the not very populous qualification group of those with- out a lower-secondary qualification, aged 20–64, nearly 15 percent were in employment in 2018 (Table 3),10 which is an almost 5 percentage point im- provement on 2014. The employment rate of the same age group with a low- er-secondary qualification increased by 11 percentage points, with a substan- tially more marked increase among men.
10 The denominator also in- cludes those who are unable to participate in formal education because of their health or dis- ability.
40 60 80 100
Female Male
2018 2017
2016 2015
2014
Percent
Quarters
Figure 3: Employment rates of men and women aged 20–64, 2014–2018
Source: LFS, CSO.
Table 3: Employment rate of the population aged 20–64, broken down by educational attainment and gender, excluding public works participants,
2014, 2017, 2018 (percentage)
2014 2017 2018
male female total male female total male female total Without a lower-second-
ary qualification 13.7 7.5 10.3 18.1 10.1 13.6 20.3 11.2 14.8
Lower-secondary 45.3 32.1 37.9 56.2 36.7 45.3 60.5 39.2 48.9
Upper-secondary, with-
out a Matura 71.4 57.1 66.2 80.1 60.9 73.2 82.2 64.2 75.7
Upper-secondary, with
a Matura 72.2 59.3 65.0 78.8 64.8 71.1 79.2 64.8 71.3
Higher education 86.8 75.8 80.4 91.2 78.4 83.9 91.8 79.7 84.8
Total 70.3 57.7 63.9 78.1 62.2 70.1 79.8 64.1 71.9
Source: LFS, CSO.
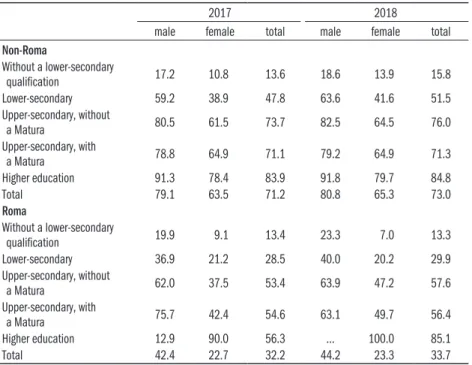
The employment rate of respondents identifying either as Roma or non-Roma in the Labour Force Survey, aged 20–64, improved but the ethnicity-based difference barely decreased (Table 4). In 2018, less than 34 per cent of the Roma aged 20–64 were in employment as opposed to the 73 per cent among the non-Roma.
The large difference stems from the joint impact of two factors: the employ- ment rate of the Roma lags behind that of the non-Roma at all qualification levels, except for the few higher education graduates, and at the same time the low-qualified, whose share in employment is lower than the average, are strongly overrepresented in the Roma population. The difference between the rate of Roma and non-Roma men is substantial but still much lower than the gap in the case of women. Only one in five Roma women with a lower- secondary qualification at most was in employment in 2018. Proportionately this is about half of the participation rate of Roma men and non-Roma wom- en with identical qualification levels.
Table 4: Employment rate of the Roma and non-Roma population, aged 20–64, broken down by educational attainment, 2017, 2018 (percentage)
2017 2018
male female total male female total
Non-Roma
Without a lower-secondary
qualification 17.2 10.8 13.6 18.6 13.9 15.8
Lower-secondary 59.2 38.9 47.8 63.6 41.6 51.5
Upper-secondary, without
a Matura 80.5 61.5 73.7 82.5 64.5 76.0
Upper-secondary, with
a Matura 78.8 64.9 71.1 79.2 64.9 71.3
Higher education 91.3 78.4 83.9 91.8 79.7 84.8
Total 79.1 63.5 71.2 80.8 65.3 73.0
Roma
Without a lower-secondary
qualification 19.9 9.1 13.4 23.3 7.0 13.3
Lower-secondary 36.9 21.2 28.5 40.0 20.2 29.9
Upper-secondary, without
a Matura 62.0 37.5 53.4 63.9 47.2 57.6
Upper-secondary, with
a Matura 75.7 42.4 54.6 63.1 49.7 56.4
Higher education 12.9 90.0 56.3 … 100.0 85.1
Total 42.4 22.7 32.2 44.2 23.3 33.7
Source: LFS, CSO.
Partly because of being concentrated in regions or types of municipalities with adverse labour market conditions and partly because of lower than av- erage educational attainment, a larger share of the Roma participate in public works schemes, compared with the non-Roma. In 2018 32 per cent of Roma employees, and more than 40 per cent of Roma women were employed in such schemes. Nevertheless, the growth of jobs in the primary labour market in comparison with public works was in line with the average in the case of Roma employees. The permanent poor labour market outcomes of the Roma is likely to be reinforced by the fact that 68.4 per cent of the 18–24 age group were early school leavers, that is they did not acquire an upper-secondary educa- tion until the age of 24, compared with the 9.3 per cent of the non-Roma, and 40.1 per cent of Roma youth aged 15–24 were not in education, employment or training (NEET) compared with the 9.1 per cent among the non-Roma.
LABOUR SUPPLY AND DEMAND
The labour market is increasingly facing limits to the expansion of employ- ment, the gap between demand and supply widens, the available labour supply is not of the needed qualification structure and not where it is needed. The increase in labour demand is revealed by changes in the number of vacancies,
0 10,000 20,000 30,000 40,000 50,000 60,000 70,000 80,000
2018 2017 2016 2015 2014 2013 2012 2011 2010
Number of job vacancies
Quarters
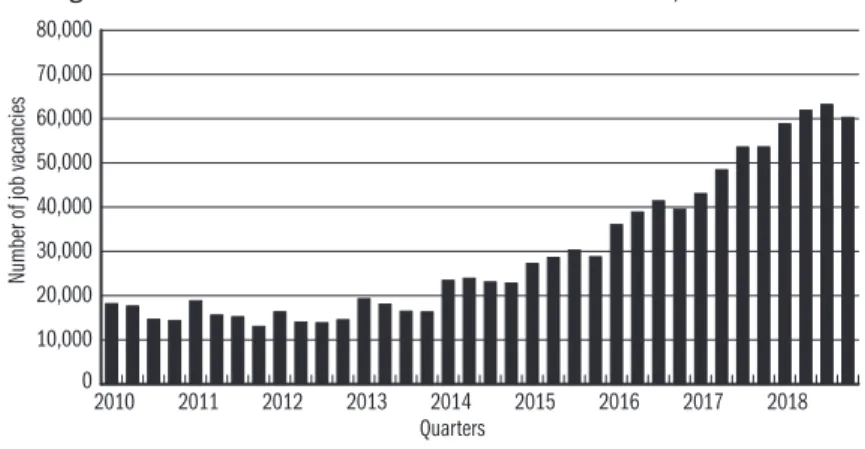
although the relevant statistics measure trends more precisely than the actual number of missing employees at a point in time.11 In the first quarter of 2018, there were 79.4 thousand vacancies at businesses with at least 5 employees and state-funded institutions and this figure rose to 83.6 thousand in the second quarter, 87.7 thousand in the third quarter and then it fell to 83.3 thousand in the fourth quarter. The annual average of vacancies at present and in the near future was nearly 23 percent above the level one year prior. 60.3 thou- sand of the vacancies were in the business sector in the fourth quarter, which amounted to nearly 2.8 per cent of the total number of vacancies (Figure 4).
Figure 4: The number of vacancies in the business sector,* 2010–2018
* Businesses with at least five employees.
Source: CSO, vacancy statistics.
Compared to the overall vacancies, the highest figure was reported in the ad- ministrative and service support sector, where 5.6 per cent of jobs were vacant.
More than half of the 10 thousand vacancies advertised were for jobs not re- quiring a qualification, typically posted by temporary agencies active in this sector. Another 21.8 thousand of the vacancies in the business sector were reported in the manufacturing industry and 6.2 thousand at trading compa- nies. The proportion of vacancies in the public sector exceeded 3 per cent in the last three months of the year. There were 4.1 thousand openings in edu- cation including 2.7 thousand for higher education graduates (presumably teachers). The highest number of vacancies in the public sector were reported in healthcare and social services. 2.2 thousand of the 8.6 thousand vacancies were for higher education graduates capable of working independently, 4.6 thousand for higher education or upper-secondary graduates with a relevant diploma but nearly one thousand unskilled workers were also missing.
The Hungarian job vacancy rate was only slightly above the European aver- age12 but its growth was outstanding.
Potential labour reserve (supply) includes, in addition to the unemployed, the inactive wishing to work, the underemployed according to the EU defini-
11 In some segments, profes- sional advocacy organisations report many times higher shortage than the aggregated statistical reports of enterprises active in the segment.
12 As regards the share of va- cancies, the situation is mark- edly different in member states.
The highest figure was reported by the Czech Republic in the third quarter of the year, where 5.9 out of 100 jobs were vacant, whereas in Greece, not yet emerging from the economic crisis, the rate was only 0.6.
30 40 50 60
Long-term unemployed (left axis)
2018 2017 2016 2015 2014 2013 2012 2011 2010 2009 2008
2007 10
13 16 19 Average length of
job seeking (right axis)
Per cent Month
tion, and public works participants, specific to the Hungarian labour market.
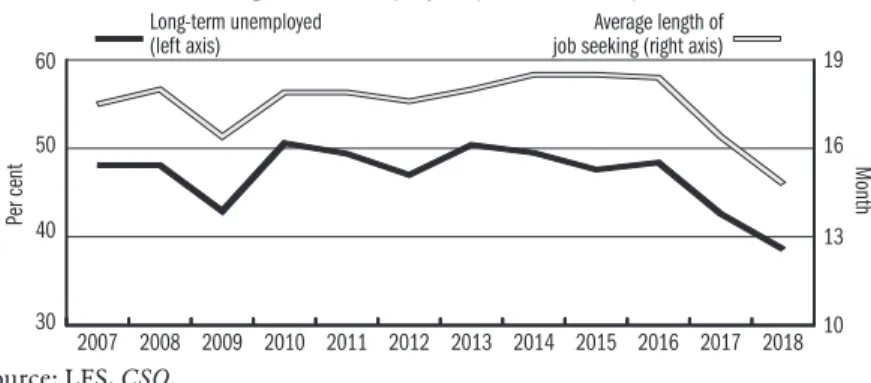
(The latter are regarded as reserve only for the primary labour market, since they are included in the category of employees.) All the above groups shrank in 2018, thus the labour supply continued to decrease. In 2018, the annual average number of the unemployed, as defined by the ILO, the specialised agency of the UN, fell to 172 thousand, and the unemployment rate was 3.7 per cent. This figure was 20 thousand lower year-on-year, while the unem- ployment rate decreased by 0.4 percentage points. In the last quarter of the year, the number of the unemployed was 167 thousand, and as a result of the high volume of labour demand, both the average duration of unemployment and the proportion of those searching for a job for at least one year decreased.
Although the potential labour reserve only includes the unemployed as de- fined by the ILO, there are two more unemployment data, based on a differ- ent definition, which are important for describing the labour market situation.
The monthly average number of jobseekers registered at the National Employ- ment Service was 255 thousand, nearly 10 per cent lower or 28 thousand fewer than a year earlier. The number of registered jobseekers declined in the first half of 2018, it then slightly increased in the third quarter due to fewer sea- sonal and public works job vacancies and then it fell again to 243 thousand in the last quarter. The number of the insurance-based jobseekers’ allowance recipients (for six months at most) was essentially constant in recent years and thus their share within registered jobseekers grew. However, the propor- tion of those who receive some kind of unemployment-related cash benefit increased, although most of them still received employment substitution sup- port belonging to social benefits, the amount of which has been unchanged since 2013 (HUF 22,800/month). The number of those who reported being unemployed in the Labour Force Survey of the Central Statistical Office also decreased. An average of 287 thousand classified themselves as such in 2018, which is approximately identical to the joint number of the ILO-definition unemployed and the inactive belonging to the potential labour reserve.
Figure 5: The average duration of job seeking (months, right-hand axis) and the share of the long-term unemployed (left-hand axis) , 2010–2018
Source: LFS, CSO.
0 10 000 20 000 30 000 40 000 50 000
Number of job vacancies Total number of labour reserves
Number of job vacancies relative to potential labor reserve (%)
6.4 – 11.8 11.9 – 19.8 19.9 – 36.9 37.0 – 67.6
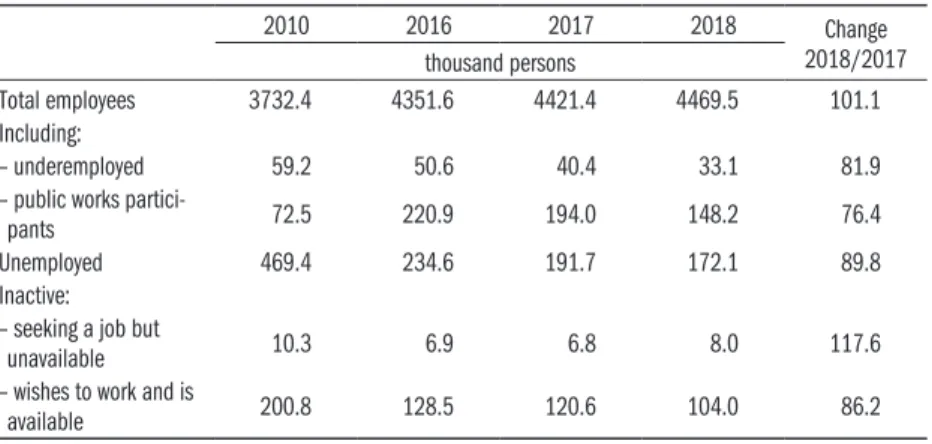
Table 5: The number of employees and the potential labour reserve (thousand persons)
2010 2016 2017 2018 Change
2018/2017 thousand persons
Total employees 3732.4 4351.6 4421.4 4469.5 101.1
Including:
– underemployed 59.2 50.6 40.4 33.1 81.9
– public works partici-
pants 72.5 220.9 194.0 148.2 76.4
Unemployed 469.4 234.6 191.7 172.1 89.8
Inactive:
– seeking a job but
unavailable 10.3 6.9 6.8 8.0 117.6
– wishes to work and is
available 200.8 128.5 120.6 104.0 86.2
Source: LFS, CSO.
In spite of the decrease, the potential labour reserve still significantly exceed- ed the number of vacancies in 2018; however, the geographical (and probably also structural) mismatch between the two remains considerable (Figure 6).
This may be remedied by a boost in domestic migration, which is hindered by the fact that accommodation costs are the highest at locations with the most employment opportunities.
Figure 6: Labour reserve and labour demand by county, 2018
Source: LFS, CSO, vacancy statistics.
WAGES, INCOME FROM WORK AND LABOUR COSTS
The insufficient labour supply in the economy enhances the bargaining power of employees, which had a strong impact on changes in wages over the past two years. After a 12.8 per cent increase in gross earnings in 2017, the wages
of people working at enterprises with at least 5 employees, state-funded insti- tutions and non-profit organizations designated to provide data increased by another 11.3% in 2018. In addition to economic trends, Government meas- ures also contributed to this high growth rate. As a result of wage convergence, the minimum wage is increasing continuously, although in 2018 less than the average wage increase, which resulted in low-paid workers falling behind. Not unrelated to the competition for labour, the wages of employees at 200 state- owned businesses continued to increase in 2018 (by 12–13 per cent on aver- age, in line with the third phase of the three-year wage agreement concluded in 2016) and certain staff groups of state-funded institutions enjoyed wage correction measures also this year. 1.1 percentage point of the 11.3 percent increase was due to a decrease in the number of public works participants to two-thirds of the previous year’s figure.
On 1 January 2018, the minimum wage rose by 8 per cent to HUF 138 thousand, which was lower than the 15 percent rise over the previous year.
At the same time, the guaranteed minimum wage applicable to skilled work- ers increased by 12 per cent (following an outstanding 25 percent rise of the previous year) to HUF 180.5 thousand. The increase in the minimum wage has a direct impact on the wages of low-earners and therefore it is mostly felt in sectors where the share of minimum-wage earners is traditionally signifi- cant. Earlier studies showed that at enterprises with fewer than 10 employ- ees the average wage is very near the minimum wage, accordingly its increase substantially contributes to cleaning up the economy. Recent minimum wage increases had a peculiar effect on wages in the public sector. Since the base sal- ary has been the same for a decade in several segments of the sector, salaries in the lowest wage categories had to be adjusted to the (guaranteed) mini- mum wage. This partly uses up funds dedicated to wage development in the segment and also equalizes earnings. The indirect effect entails that the mini- mum wage increase also raises higher wages so that the wage ratio is preserved, at least in segments where results enable employers to do so and where they are forced by the competition for employees. State-funded institutions have far fewer means to avoid wage compression than enterprises and in this way wages may tend toward one another more easily.
The average gross earnings at enterprises with at least 5 employees in the business sector (excluding the few thousand public workers employed here) were HUF 342.2 thousand, 10.8 per cent up on the previous year (Figure 7).
Among segments dominated by the business sector, earnings grew more than the average, by 15.7 per cent in real estate activities, followed by a 14 percent growth in administrative and support services where, among others, temporary agencies are classified, which play an increasingly important role in supplying the necessary workforce. The minimum wage increase in itself significantly boosted wages in construction.13 In addition, the increasing lack of skilled
13 This is one of the segments where employing workers at the minimum wage and paying the rest cash-in-hand is rather common.
100 120 140 160 180
Guaranteed wage minimum Public workers’ wage Minimum wage Public sector without public workers Public Sector Business Sector
2018 2017 2016 2015 2014 2013
Percent
workers, coupled with excess demand for construction capacities, also influ- enced the level of earnings. These factors resulted in a 12.9 percent increase in earnings, but even so, construction was the second worst-paying segment in the business sector after accommodation and catering (according to earnings statistics), with an average gross earnings of HUF 254.7 thousand. Earnings in the transport and storage sector grew only by 11.2 per cent despite the fact that the employees of large state-owned employers (MÁV – the state railway, Hungarian Post and regional transport companies) received an average increase of 12–13 per cent under multi-annual wage agreements. In manufacturing, the segment with the highest number of employees, the growth rate of earnings has been similar to that of the entire business sector; within this, the earnings growth rate of individual industry branches ranged from 4.8 per cent (pharma- ceutical)14 to 12.5 per cent (other manufacturing and basic metals). A similarly average (11.8 percent) increase was reported in trade. Wages were boosted by the increasing minimum wage (primarily the guaranteed minimum wage) in small rural shops and by successful wage negotiations due to labour shortages in large retail chains. With a rate of increase (8.3 per cent) below the average in the business sector, the finance and insurance industry still had the highest gross earnings at HUF 608.2 thousand in 2018. It was followed by the ICT industry, with an average of HUF 561.4 thousand and a growth rate of 9.5 per cent. The lowest average wage of HUF 212 thousand, only exceeding the skilled workers’ minimum wage by its one-fifth, was reported by enterprises employing at least five people in the accommodation and catering industry.
Figure 7: The rate of increase in gross earnings (2013 = 100 per cent)
Source: CSO, Monthly labour report.
The growth rate of wages in the public sector, excluding public works partici- pants, was 9 per cent, therefore its modest advantage over the business sector, gained in recent years, slightly decreased in 2018. Wage adjustment measures were implemented in various areas of the sector recently but a comprehensive review of the earnings and promotion scheme did not take place and the ef- fects of wage adjustments were quickly worn off.
14 The low rate is explained by a year-on-year decrease in the amount of non-regular earn- ings, which resulted in a lower than 100 wage index in some cases in the last month of the quarter (at the time of bonus payments). Regular earnings increased 1.8 percentage points faster than total earnings.
The earnings of workers in public administration, defence and compulsory social security are the highest within the three state budget areas, despite the fact that these segments had the highest proportion of workers in 2018 who were left out of the wage adjustment measures of recent years.15 The average monthly gross earnings of the nearly 70 thousand (mostly uniformed) man- ual workers were HUF 352.3 thousand and of the 196 thousand non-manual workers it was HUF 425.7 thousand.
Average earnings of people working in state-funded education institutions increased by 7.9 per cent to HUF 321.4 thousand, mainly driven by the mul- ti-annual salary adjustment of lecturers and researchers working in higher ed- ucation, which started in the autumn of 2016. As a result, their guaranteed wages increased by another 5 per cent on average on 1 January 2018. In pri- mary and secondary education, which received a significant increase in earn- ings in 2013, it causes tensions that annual growth is not adjusted to changes in the minimum wage and that the wage increase, which was indeed consid- ered substantial five years ago but was linked to extra workload, has by now lost much of its value.16
The most significant wage correction measures of the past one and a half years were aimed at those working at state-funded institutions in human healthcare and social care. In November 2017, earnings of specialised doc- tors and specialised pharmacists in hospitals rose by HUF 100 thousand, those of their colleagues without specialist qualification by HUF 50 thousand, and also the earnings of skilled health workers increased by 12 per cent on average.
This was followed by another increase of 8 per cent on average in January 2018.
As a result, gross earnings increased by 16.6 per cent in human healthcare and 9.5 per cent in social care in 2018. Thus gross average wages in the former rose to HUF 338.4 thousand and in the latter to HUF 237.4 thousand.17
Since 2011, a non-wage compensation has been granted to staff at state- funded institutions whose net earnings decreased due to changes in income tax and social security contribution rules in 2011 and 2012. Due to staff chang- es and wage increases, the number of recipients of the monthly HUF 8,200 compensation had decreased from 400 thousand to 78 thousand by 2018.18
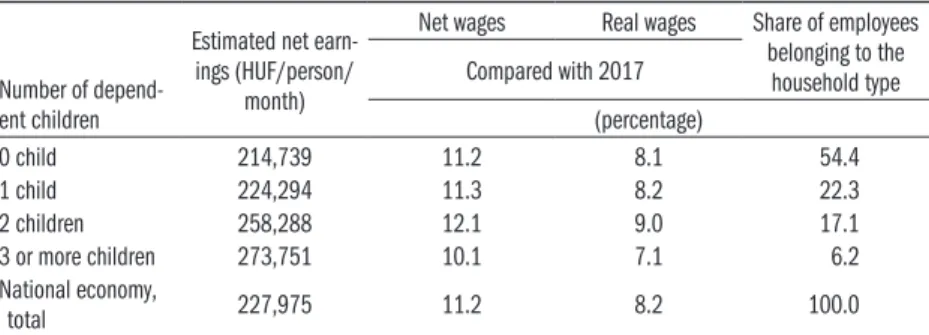
Since the personal income tax rate and the employees’ contributions rates in 2018 were identical to those in the previous year, net earnings (excluding the family tax benefit) increased at the same rate as gross earnings. Exclud- ing public works participants, average net earnings were HUF 227.6 thou- sand in businesses employing at least 5 persons and HUF 230 thousand in state-funded institutions. Consumer prices rose by 2.8 per cent on average in 2018, resulting in an 8.3 percent improvement in real earnings. The only significant tax change affecting a wide range of employees was the further in- crease in the family tax benefit for families with two children (Table 6). As a result, they were able to deduct HUF 116 670 per child from their person-
15 The wages of government officials are also expected to increase (by 30 per cent on average) in 2019, accompanied by a 15 percent downsizing in 2018 in order to cover the re- lated costs and by increased daily work hours and reduced duration of paid holiday, that is by increased workload.
16 Teachers were promised an- other 30 percent pay rise to take place in 2020.
17 Excluding public works par- ticipants.
18 A few thousand workers at non-profit organisations with delegated public duties are also eligible to compensation, in their case HUF 7,300.
al income tax base in 2018, compared with HUF 100 thousand per child in 2017 (and HUF 62,500 at the launch of the scheme in 2011). Those with one child were able to reduce their tax base by HUF 66,670, similarly to the previous year, while parents with three or more children were able to claim a deduction of HUF 220 thousand a month. The tax benefit can be shared by parents and can also be deducted from social security contributions in the case of low-income workers.
Table 6: Net and real wages taking into account the family tax benefit, 2018
Number of depend- ent children
Estimated net earn- ings (HUF/person/
month)
Net wages Real wages Share of employees belonging to the
household type Compared with 2017
(percentage)
0 child 214,739 11.2 8.1 54.4
1 child 224,294 11.3 8.2 22.3
2 children 258,288 12.1 9.0 17.1
3 or more children 273,751 10.1 7.1 6.2
National economy,
total 227,975 11.2 8.2 100.0
Source: CSO, Monthly labour report and the microsimulation model relying on data from the EU statistics on income and living conditions (SILC).
Income from work, including the so-called “other income from work” (with cafeteria benefits as the largest item) was HUF 346.7 thousand in 2018. The amount received in addition to wages (“other income from work”) amount- ed to HUF 16.8 thousand. The growth rate of income from work was 0.1 percentage point higher (11.4 per cent) than that of wage, thus the weight of other income from work within total income from work slightly increased but still did not reach 5 per cent thereof. The growth rate and share of other income from work in 2018 was particularly significant in public administra- tion, defence and compulsory social security, where in the first half of the year a few employees received substantial extra remuneration in the form of Erzsébet vouchers, in addition to a bonus payment.
Increasing wages make labour more expensive, which may damage competi- tiveness and reduce (or even zero out) the profits of enterprises. In order to counteract negative trends in 2017, the rate of social contributions payable by employers was reduced by another 2.5 percentage points after a decrease of 5 percentage points last year (from 27 per cent to 22 per cent). Neverthe- less, according to Eurostat data, the unit cost of labour, which is a generally accepted indicator of competitiveness of production, increased in Hungary the most among the Visegrad countries between 2010 and 2018. At the same time, Hungarian labour is still cheap compared with eurozone countries and was even cheaper in 2018 than the Czech or Slovakian labour in 2017, while it was approximately equal to the Polish one.
References
CSO (2015): A kisgyermeket nevelő nők és a munkaerőpiac [Women raising young chil- dren and the labor market]. Statisztikai Tükör [Statistical Reflections], Central Sta- tistical Office, No. 55.
Köllő, J.–Kónya, I. (2020): How has unemployment risen – Estimate based on inter- net searches.