Papp S., Rădoi I. Peripheralization along the Hungary-Romania Border...
9
RHGT, Vol. XV, Issues 29-30, pp. 9-24
PERIPHERALIZATION ALONG THE HUNGARY- ROMANIA BORDER: CHANGES IN INCOME- RELATED REGIONAL DIFFERENCES OF
HUNGARIAN AND ROMANIAN SETTLEMENTS
Sándor PAPP
University of Szeged, Department of Economic and Social Geography, Hungary Email: papp.sandor.geo@gmail.com
Ilie RĂDOI
Department of Geography, West University of Timişoara, Romania Email: ilie_radoi87@yahoo.com
Abstract: Studies in spatial development among new member states of the European Union increasingly cite the phenomenon of polarization. Numerous regional analyses discuss polarization with reference to gross domestic product but understanding spatial development at the most specific local levels is challenging for lack of data. This challenge is more evident when studying municipalities along national borders because countries employ different statistical approaches and methods of collecting data. This study empirically examines changing spatial inequalities of municipalities around the Hungary–Romania border using classical inequality measures of per capita income distribution between 2007 and 2016. It documents the peripheralization that occurred along the border to identify effects of differing economic and spatial development strategies.
Key words: peripheralization, periphery, polarization, cross-border area, spatial inequalities 1.INTRODUCTION
Decades of studies have highlighted rising macro, meso, and local disparities.
They show a strengthening core-periphery relation between EU member states, a deepening divide between urban and rural regions, and escalating polarization within areas (Lang, 2011; Lang, 2015; Dubois et al., 2007). These phenomena are typical of Eastern European capitals like Bratislava, Warsaw, Prague, and Budapest that have achieved extensive development quickly (Kühn, 2015). Hungary and Romania exhibit degrees of that phenomenon (Moldovan 2017). Relative standard deviations and relative
Papp S., Rădoi I. Peripheralization along the Hungary-Romania Border...
10
ranges in Eurostat per capita GDP data show polarization in both countries between 2000–2016 for Nomenclature of Territorial Units for Statistics (NUTS) 3. Regions that siphon income, resources, and population from their less developed neighbors are not specific to this part of Europe (Eurostat). However, data imply a left-behind phenomenon in border areas mostly away from cities (Kühn, 2015). That is, centralization proceeds on one side of a border, and peripheralization intensifies on the other. Differing governmental responses (e.g., state aid, centralization, or decentralization) engender differing results (Nagy & Nagy, 2014; Allmendinger et al., 2015). The left-behind phenomenon primarily derives from post-WWI geographical rearrangements and underdevelopment of frontiers during the socialist past. Border areas require attention from policymakers, as their divergent characteristics can strengthen or hinder each other and reactions to influences inside and outside a country may impact development of border areas (Rongxing, 2015; Longo, 2018; Radoi, 2017).
This study investigates changes in per capita municipal own income among local governments in central and peripheral geographical disparities along the border between Hungary and Romania during 2007–2016. We seek to understand how income disparities at the local government level (LAU1-2/NUTS 5) evolved during that period, what processes occurred, and how opportunities for local governments changed along the Hungary–Romania border. This is important, among others, because it shows the chances, financial and other means that local governments are able to recover from their current disadvantages, in many cases. Furthermore, it shows the possibilities of active participation in possible cross-border co-operations and partnership programs, as the examined indicators show the financial possibilities of local governments and we can conclude their relative autonomy.
Figure 1. The investigated area by NUTS 3 level. Own edition
The first section outlines the concepts of periphery and peripheralization and the area studied (see Figure 1). The second section describes our method. The third section explains empirical results. The fourth outlines our findings about changes in per capita
Papp S., Rădoi I. Peripheralization along the Hungary-Romania Border...
11
income disparities between local governments. The conclusion summarizes our research.
2. PERIPHERY AND PERIPHERALIZATION
Peripheral areas are defined—usually with negative connotations—by their remoteness, isolation, and reliance on central areas for resources (Kanalas & Kiss, 2006). Nemes-Nagy distinguished three types of peripheries. Core geographical areas are privileged centers and peripheries include areas distant from it. Peripheries can feature pairings of developed and less developed locales in which degrees of dependence, autonomy, and the ability to assert interests emerge. Classifications of geographical units may differ among interpreters and change over time (Nemes-Nagy, 1996; Méreiné-Berki et al., 2017).
Peripheralization is a dynamic, multivariate, multi-level process of (re)producing peripherality. The process relates to centralization and polarizes territories. In this dynamic view, all parties contribute implicitly or explicitly to these processes. Change and reversals occur in the long run, induced by political discourse, intended or accidental economic effects, and social processes. The concept of peripheralization also very close to the geographical notions of marginalization, economic polarization or the terms of dependency and exclusion (Málovics et al., 2019), however our aim here is not to provide a systematic review of existing literature because this work is being undertaken elsewhere (Kühn, 2015; Lang, 2015).
In Nemes-Nagy‘s sense, geographical location does not inevitably determine a periphery. A border area may enjoy advantages that trigger economic and political inequalities. For instance, western borders of nations in Central Eastern Europe formerly outperformed their eastern counterparts economically, but that has changed over the long run and may change again (Lang, 2015). Reasons for this phenomenon include distance from a center area, accessibility, political-economic attributes, connections, border permeability, and functions (Rongxing, 2015; Michalski, 2019;
Jucu et al., 2017). In all, positive or negative influences accompany proximity to a national border.
3. THE HUNGARY-ROMANIA BORDER
Before the Trianon Peace Treaty (1920), areas around the Hungary–Romania border were catchments around somewhat-defined functional centers. After the treaty, geographical rearrangements disrupted economic entities that had functioned for centuries. Areas that had not necessarily been peripheral were brought into geographic, economic, or political ascendance (Nagy et al., 2012; Pénzes, 2018). Numerous subsequent events (WWII, the socialist era, political transitions, privatization, and EU membership) caused other spatial rearrangements, the effects of which diminished spatial developments and wrought geographical inequalities (Cretan & O‘Brien 2019;
Bertolini et al., 2008; Kovacs et al., 2015; Török & Benedek, 2018). However, these processes did not occur identically in Hungary and Romania, nor were reactions and effects identical. Different geographical scales render different processes and inequalities observable. In Hungarian counties bordering Romania annual GDP growth averaged 0–2% between 2001 and 2011. That figure parallels Hungary's national GDP growth (excluding Pest County and Budapest) during the same period. In Romania,
Papp S., Rădoi I. Peripheralization along the Hungary-Romania Border...
12
annual GDP growth was much higher nationally, but western Romania displayed a north-south split: Timiş and Arad Counties posted average annual growth of 3%–4%, whereas Bihar and Satu Mare achieved around 2% (ESPON). However, regional or national phenomena and processes can be obscured. Local-level studies of Hungary's eastern border reveal less favored, stagnating, and lagging settlements except for populous cities (Bertolini et al., 2008; Papp et al., 2017). Romania displays this phenomenon near major cities, but with a north-south dualism. Southern Timis and Arad counties are advantaged over their northern counterparts in almost all respects (Mitrica et al., 2017; Török & Benedek, 2018; Vesalon & Cretan, 2019).
This study examines changes in income-related disparities among the smallest (NUTS 5) municipal units along the Hungary–Romania border. The area investigated covers four counties (level NUTS 3) in Hungary (Szabolcs-Szatmár-Bereg, Hajdú- Bihar, Békés, and Csongrád-Csanád and in Romania (Satu-Mare, Bihor, Arad, and Timis).
4. MATERIAL AND METHODS
We compiled data from official statistics of both countries (see Table 1).
Incomes for Hungarian municipalities—i.e., ―public authority incomes"—include local taxes (building and property tax, tourist tax, business tax), assorted other taxes, and environmental or administrative fines. They also include income ceded by Hungary's state redistribution mechanism (car tax, personal income tax) (Erdős, 2014). We refer to these collectively as "own revenue." Hungary's Act 2011/CLXXXIX significantly altered budgets and management of Hungarian municipalities. After January 1, 2013, task-based payments supplanted distributions previously determined by the size of general or specific populations (e.g., number of students). The change initiated goal- oriented and economical management, but income reallocation became stringent and centralized. This law also determines what revenues municipalities receive, although parliament annually determines amounts subsidized from the central budget1. After 2013, amounts of revenue ceded from the central budget changed. Previously, 40% of personal income taxes and 100% of car taxes remained with municipalities. Amounts fell to 40% of car taxes, and only revenues from taxing income from leasing land remained in place (Erdős, 2014). Municipalities' own revenues averaged 14.5% of their annual budgets in 2016 versus 51% in 20071. These measures sought to stabilize operations of chaotic and often improvident local governments, but in practice they centralized access to and management of financial resources. As a result, municipal sovereignty was undermined and dependency on the central government has strengthened.
Table 1. Databases Analyzed Permanent population, Hungary TeIR2
Municipal own revenues, Hungary TeIR – Hungarian State Treasury2 Permanent population, Romania Tempo Online7
Municipal Own Revenue, Romania (Venituri Proprii)
Ministry of Regional Development and Public Administration, Romania8
Papp S., Rădoi I. Peripheralization along the Hungary-Romania Border...
13
Romania's redistribution mechanism differs from Hungary's. Locally collected income taxes remain with local governments, part goes to the county government, and part is redistributed to intra-county municipalities and governments. Romania's Act No 2006/273 on Public Finances regulated local finances and redistribution of personal income tax (PIT) until 2017. About 47% of PIT remained with municipalities between 2012–2017, and 41.75% remained thereafter3,4. Local taxes and fees almost parallel those in Hungary (property tax, real estate tax, vehicle tax). Tax rates are set annually by a council of local governments, and only the local government can allocate revenues5,6. Revenue from local taxes and the remainder of income tax revenue comprise local governments' own revenue, which is about 40% of their total revenue3. Our calculations exclude income from value-added tax, intra-county redistributions, subsidies, accumulations, and other operating income. Studies like ours usually investigate per capita GDP of geographical units, but no such data exist for the small Hungarian or Romanian settlements we investigate (LAU 1-2) (Török & Benedek, 2018). Per capita GDP data are available for comparisons between the two countries or NUTS 2-3 levels. We divided total amount of we specified ‗own revenues‘ of municipalities by numbers of permanent residents in official databases to derive nominal values in Hungarian forint (HUF) and Romanian lei (RON) per-person per year for 2007–2016. These indicators should be compared with caution, but they are suitable for examining shifting inequalities between intra-country units. Therefore, our comparative analysis examines areas of Hungary and Romania in relative terms only. It does not attempt direct comparisons or qualifications.
Data for Hungary and Romania do not fully overlap. Hungarian data are available for 1990–2016 and Romanian data are available for 1999–2018. Romania revaluated its currency on July 1, 2005, which makes complicates comparisons with previous years9. For comparability and to accommodate data availability, we take 2007 as the base year for both countries and compare 2007 with 2016 as the most recent common year. We compare trends over time using classic measures of geographic inequality: relative ranges (RR), relative standard deviation (RSD), the Hirschmann–
Herfindahl index (HHI), Gini coefficients, and the Hoover index (Dusek & Kotosz, 2016). Administrative areas changed during 2007–2016 (e.g., new settlements, spin-offs from a mother settlement), so we excluded municipal units that did not exist for at least one year during the surveyed period. No such changes occurred in Hungary, but five occurred in Romania: Toboliu, Racsa, Bucovăț, Otelec, and Pesac. Thus, we investigated 446 Hungarian settlements and 338 Romanian communes and cities. For narrative simplicity we refer to all municipal units as settlements.
Our calculations were performed using Microsoft Excel and SPSS programs.
The maps and figures were edited with the help of Quatum GIS open source geoinformatics software, for which the open source shp files were obtained from the OpenStreetMap12 (Hungarian) and GeoSpatial13 (Romanian) pages. The scale intervals of the maps were formed, where possible, by natural breaks, where appropriate, at our own discretion. In the case of Figure 2, it was necessary to use separate legends and color codes for the parts of the countries because the differences resulting from the different processes justified this. The same was not justified for the other figures.
Papp S., Rădoi I. Peripheralization along the Hungary-Romania Border...
14
5. OVERVIEW OF GENERAL INCOME INEQUALITIES
We first analyzed arithmetic means and RRs. Differing currencies made static comparison of the two country areas meaningless, so we examined the percentages of change in own income between the onset of 2007 and 2016. Table 2 shows that mean changes in income differ significantly astride the border, mainly because of differences and modifications in the legal environment and redistribution mechanisms between administrative units. Settlements along the Hungarian side of the border experienced a 77.61% reduction in mean own revenues; the Romanian experienced an 83.48%
increase. RSD measures deviations from an arithmetic mean with greater values indicating greater territorial differences. Based on averages and population-weighted values, it more than doubled in Hungary and declined 75% in Romania. RR measures the difference between minimum and maximum per capita municipal incomes of settlements and average. This measure shows the difference between settlements with the highest and lowest values. RSD on the Hungarian side increased three-fold during 2007–2016 and declined 75% on the Romanian side. Those results indicate diminishing extremes on the Romanian side and widening extremes on the Hungarian side.
Table 2. Percentage Change in Mean, Relative Standard Deviation, and Relative Range for Municipalities' Own Income astride the Hungary–Romania Border 2007–2016
Indicator Hungarian
side
Romanian side
Mean ˗77.61 83.48
Relative Standard Deviation
259.69 ˗75.53 Relative Range 304.32 ˗75.01
We examined the Dual Index, which measures income inequalities and compares the average of two subsets of two series of data (Éltető & Frigyes, 1968). The index intervals are [1, ∞], with the minimum value indicating total absence of inequality (Dusek & Kotosz, 2016). All settlements along both sides of the border formed 1-1 groups separately, and we compared values of the lower and higher subgroups. Hence, we calculated the index on a per-capita basis we computed weighted averages (see Table 3). In 2013, inequality doubled on the Hungarian side, whereas trends on the Romanian side remained relatively stable.
Table 3. Dual Index Values for Municipalities' Own Income astride the Hungary–Romania Border 2007–2016
Year 2007 2008 2009 2010 2011 2012 2013 2014 2015 2016 Hungary 1.56 1.36 1.38 1.37 1.49 1.43 3.16 2.96 3.28 3.17 Romania 2.29 1.70 2.18 2.07 1.65 1.74 2.50 2.27 2.45 2.01
After dual indexing we examined the HHI, which expresses spatial concentration. We normalized its intervals at [0,1] in which 1 indicates total deconcentration of a given unit and 0 indicates total equality (Dusek & Kotosz, 2016).
A ratio for per capita income—the basis of this study—is available, so we calculated
Papp S., Rădoi I. Peripheralization along the Hungary-Romania Border...
15
population and income data separately (see Table 4). Results show that changes in permanent population are lower than changes in income, and no significant event affected that relation in any locale during 2007–2016. However, figures show a relatively high initial difference between Hungary and Romania related to income.
Hungarian values show slower growth and consolidate after a higher rise in 2013.
Romanian values show a somewhat steady decline since the start of the period and almost equal Hungary's values in 2016. Thus, during 2007–2016 Hungary's values doubled, and Romania's values declined more than 25%.
Table 4. Hirschmann–Herfindahl Index Values for Municipalities' Own Income and Population astride the Hungary–Romania Border 2007–2016
Year 2007 2008 2009 2010 2011 2012 2013 2014 2015 2016 Income
Hungary
0.031 0.045 0.046 0.044 0.043 0.044 0.072 0.068 0.071 0.073 Income
Romania
0.100 0.104 0.090 0.089 0.088 0.086 0.080 0.077 0.078 0.074 Pop.
Hungary
0.025 0.025 0.025 0.025 0.025 0.026 0.026 0.026 0.026 0.026 Pop.
Romania
0.043 0.043 0.043 0.043 0.042 0.042 0.042 0.042 0.042 0.042
Also called the Robin Hood index and the dissimilarity index, the Hoover index of geographical disparities and is a widely used because of its easy predictability (Dusek
& Kotosz, 2016). Its value indicates what portion of total municipalities' own income would have to be redistributed from the richer half the poorer half of the municipalities to achieve uniformity income. We set its intervals as percentages [0,100], although intervals often appear as [0,1] in other studies. Table 5 compares distributions of own income and population. As with previous indicators, values for Romanian settlements were several times greater than for Hungarian settlements at the start of 2007, indicating far greater inequality. Hungarian values do not display steady and balanced growth.
Note, for example, further research is needed to better understand the leaps in 2008 and 2013. Romanian border locales declined steadily until 2013–2014, after which inequalities diminish. As with previous indicators, the Hoover index shows a reversal in imbalances astride the border.
Table 5. Hoover Index Values for Municipalities' Own Income and Population astride the Hungary–Romania Border 2007–2016
Year 2007 2008 2009 2010 2011 2012 2013 2014 2015 2016 Hungary 7.23 13.37 13.54 13.14 13.18 13.16 29.10 28.47 29.25 29.58 Romania 35.77 34.47 32.86 32.37 32.47 31.87 17.64 29.84 17.96 16.13
The population-weighted Gini coefficient, our fourth indictor, is another widespread measure of income inequality. Its values span [0,1], with 0 indicating equal spatial distribution of income (Dusek & Kotosz, 2016). Its values mirror previous indicators. Inequality declines (rises) among Romanian (Hungarian) settlements in Table 6.
Papp S., Rădoi I. Peripheralization along the Hungary-Romania Border...
16
Table 6. Gini Coefficient Values for Municipalities' Own Income and Population astride the Hungary–Romania Border 2007–2016
Year 2007 2008 2009 2010 2011 2012 2013 2014 2015 2016 Hungary 0.097 0.170 0.174 0.167 0.169 0.172 0.365 0.354 0.363 0.367 Romania 0.505 0.496 0.472 0.469 0.470 0.465 0.235 0.439 0.245 0.219
Almost all indicators show rising (slightly declining) inequalities among Hungarian (Romanian) settlements. However, results are swayed by divergences among administrative units along the border, settlement networks, demographics, economic features, and the change, existence or absence of central government provisions and laws. After our general analysis, we examine percentage changes in local governments' per capita income and their ordinal position.
6. CHANGES OF PER CAPITA INCOME IN SETTLEMENTS
We analyzed the percentage change on the 2007 relative from values of 2016 to reveal percentage changes in per capita income over a period. At first glance, due to differences and changes in legislation render conditions quite different astride the border. Among Hungarian settlements, a significant portion of revenue from quasi-free or local sources was withdrawn from most local governments between 2007 and 2016.
They apparently suffered a significant constriction in sources of revenue. That phenomenon occurred to differing degrees and under differing circumstances in Romania due to lack of legal reforms affecting local government revenue. On the other hand, 2007–2016 spans the period just before and after Romania joined the EU and attracted unprecedented foreign direct investment, notably to its western regions (Dornean & Oanea, 2015; Cretan et al., 2017; Vesalon & Cretan, 2019). As a result, industrial parks and manufacturing facilities arose in Romania, generating municipal revenues from business and personal income taxes. Like the results of inequality indicators, the own income of most Hungarian border municipalities fell significantly during 2007–2016. The few that increased own income generally benefitted from local business taxes tied to large individual investments. For example: HENKEL in Körösladány, MOL in Algyő. Small settlements — which account for almost 60% of Hungarian border settlements — suffered an 85% average loss of revenue. Given their demographics, social capital, and economic capacities, these settlements could not perform functions essential to self-government, many of which were assumed by the state, and they shrunk even further from diminished budgets. Although the amounts of population-based normative subsidies were not significantly high, the decline in assigned revenue largely determined the financial opportunities of these municipalities.
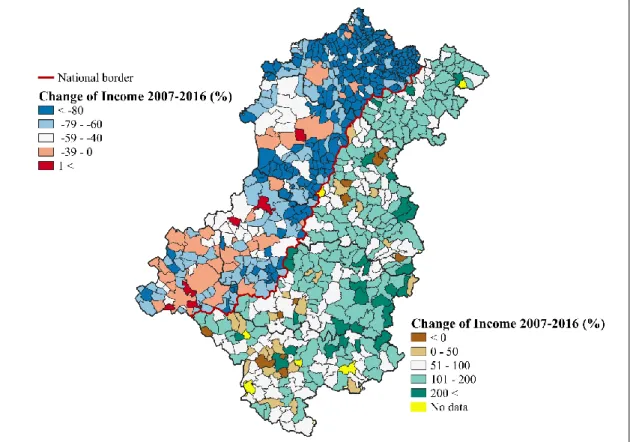
The territorial pattern relates closely to settlement structure, a phenomenon that primarily struck villages in northeast Hungary during 2007-2016 (see Figure 2).
Among Romanian settlements, the situation is quite different, with growth being typical. More so because, unlike Hungary, values for settlements with population under 2,000 changed the most, an average 150%. Settlements with populations of 2,000 to 5,000—more than the half of all Romanian settlements—boosted per capita municipal income 108% on average. Cities exceeding 100,000 increased municipal income 474%.
Romanian regional and economic development aligns with the growth poles theory and
Papp S., Rădoi I. Peripheralization along the Hungary-Romania Border...
17
captured the benefits of agglomeration, demographics and social capital in conjunction with efficiency of central planning (Benedek et. al. 2019; 10). Regional groupings of decline are less pronounced and is localized mostly around populous cities, perhaps because of high initial values referred to year 2007. Further research is needed to better understand the reasons for that phenomena, however based on our presumptions it could related to the PIT anomalies and to the transportation of high proportion of non- residents to local workplaces. Also, further studies needed to explore the reasons of growth in the eastern part of Arad county.
Figure 2. Percentage Change in Per Capita Municipal Income: 2007 versus 2016.
Own Edition. Data: 2,7,8
7. CHANGES IN ORDINAL RANKING OF SETTLEMENTS
Percentage changes alone do not reveal changes in the rankings of locales astride the border. Therefore, we examined their ordination based on per capita income, paying detailed attention to disadvantaged settlements. Comparing initial 2007 and final 2016 rankings, we ran a Spearman rank correlation of settlements on both sides of the border.
The results are ˗0.242 among Hungarian and 0.790 among Romanian border settlements. Relatively large shifts occurred on the Hungarian side, whereas little changed on the Romanian side. Figure 3 shows changes in ordinal rankings.
Displacements of the two populations from the mean (0) are expressed as percentages for improved comparability. Hungarian settlements in Csongrád-Csanád and Békés Counties advanced most in ranking, whereas most villages in Szabolcs-Szatmár-Bereg County slid significantly.
Papp S., Rădoi I. Peripheralization along the Hungary-Romania Border...
18
Again, we must acknowledge constraints among settlements in the area studied.
Comparing values of settlements in counties near the border with more distant counties clarifies the disadvantaged situation of small northern settlements in Hungary versus their southern counterparts. Romanian settlements exhibit no such realignment in rankings. Far fewer rankings for Romanian settlements changed. Most striking are the breakout of Timisoara, the relative loss of settlements around Arad, and the relative advance of settlements in the eastern highlands of Arad County. At this point of the study–except for the case of development of Timisoara (Jucu et al. 2017)–further research needed to understand the reasons for that, and we do not want to draw inaccurate conclusions.
Figure 3. Changes in Ranking of Settlements based on Per Capita Income between 2007 and 2016. Own Edition. Data: 2,7,8
8. CHANGES IN DISADVANTAGED STANDING
Changes among disadvantage settlements are not necessarily revealed by percentage changes in their per capital own municipal incomes or changes in ranking.
Pursuant to the Hungarian Government Decree 105/2015, we examined the extent to which the number of settlements classified as disadvantaged changed during 2007–
201611. We classified settlements as disadvantaged if their per capita income stood in the lowest third in each country. We also constructed a separate comparison for 2007 and 2016. Results show that 149 of 446 Hungarian settlements and 113 of 338
Papp S., Rădoi I. Peripheralization along the Hungary-Romania Border...
19
Romanian settlements were disadvantaged. Figure 4 shows which settlements escaped their disadvantaged standing, and which remained disadvantaged between 2007 and 2016.
Figure 4. Change in Disadvantaged Standing of Hungarian and Romanian Settlements between 2007 and 2016. (ND means Non-Disadvantaged, D means Disadvantaged)
Own Edition. Data: 2,7,8
In alignment with previous results, changes among Hungarian border settlements are more noticeable, and its small northern villages are most adversely affected.
Although there are no major changes among Romania's settlements, its northern area is the most disadvantaged. Persistent inequalities indicated in dark blue color call attention to most of Satu Mare County and north and central Bihor County. The relative dominance of Timis and Arad Counties is also remarkable. Timis features no disadvantaged settlements. Arad in the mountainous northeast can be considered a disadvantaged peripheral area.
9. CONCLUSIONS
This study has examined changes in per capita income disparities among local governments along the Romanian–Hungarian border between 2007 and 2016. We calculated widely used general indicators of geographical differences as well as percentage changes in municipalities' own incomes and reordering of positions.
Indicators of inequality revealed that per capita municipal incomes varied to differing
Papp S., Rădoi I. Peripheralization along the Hungary-Romania Border...
20
extents on both sides of the border. The large decline on the Hungarian side and geographical reorganization are largely attributable to local government and tax reforms in 2013. Similar reforms have occurred among Romanian border settlements, however, and local governments' own revenues rose significantly during 2007–2016, although not necessarily in the same extent among settlements along the western border.
In the long run, the Hungarian system's task-based subsidies could foster territorial differences, and redistribution via centralized authority may prove more effective than economic decisions by local governments. As our results indicate, however, opportunities for disadvantaged, less populous, peripheral settlements were limited during 2007–2016, and legal reforms clearly favored centralization. If we view the periphery as a result produced and continuously reproduced by various social, economic and political processes (Timár, 2016), whether in connection with the ideas of unequal development or top-down territorial development, it may come to consequences that project widening polarization processes resulting from unfair redistribution mechanisms. Among Romania's border settlements, 2007–2016 coincided with economic growth and growth in local government revenues. However, growth was unbalanced. Results also show that conditions among advantaged settlements improved more than among disadvantaged settlements, especially for the most populous cities in the region (e.g., Timisoara, Oradea, and Arad). The stable disadvantage of the (mainly rural) areas of north-western Romania is, inter alia, in line with the central government's metropolitan development strategies and market expectations, which favor the advantages offered by urban spaces. This is accompanied by the proximity of the Hungarian and Ukrainian borders, to which there is currently no special political or economic interest, so the chances of overcoming their disadvantage are not much different from those of their counterparts on the Hungarian side. These areas are not only disadvantaged in relative terms, but they are also more vulnerable to possible negative effects of external shocks, which is not a negligible phenomenon for economic and community resilience either (Iordan et al. 2015; Papp 2020).
We do not claim that situations along the border favor Romanian or Hungarian settlements because divergent data, legislation, and administrative systems impair such comparisons. Administrative differences resulting from the design, management, statistical function, and use of different LAU levels constitute limitations on our research. Romania's local administrative unit (the commune) includes smaller settlements that cannot be decomposed further; if they could be decomposed, perhaps statistical patterns might resemble Hungarian settlements. Were these treated separately, results could change greatly, although absence of data made separate treatment impossible. Examining a larger number of municipalities might influence our results.
Also, the indicator itself is not as universal as the Human Development Index or quality of life indicators. So, it is only with reservations that we can draw far-reaching conclusions, but this, however, was not the aim of our research.
Furthermore, the comparisons and the relative changes examined have been made within the investigated units. The lowest and highest values of the two sub- regions examined were extremes, so our calculations and comparisons were always carried out within these limits. Changing the boundaries of the examined area might yield different results. Over the same time span, intra-country disparities may have risen or declined, while diminishing increases in disparities within geographical subunits may have been observed, and the results would be incorrectly generalized to the whole.
Obviously, it cannot be said that these processes were observed only in the study area
Papp S., Rădoi I. Peripheralization along the Hungary-Romania Border...
21
during the examined period, but we did not aim to examine this. One future goal is to extend this study to the entire territory of Hungary and Romania, which could overcome some limitations indicated above and might originate more relevant conclusions. We also want to examine peripheralization in more depth by documenting its location- specific causes and consequences.
Notes
1 According to Act CCIV/2012: Magyarország 2013. évi központi költségvetéséről. (On the central budget of Hungary for 2013) (Available: https://mkogy.jogtar.hu/jogszabaly?docid=a1200204.TV) (14.09.2020).
2 TeIR (https://www.teir.hu)
3 According to Erdélystat 2019 (Available: http://statisztikak.erdelystat.ro/cikkek/kiemelkedo-az-erdelyi- onkormanyzatok-jovedelme/18) (14.09.2020).
4 According to Law No. 273/2006: privind finanţele publice locale (Available:
https://lege5.ro/Gratuit/ha3tgnjw/legea-nr-273-2006-privind-finantele-publice-locale) (14.09.2020).
5 According to Law No. 227/2015: privind Codul fiscal (Available:
https://static.anaf.ro/static/10/Anaf/legislatie/L_227_2015.htm) (14.09.2020).
6 According to Önkormányzati Kisokos 2016 (Municipal Clerk) Available: https://miert.ro/wp- content/uploads/2016/05/miert-kisokos-2016-05-05-10-10.pdf (14.09.2020).
7 Tempo Online (http://statistici.insse.ro:8077/tempo-online/#/pages/tables/insse-table)
8 According to Ministerul Lucrarilor Publice, Dezvoltarii si Administratiei (Available:
http://www.dpfbl.mdrap.ro/sit_ven_si_chelt_uat.html) (14.09.2020).
9 According to: https://www.origo.hu/gazdasag/20050630pentektol.html (14.09.2020).
10 According to http://fzmaur.ro/StudiuPOLICENTRIC.pdf (14.09.2020).
11 According to 105/2015. (IV. 23.) Korm. Rend. a kedvezményezett települések besorolásáról és a besorolás feltételrendszeréről (Government Decree: on the classification of beneficiary settlements and
the system of conditions for classification) Available:
https://net.jogtar.hu/jogszabaly?docid=a1500105.kor (14.09.2020).
12 Open Street Map (https://data2.openstreetmap.hu/hatarok/index.php?admin=8) (14.09.2020).
13 Geo-Spatial (http://www.geo-spatial.org/download/romania-seturi-vectoriale?fbclid=IwAR0UQrenc Oa1D89Fe-ChmFKUAL5ja8phNZ2iMUSsiPaE11det-dtOpZcQcc) (04.04.2019).
Acknowledgement
This work was supported by the NTP-NFTÖ-19-B Scholarship for Young Talents of the Nation of the Ministry of Human Capacities. We would like to thank the two anonymous reviewers and the editors of RHGT for their helpful suggestions for improving our paper.
REFERENCES
Allmendinger, P., Haughton, G., Knieling, J., Othengrafen, F., (2015), Soft Spaces in Europe. Re-negotiating governance, boundaries and borders. Abingdon: Routledge.
Benedek, J., Varvari, S., Litan, C. M., (2019), Urban Growth Pole Policy and Regional Development: Old Wine in New Bottles? In Lang T. & Görmar F. (Eds.), Regional and Local Development in Times of Polarisation. New Geographies of Europe, pp. 173-195.
Singapore: Palgrave Macmillan.
Bertolini, P., Montanari, M., Peragine, V., (2008), Poverty and Social Exclusion in Rural Areas. Final Report, European Commission, Directorate-General for Employment, Social Affairs and Equal Opportunities.
Papp S., Rădoi I. Peripheralization along the Hungary-Romania Border...
22
Cretan, R., Guran, L., Platon, D., Turnock, D., (2017), Foreign Direct Investment and Social Risk in Romania: Progress in Less-favoured Areas. In: Turnock, D., Foreign Direct Investment in Eastern Europe and the former Soviet Union. Ashgate: Aldershot.
Cretan, R. & O’Brien, T., (2019), ‗Get out of Traian Square!‘: Roma Stigmatisation as a Mobilising Tool for the Far Right in Timişoara, Romania. International Journal of Urban and Regional Research, 43, 5, pp. 833-847.
Dubois, A. et al., (2007), Regional Disparities and Cohesion: What Strategies for the Future?
Report to the Directorate General Internal Policies of the Union. European Parliament, Brussels.
Dornean, A. & Oanea, D. C., (2015), FDI Territorial Distribution in Romania. Procedia Economics and Finance, 32, pp. 610-617.
Dusek T. & Kotosz B., (2016), Területi Statisztika. Akadémiai Kiadó, Budapest.
Erdős, É., (2014), Önkormányzati pénzügyek, az önkormányzatok gazdálkodási rendszere.
Nemzeti Közszolgálati Egyetem.
Éltető, Ö. & Frigyes, E., (1968), Új jövedelem-egyenlőtlenségi mutatók, tulajdonságaik és hasznosítási lehetőségeik. Szigma, 1, pp. 17-28.
Iordan, M., Chilian, M., Grigorescu, A. (2015), Regional Resilience in Romania - Between Realism and Aspirations. Procedia Economics and Finance, 22, pp. 627-635.
Jucu, I., Cretan, R., Timofte, F., (2017), Economic restructuring and contrasting urban patters in Romanian post-socialist municipalities: the experiences of Timis county, Romania.
Review of Historical Geography and Toponomastics, 11, 21-22, pp. 79-96.
Kanalas, A. & Kiss, A., (2006), A perifériaképződés típusai és megjelenési formái Magyarországon. Great Plain Research Institute of the CRS of the HAS, Kecskemét.
Kovács, Z. et. al., (2015), Development policies on rural peripheral areas in Visegrad countries:
a comparative policy analysis. Studia Obszarow Wiejskich/Rural Studies 39, pp. 77-101.
Kühn, M., (2015), Peripheralization: Theoretical Concepts Explaining Socio-Spatial Inequalities. European Planning Studies 23(2) pp. 367-378.
Lang, T., (2011), Regional development issues in Central and Eastern Europe: shifting research agendas from a focus on peripheries to peripheralisation? In: Erőss, Á. & Karácsonyi, D. (Eds.), Geography in Visegrad and Neighbour Countries, pp. 57–64. Geographical Research Institute HAS, Budapest.
Lang, T., (2015), Socio-economic and political responses to regional polarisation and socio- spatial peripheralisation in Central and Eastern Europe: a research agenda. Hungarian Geographical Bulletin 64(3), pp. 171-185.
Longo, M., (2018), The politics of borders: Sovereignty, security, and the citizen after 9/11.
Cambridge University Press, Cambridge.
Pénzes, J., (2018), Fejlettségi különbségek a történelmi Magyarország térszerkezetében (1910).
A perifériák lehatárolásánál használt módszerek történeti alkalmazásának összevetése és eredményei. In: Demeter, G. & Szulovszky, J. (Eds.), Területi egyenlőtlenségek nyomában a történeti Magyarországon. Módszerek és megközelítések. SzuloPress Bt., Budapest–Debrecen.
Papp, S., (2020), Community resilience in post-socialist rural areas. The case of grape- and wine producing community in Soltvadkert and Minis-Maderat area. Belvedere Meridionale (accepted).
Papp, S., Nagy, Gy., Boros, L., (2017), Alternatives for the Delimitation of the Favoured Settlements According to Quality of Life in Hungary. Területi Statisztika, 57(6), pp.
639-664.
Radoi, I., (2017), Impact of Cultural Cross-Border Cooperation on Sustainable Development Case Study: Romania and Serbia. Review of Historical Geography and Toponomastics, 12, 23-24, pp. 75-82.
Rongxing, G., (2015), Cross-Border Management. Theory, Method and Application. London:
Springer.
Papp S., Rădoi I. Peripheralization along the Hungary-Romania Border...
23
Málovics, Gy., Cretan, R., Méreiné-Berki, B., Tóth, J., (2019), Socio-environmental justice, participatory development, and empowerment of segregated urban Roma: Lessons from Szeged, Hungary. Cities, 91, pp. 137-145.
Méreiné-Berki, B., Málovics, Gy., Tóth, J., Cretan, R., (2017), The role of social capital and interpersonal relations in the alleviation of extreme poverty and spatial segregation of Romani people in Szeged. Journal of Urban and Regional Analysis, 9, 1, pp. 33-50.
Michalksi, T., (2019), The Influence of the Polish-Russian Border on the Development Opportunities of the Polish Border Region. Journal of Settlements and Spatial Planning 10(2), pp. 89-97.
Mitrica, B. et al., (2017), Socio-Economic Disparities in the Development of the Romania‘s Border Areas. Social Indicators Research, 134, pp. 899–916.
Moldovan, A., (2017), Peripherialisation as a result and driving force of territorial mobility in post-socialist Romania. European Spatial Research and Policy, 24(2), pp. 39-57.
Nagy, E. & Nagy, G., (2014), Polarizáció–Függőség–Krízis – Eltérő térbeli válaszok. Great Plain Research Institute of the CRS of the HAS, Budapest – Békéscsaba.
Nagy, G., Nagy, E., Timár, J., (2012), The Changing Meaning of Core–Periphery Relations in a Non-Metropolitan ―Urban Region‖ at the Hungarian–Romanian Border, disP - The Planning Review, 48(2), pp. 93-105.
Nemes-Nagy J., (1996), Centrumok és perifériák a piacgazdasági átmenetben. Földrajzi Közlemények 1(1), pp. 31-48.
Timár, J., (2017), Az egyenlőtlen térbeli fejlődés – a konceptualizálás hiánya és lehetőségei.
Tér és Társadalom, 30, 3, pp. 106-112.
Török, I. & Benedek, J., (2018), Spatial Patterns of Local Income Inequalities. Journal of Settlements and Spatial Planning, 9(2), pp. 77-91.
Vesalon, L. & Cretan, R., (2019), ‗Little Vienna‘ or ‗European avant-garde city‘? Branding narratives in a Romanian city. Journal of Urban and Regional Analysis, 11, 1, pp. 19- 34.
Papp S., Rădoi I. Peripheralization along the Hungary-Romania Border...
24