Measuring the effect of spatial inhomogeneity of CT images on post- reconstruction liver fat quantification
J. Benedek Kis, Róbert Kákonyi, Ádám Perényi, András Kriston, László Ruskó, Miklós Erdélyi, Zsolt Berényi, András Palkó, Gábor Szabó
Abstract
Objectives: The accuracy of image-based dual-energy methods depends on the accuracy of CT numbers, but CT imaging is degraded by system imperfections, which cause spatial CT number bias. The goal of this study is to measure and correct the effect of image inhomogeneity on image-based dual-energy fat quantification.
Materials and methods: The CT number linearity of fat ratio was evaluated by experimental verification of phantom samples containing melted fat and minced tissue or food products with known fat content. A correction method is proposed to handle the occurring intensity bias. A water image is used to obtain a bias map, and the latter is used to correct the reference point values of 0% and 100% fat containing voxel, which are the end values of the used linear fat scale. The fat content of a voxel is derived from the corrected fat-scale. The results with and without correction are compared.
Results: The calculation shows that the proposed fat quantification method is more accurate due to the elimination of intensity bias.
Key Words: liver fat content, computed tomography, image inhomogeneity, dual-energy I. Introduction
Fatty liver is an abnormal condition which is most commonly associated with alcoholic liver disease and non-alcoholic fatty liver disease, including but not limited to metabolic syndrome, nutritional abnormalities, viral hepatitis, and the use of certain drugs.1
In several cases it would be advantageous to detect hepatic steatosis, because progression to a more severe condition, such as steatohepatitis, cirrhosis or hepatocellular carcinoma may be prevented by early treatment. In addition, liver fat content is important to consider in living donors, as a fat content of 30% or more contraindicates liver donation.2,3,4 Hepatic steatosis may reflect the toxicity of a variety of drugs.5,6
In certain instances, e.g. planned liver surgery and transplantation, there is a need for the determination and longitudinal follow-up of liver fat content to see the changes along with the disease status or applied therapy. Consequently, it is vital to find a method with the highest possible sensitivity, specificity and reproducibility. It should be easy to perform and should be safe for the patient.
Currently, liver biopsy is considered to be the gold standard in the assessment of liver fat content. Biopsy has some disadvantages, as it is operator-dependent the sample may not represent the entire liver, there is a risk of infection, internal bleeding, and biliary leakage, and there is a 0.2% chance of mortality following the procedure due to hemorrhage and other complications. This rate proved to be significantly higher in cancer patients.7
To grade steatosis, pathologists visually estimate the fraction of hepatocytes that contain fat droplets without considering the size of fat droplets. Normally, a five-point ordinal scale is used (0%, 1%–5%, 6%–33%, 34%–66%, 67%).1
Considering the above risks, non-invasive cross-sectional imaging (CT, MR, and ultrasound) of the abdomen may be alternative methods to liver biopsy. Several studies using computed tomography have investigated the quantification of hepatic steatosis, and it has been demonstrated that CT numbers (Hounsfield Units) decrease when the fat content of the liver increases.8,9,10,11
Raptopoulos et al. demonstrated that also the attenuation difference between dual-energy CT images on each energy level and fat content have a linear relationship.12 Michael A. Fischer and others concluded that dual-energy CT is feasible to measure fat content in the presence of iron and iodine.13
However, despite the success of image quality improvement with dual-energy material decomposition, dual-energy quantification is limited due to system imperfections. CT images are degraded or modified by physical processes (beam hardening, scattering, quantum and electronic noise, effect of bowtie filter etc.) and different image processing algorithms (reconstruction, scatter and noise reduction, and beam hardening correction). For accurate measurement of material composition, one must handle the occurring inaccuracies of CT numbers. The main purpose of this study is to measure the effect of spatial inhomogeneity on material decomposition with an experiment, using a fat phantom and single-energy CT. Dual- energy measurements were performed by slow kV-switching technique.14 The use of pre- calibration is proposed in order to perform a simple inhomogenity correction. Furthermore, the reduction of quantification error was measured by the proposed correction method.
II. Materials and methods
Fig. 1 shows the applied phantom. A sample holder of 33 cm in diameter was made from a PVC tube. Both ends of the phantom were covered with PVC disks and metallic clips so that the container could be filled with water. On the top of the phantom, two openings were created for filling it with water. The phantom has two inner holders, one contains eppendorfs (2ml) of meat or liver and fat mixtures, and the other side contains dairy and related products.
Fig. 0. The sample holder. Slices of tissue samples (a), water or air (b) and dairy and related products (c) were used for the calculations.
The soft tissue samples were mixtures of fresh porcine liver or porcine thigh and porcine fat.
To obtain the desired fat weight ratio, the total mass for all samples were 100 grams. To
ensure the homogeneity of samples, the fat was heated to make it liquid, and the soft tissues were minced and reduced to a pulp. After homogenization, the components were mixed.
Although a syringe was used to fill the vials, some air bubbles got into the vials. Local inhomogeneity was observable in the liver-fat samples; little pieces of liver were visible after mixing the components. By averaging more than 250 voxels per vial, the effect of local inhomogeneity caused by imperfect mixing can be avoided (see below).
The phantom was designed to include 22 samples that mimic fatty liver, 22*2 vials containing fatty soft tissue, and 21*3 containing various dairy and related products in ring arrangement, see Fig. 2. Radiuses of sample rings are 60, 95 and 130 mm.
Fig. 0. The arrangement of fatty tissues (a) and dairy and related products (b). In the first arrangement (a) the outer and inner rings contain minced porcine thigh and porcine fat. The outer and the inner ring contain the same samples. Vial pairs with the same sample were inserted in the phantom next to each
other. The eppendorfs of the middle ring were filled with the mixture of porcine liver and fat. Vials contain the same mixtures two by two in each ring. Fat content increases from 0% to 100% in increasing steps (0, 5, 10, 15, 20, 25, 30, 40, 60, 80, 100w%). Samples of several dairy and related products were used
in the second arrangement (b). Fat content increases from 1.5% to 82% in various steps, determined by the fat-content of each dairy and related product.
Dairy and related products were used to obtain near perfectly homogeneous fat samples.
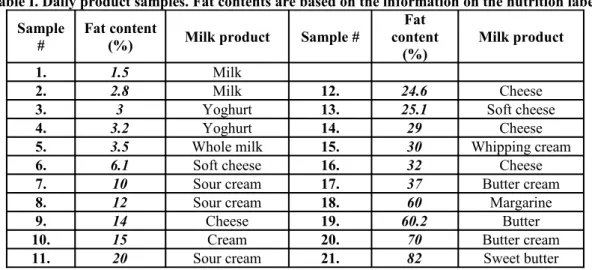
Butter, margarine and different sorts of cheese were melted in a microwave oven to make them fluid, in order to be able to fill the vials. Samples with different fat contents are listed in Table I.
Table I. Daily product samples. Fat contents are based on the information on the nutrition label.
Sample
# Fat content
(%) Milk product Sample #
Fat content
(%) Milk product
1. 1.5 Milk
2. 2.8 Milk 12. 24.6 Cheese
3. 3 Yoghurt 13. 25.1 Soft cheese
4. 3.2 Yoghurt 14. 29 Cheese
5. 3.5 Whole milk 15. 30 Whipping cream
6. 6.1 Soft cheese 16. 32 Cheese
7. 10 Sour cream 17. 37 Butter cream
8. 12 Sour cream 18. 60 Margarine
9. 14 Cheese 19. 60.2 Butter
10. 15 Cream 20. 70 Butter cream
11. 20 Sour cream 21. 82 Sweet butter
The phantom was scanned with a single-source 64-detector row CT imager (LightSpeed VCT;
GE Healthcare) to examine the correlation between fat fraction and Hunsfield Unit value after dual-energy subtraction. The effects of CT uncertainties were observed and the standard deviation and the mean error of fat quantification were calculated.
„Abdomen-pelvis routine” protocol was selected based on test measurements. The scan mode was axial and the slice thickness was 1.25 mm and the pixel spacing was 0.8184 mm. The following parameters were set for the reconstruction algorithm:
Reconstruction diameter: 419 mm Convolution kernel: standard Filter type: body filter
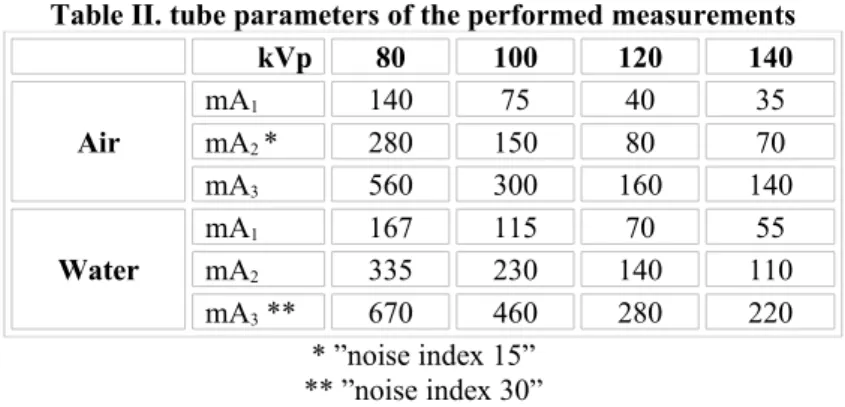
Three different tube current values were used for each tube voltage. For the air phantom, tube current of the built-in „noise index 15” acquisition mode was halved and doubled to obtain different noise levels. By water-filled phantom measurements „noise index 30” acquisition mode was selected as the high dose level and the corresponding mAs values were halved and quartered to produce different amount of quantum noise. Thus, this resulted in 24 measurements for each phantom (three tube current values for four tube voltage levels with and without water). A single measurement comprises 16 slices.
Table II. tube parameters of the performed measurements
kVp 80 100 120 140
Air
mA1 140 75 40 35
mA2 * 280 150 80 70
mA3 560 300 160 140
Water
mA1 167 115 70 55
mA2 335 230 140 110
mA3 ** 670 460 280 220
* ”noise index 15”
** ”noise index 30”
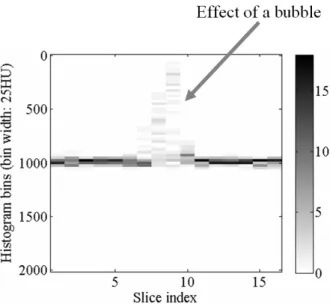
The images were analyzed by means of scripts implemented in Matlab. First, binary mask images were created to localize the sample areas for both low and high X-ray beam energy image sets. The radius of the mask circles was 3.3 pixels instead of the fitted value of 7.37 pixels during data processing to avoid the influence of the sample holders. To localize and pass over the effect of bubbles (see Fig. 3), a simple algorithm was created. The mean of the masked pixels were calculated on each slice. The average of the means was calculated and the slices having the highest difference from the average of the means were not taken into consideration. This was repeated until 8 slices remained. This method made it possible to omit each voxel in which a bubble decreased the CT number.
Fig. 0. The effect of bubbles
These eight bubble-free slices were averaged in all measurements. The mean of the voxels measured in the equivalent eppendorfs was used for further calculations to decrease the effect of noise. The number of averaged voxels depended on the matched mask position, because the center of the matched circles did not coincide with the pixel grid of the image. The number of averaged voxels varied between 256 and 296 per eppendorf. The mean HU values of the samples were used to evaluate the lipid magnitude.
Fat-soft tissue ratio can be estimated on the basis of the following equation using the linear relationship between attenuation and CT numbers:
(
0)
100 0
100 HU( x, y,z ) HU fat( x, y,z )
HU HU
= −
− 1.
where fat and HU are the fat weight % and the CT number of the voxel with x and y coordinates, respectively. HU0 and HU100 are the reference CT values for 0% fat and for 100% fat. Reference valuesCT0 and CT100 can be calibrated previously with phantom measurements, or a reference organ must be selected (for example muscle or spleen for 0% fat and subcutaneous or visceral fat for 100% fat region).15,16
The difference of two linear functions is also linear, thus the difference of HU values between two different energy levels can be used for fat quantification. The reference values for 0% and 100% must be measured in both low- and high-energy images and the shift between low- and high-energy values are defined as dual-energy reference points. Modifying the definition of Eq. (1) for dual-energy, the fat content can be graded as given by
(
0)
100 0
100 HU( x, y,z ) HU fat( x, y,z )
HU HU
∆ − ∆
= ∆ − ∆ 2.
Where ∆HU is the CT number difference between the low- and high-energy images at the voxel with ( x, y,z ) coordinates where the fat ratio is unknown. ∆HU0 and ∆HU100 are HU differences between the low- and high-energy images at 0% and 100% fat reference points.
III. Results
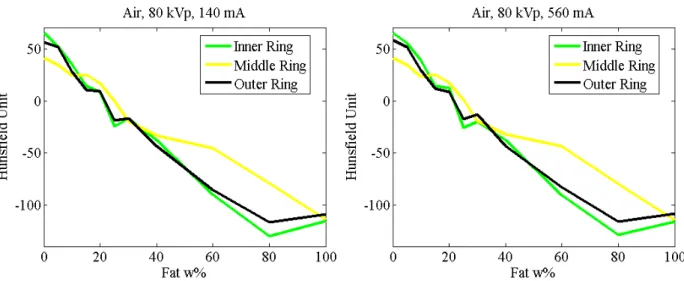
The CT numbers of the fat samples were plotted and similar curve profiles were identified at different tube currents. The measured mean HU values of soft tissue samples (Fig. 4) demonstrated that the main origin of this effect was not the image noise (the curves were similar in spite of the fact that the noise changed). Generally speaking, local inhomogeneities arise in CT images.
Fig. 0. Mean Hounsfield values of soft tissues in air. The same inhomogeneity appeared in different measurements.
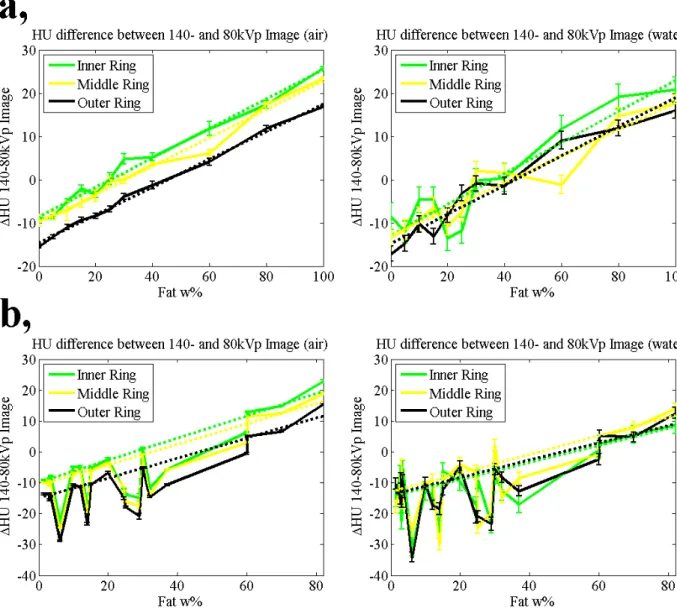
∆HU values with least-square fitted linear curves are shown in Fig.(5). Considering the results, cheese samples were not used for base points for fitting because considerable attenuation difference was observable between cheeses and other dairy and related products.
The source of this effect can be a difference in physical density change due to melting.
Fig. 0. HU differences between 140 and 80kVp images at mA3. Dashed lines are least-square fitted linear curves of tissue samples (a), and dairy product samples (b).
Linear relationship between HU values and fat fraction was observed and the measured slope values were similar. The intercepts are dependent on the ring-isocenter distance. In the water phantom, the quantum noise level was very high and the intensity bias was hardly measurable in the fat samples, thus the water values were used for intensity bias measurement.
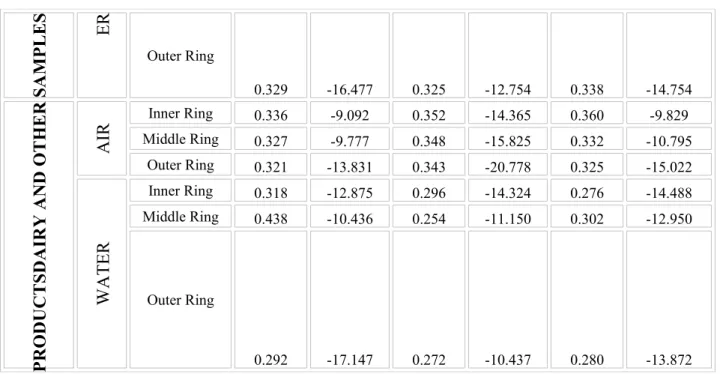
The slope and y-intercept values of fitted linear curves were calculated. The calculated values are listed for each measurement in Table III.
Table III. Parameters of least-square fitted linear curves
Position mA1 mA2 mA3
Slope Intercept Slope Intercept Slope Intercept
TISSUE AIR
Inner Ring 0.321 -8.030 0.336 -10.518 0.341 -8.579
Middle Ring 0.328 -9.797 0.350 -15.112 0.328 -9.966
Outer Ring 0.310 -13.180 0.325 -18.280 0.321 -14.563
WAT Inner Ring 0.341 -13.321 0.402 -13.534 0.357 -12.785
Middle Ring 0.346 -17.819 0.287 -11.222 0.307 -12.948
SAMPLES ER
Outer Ring
0.329 -16.477 0.325 -12.754 0.338 -14.754
DAIRY AND OTHERPRODUCTS AIR
Inner Ring 0.336 -9.092 0.352 -14.365 0.360 -9.829
Middle Ring 0.327 -9.777 0.348 -15.825 0.332 -10.795 Outer Ring 0.321 -13.831 0.343 -20.778 0.325 -15.022
WATER
Inner Ring 0.318 -12.875 0.296 -14.324 0.276 -14.488 Middle Ring 0.438 -10.436 0.254 -11.150 0.302 -12.950
Outer Ring
0.292 -17.147 0.272 -10.437 0.280 -13.872
The radial dependency of ∆HU values were measured in a homogeneous water region of the phantom (b, region in Fig.1). The plotted data of voxels closer than 100 mm to the center showed a descending linear shape. The voxel values decreased to a larger extent closer to the high-density PVC cover (Fig. 6).
Fig. 0. Radial dependency of the difference between mean HU values of water at 140kVp and 80kVp. The intensity bias was calculated between the ring positions.
The y-intercept value of the least-square fit at mA2 differs from the value at mA1 and mA3 for unknown reasons. The measured spatial intensity bias values between the sample ring positions can be used for image correction.
Local inhomogeneity correction
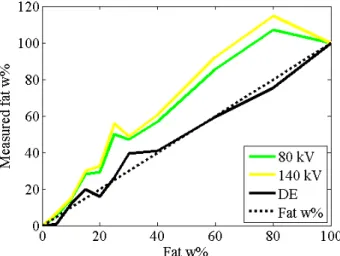
Fat fraction of the phantom was evaluated with Eq. (1) by single-energy measurements and by Eq (2) using dual-energy data (Fig 7). The same ring was used for the reference values (0%
and 100%) and for fat quantification, in this manner there was no isocenter distance
dependent intensity bias between the reference locations and the location of other samples in the ring which were selected for fat quantification.
Fig. 0. Fat contents of phantom samples calculated from image data of 80 kV, 140 kV and the difference between them (DE). The graphs belong to the inner ring of air phantom and the highest tube current pair.
Following the subtraction of dual-energy images, the inhomogeneity considerably decreased.
The image noise level of the water phantom was very high and the local inhomogeneities were hardly measurable on the fat samples, thus the average of numerous water voxel values were used for intensity bias measurement.
Correction of spatial intensity bias
To estimate material content, one can make a lookup table previously by measuring the HU values of samples with different material contents, or must locate two different regions of the object in which the material content is known. These reference points can be used to define the linear scale for material decomposition.
We examined the assumption that intensity bias measurement on the difference between high- and low-energy water images can be used to suppress the image inhomogeneity. The correction factor was defined as the differences of the biases between the intensity reference point and the position of the measured voxels. Considering the effect of intensity bias Eq. 2 can be rewritten as
( )
(
0 0)
100 100 0 0
100 HU( x, y,z ) HU c fat( x, y,z )
HU c HU c
∆ − ∆ +
= ∆ + − ∆ + 3.
where c100 and c0 are the intensity biases between the reference points at the location of the fat measurement and the calibration.
0 0 0
c = ∆HU ( x', y',z')− ∆HU ( x, y,z ) 4.
100 100 100
c = ∆HU ( x', y',z')− ∆HU ( x, y,z ) 5.
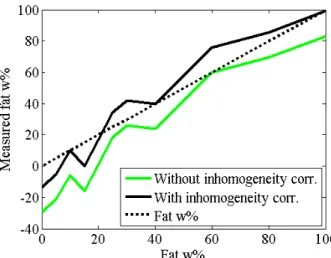
The intensity reference points for 0 and 100% fat were selected in the inner sample ring, and a linear scale between the reference points was used to estimate the fat content of samples in the outer ring. The results of fat quantification with and without inhomogeneity correction were compared (Fig. 8). The correction factor was 4.69 HU, which is the measured difference between the biases of the inner and the outer rings, -7.58 and -12.27HU.
Fig. 0. The effect of inhomogeneity correction. The graph belongs to mA3 tube current pair.
Table V. The results of fat quantification
100% 80% 60% 40% 30% 25% 20% 15% 10% 5% 0%
Without corr.
Measured
fatw% 83,22 69,49 59,78 23,88 25,86 18,34 0,73 -15,71 -6,01 -21,25 -29,34
Error -16,78 -10,51 -0,22 -16,12 -4,14 -6,66 -19,27 -30,71 -16,01 -26,25 -29,34 With
corr.
Measured
fatw% 99,16 85,43 75,73 39,83 41,81 34,29 16,68 0,24 9,94 -5,30 -13,39
Error -0,84 5,43 15,73 -0,17 11,81 9,29 -3,32 -14,76 -0,06 -10,30 -13,39
The mean error of fat quantification without inhomogeneity correction was -16 fat w%, and with correction was -0,05 fat w%. The mean absolute errors were 16 fat w% and 7,74 fat w%
with and without correction, respectively.
Noise consideration
The effect of voxel standard deviation on material decomposition was calculated on dairy product samples to avoid measuring the local inhomogeneity as standard deviation by tissue samples. The highest dose was selected (670 mA for 80 kV and 220 mA for 140 kV) for noise considerations. At 80 kV, the measured noise levels were 35, 39 and 42 HU, at 140 kV, the noise values were 20, 23 and 26 HU at the outer, the middle and the inner ring position, respectively.
The calculated slopes of Table III can be used to convert the standard deviation from the image space [HU] to the material space [fat%].
α σ σ σ
2 2
high low +
= 6.
Where
α
is the slope, σlow and σhigh are the standard deviation of the low- and the high- energy image.The calculated standard deviations of fat weight fraction were 146, 150 and 178 %. The noise can be decreased by spatial averaging, by increasing slice thickness and/or decreasing image resolution. To achieve 5% standard deviation in the result of fat fraction measurement, the averaged volumes must be 0.87, 0.92 and 1.29 ml, ring by ring. These volumes are equal with
853, 901 and 1262 voxels in our arrangement (slice thickness was 1.25 mm and the pixel spacing was 0.8184 mm).
Discussion
In this study, we have experimentally validated the linear relationship between CT numbers and fat content. We realized that the observed image inhomogeneities decrease the efficiency of fat quantification. Image inhomogeneities must be handled to make dual-energy material quantification methods applicable in radiological diagnostics.
Although the result image of dual-energy subtraction has less local inaccuracy, we measured radius-dependent intensity shift. The occurring radial HU shift makes post-reconstruction material decomposition methods inaccurate. We proposed a method to avoid the effect of intensity shift by calculating the HU bias in a water phantom and using the measured information to correct the CT image. We observed tube current dependent intensity bias, as could be seen in Fig. 6, thus the calibration and the measurement must be performed with the same tube current and scan mode.
Experimental phantom data demonstrate the feasibility of the proposed method to perform a more accurate fat quantification.
The effect of image noise on fat quantification was also measured. Although quantum and electronic noise influences the standard deviation of material quantification, it can be suppressed by the reduction of spatial resolution. The standard deviation increases with the depth of the object, thus we suggest increasing kernel for simple averaging or for any spatial noise reduction algorithm. Without noise reduction, the result is not sufficient to quantify fat content with a degree of accuracy, which is probably needed for clinical assessment.
On the basis of the results, we conclude that dual-energy subtraction is a powerful tool that decreases the inaccuracy of CT numbers. Therefore, dual-energy methods lead to an improved material decomposition, compared to single-energy imaging.
Although the study has certain limitations, for example, the CT used in this study was a single energy CT, because no dual-energy system was available, we conclude that the proposed dual-energy subtraction method can be used to define the degree of fatty infiltration by phantom measurements. Further investigation of image inhomogeneity should be performed to analyze the origin of the measured effects and the usefulness of the proposed method in patients in clinical cases.
Acknowledgements
We thank Euromedic Diagnostic Center - Szeged for allowing us to use their CT and to István Horváth and Magor Babos for their help with the phantom measurements. This work was partially supported by GE Healthcare and GOP foundation (GOP-1.1.1-08/1-2008-00-37).
This project is supported by the European Union and co-funded by the European Social Fund under TÁMOP 4.2.2/B-10/1-2010-0012 grant.
References
1. Hamer OW, Aguirre DA, Casola G, et al. Fatty Liver: Imaging Patterns and Pitfalls.
RadioGraphics. 2006;26:1637-1653.
2. Kim SH, Lee JM, Han JK, et al. Hepatic macrosteatosis: predicting appropriateness of liver donation by using MR imaging – correlation with histopathologic findings. Radiology.
2006;240:116-129.
3. McCormack L, Clavien PA. Understanding the meaning of fat in the liver. Liver Transpl.
2005;11:137-139.
4. Cho JY, Suh KS, Kwon CH, et al. The hepatic regeneration power of mild steatotic grafts is not impaired in living-donor liver transplantation. Liver Transpl. 2005;11:210-217.
5. Begriche K, Igoudjil A, Pessayre D, et al. Mitochondrial dysfunction in NASH: causes, consequences and possible means to prevent it. Mitochondrion. 2006;6:1-28.
6. Guiu B, Petit J M, Loffroy R, et al. Quantification of Liver Fat Content: Comparison of Triple-Echo Chemical Shift Gradient-Echo Imaging and in Vivo Proton MR Spectroscopy.
Radiology. 2009;250:95-102.
7. Joe West, Timothy R. Card, Reduced Mortality Rates Following Elective Percutaneous Liver Biopsies. Gastroenterology. 2010;139:1230-1237.
8. Ducommun JC, Goldberg HI, Korobkin M, et al. The relations of liver fat to computed tomography numbers: a preliminary experimental study in rabbits. Radiology. 1979;130:511- 513.
9. Bydder GM, Kree L, Chapman RW, et al. Accuracy of computed tomography in diagnosis of fatty liver. Brit Med J. 1980;281:1042.
10. Mervis B., Kottler R.E. Computed tomography of fatty infiltration of the liver. SA Medical Journal. 1983;64:279-281.
11. Claudio Ricci, Renata Longo, Eugenio Gioulis, et al. Noninvasive in viva quantitative assessment of fat content in human liver. Journal of Hepatology. 1997;27:108-113.
12. Raptopoulos V, Karellas A, Bernstein J, et al. Value of dual-energy CT in differentiating focal fatty infiltration of the liver from low-density masses. AJR. 1991;157:33-35.
13. Michael A. Fischer, Ralph Gnannt, Dimitri Raptis, et al. Quantification of Liver Fat in the Presence of Iron and Iodine. Invest Radiol. 2011;46:351–358.
14. Kelcz F, Joseph P M and Hilal S K, Noise considerations in dual energy CT scanning.
Med Phys. 1979;6:418-425.
15. Piekarski J, Goldberg H I, Royal SA, et al. Difference between liver and spleen CT numbers in the normal adult: its usefulness in predicting the presence of diffuse liver disease.
Radiology; 137, 727-729, 1980
16. Panicek DM, Giess CS, Schwartz LH. Qualitative Assessment of Liver for Fatty Infiltration on Contrast-Enhanced CT: Is Muscle a Better Standard of Reference Than Spleen?
Journal of Computer Assisted Tomography; Vol. 21 Issue 5, 699-705, 1997