Sensing Layer for Ni Detection in Water Created by Immobilization of Bioengineered Flagellar Nanotubes on Gold Surfaces
Zoltan Labadi, Benjamin Kalas, Andras Saftics, Levente Illes, Hajnalka Jankovics, E ́ va Bereczk-Tompa, Anett Sebestyén, E ́ va Tóth, Balázs Kakasi, Carmen Moldovan, Bogdan Firtat, Mariuca Gartner,
Marin Gheorghe, Ferenc Vonderviszt, Miklos Fried, and Peter Petrik*
Cite This:ACS Biomater. Sci. Eng.2020, 6, 3811−3820 Read Online
ACCESS
Metrics & More Article RecommendationsABSTRACT:
The environmental monitoring of Ni is targeted at a threshold limit value of 0.34
μM, as set by the World HealthOrganization. This sensitivity target can usually only be met by time-consuming and expensive laboratory measurements. There is a need for inexpensive,
field-applicable methods, even if they are only used for signaling the necessity of a more accurate laboratory investigation. In this work, bioengineered, protein-based sensing layers were developed for Ni detection in water. Two bacterial Ni- binding
flagellin variants were fabricated using genetic engineering, and their applicability as Ni-sensitive biochip coatings was tested.
Nanotubes of mutant
flagellins were built by
in vitropolymer- ization. A large surface density of the nanotubes on the sensor surface was achieved by covalent immobilization chemistry based
on a dithiobis(succimidyl propionate) cross-linking method. The formation and density of the sensing layer was monitored and veri
fied by spectroscopic ellipsometry and atomic force microscopy. Cyclic voltammetry (CV) measurements revealed a Ni sensitivity below 1
μM. It was also shown that, even after two months of storage, the used sensors can be regenerated and reused byrinsing in a 10 mM solution of ethylenediaminetetraacetic acid at room temperature.
KEYWORDS: flagellin, water contamination, electronic sensing, spectroscopic ellipsometry
1. INTRODUCTION
Toxicity and other environmental e
ffects of heavy metal traces in natural waters have attracted increasing attention and concern in recent years. Heavy metals exist in natural waters in colloidal, particulate, and/or dissolved phases. Their toxic e
ffects are di
fferent, but all of them (e.g., Hg, Cd, Ni, As, Cr, Tl, or Pb) are dangerous, especially due to their potential bioaccumulation.
1−5Heavy metals can enter into a water supply by industrial or consumer waste or due to the acidic rain that breaks down the soil and releases heavy metals into streams, lakes, rivers, and groundwater.
6−9Environmental monitoring generates a steadily growing need for heavy metal ion detection in the concentration range of ppm or below.
Requirements for this analytical task usually can be met by applying methods such as atomic absorption spectrometry (AAS), atomic
fluorescence spectroscopy (AFS), and in- ductively coupled plasma mass spectroscopy (ICP-MS).
10However, these methods need laboratory facilities (expensive hardware and trained sta
ff) and they are time-consuming and costly. There is a well-established need for
field-applicable methods and equipment using disposable sensors.
3E
fforts for constructing and manufacturing portable heavy metal sensors have been increasing in the past years, applying a wide range of concepts, including optical- (e.g., colorimetric,
11 fluorescent,
12,13Raman,
14or plasmon-enhanced
15methods), electrochemical-,
10,16and nanomaterial-based realizations.
14Each method has advantages and disadvantages depending on the requirements and target elements. Many elements have been investigated, including Hg,
17,18Cu,
19Ni,
20Pb,
16and Fe,
21with some approaches being sensitive but requiring complex preparation
17,18,20and with others utilizing robust detection schemes and portability.
22,23In this work, using genetic engineering, our aim was to develop a novel type of heavy-metal-sensing layer, having good regeneration capability, stability, and
flexibility, due to the modi
fication potential of the
Received: February 24, 2020 Accepted: May 21, 2020 Published: May 21, 2020
Article pubs.acs.org/journal/abseba
License, which permits unrestricted use, distribution and reproduction in any medium, provided the author and source are cited.
Downloaded via WIGNER RESEARCH CTR FOR PHYSICS on August 10, 2020 at 06:41:12 (UTC). See https://pubs.acs.org/sharingguidelines for options on how to legitimately share published articles.
surface of the applied protein nanotube according to the target element. By describing this method, a framework is demonstrated in which there are many opportunities for element-optimized detections.
Electrochemical analytical methods are versatile tools for the measurement of heavy metals, due to the fact that most chemical processes related to their compounds involve electron transfer. Among the available electrochemical techniques, cyclic voltammetry (CV) is prominent, with its advantages of simplicity, sensitivity, speed, and low costs, which result in a wide range of applications.
24Since heavy metal contamination must be detected in the ppm range, in order to enhance sensitivity, the application of nanoparticles or other selective binding agents is strongly demanded on the electrode surface.
In this work, we fabricated Ni-sensitive layers from bioengineered bacterial
flagellar
filaments. The
flagellar
filament is a natural protein nanotube, which is formed by self-assembly from thousands of
flagellin (FliC) subunits.25Flagellin is an excellent object for protein engineering. Its terminal regions are highly conserved and required for
filament formation, in contrast to the variable middle portion that forms the D3 domain exposed on the surface of the
filaments. The D3 domain can be modi
fied or replaced by heterologous segments, enabling the introduction of speci
fic functionalities into the host molecule.
26−29These
flagellin variantsreengineered in the D3 region typically retain their polymer- ization ability and can be used to make functionalized protein nanotubes
in vitro. They can be readily produced by bacteriabecause they form
filaments on the cell surface, which can be removed and puri
fied easily.
Previous studies demonstrated that binding proteins, enzymes, or reporter proteins can be inserted into the variable central portion of the
flagellin protein, resulting in a plethora of building blocks applicable for functionalized nanotube formation.
26−29Flagellin-based fusion proteins with catalytic and molecular recognition functionalities can be assembled to form mixed or block copolymers in a rationally designed manner, opening new horizons for applications in medical diagnostics, environmental monitoring, or bionanotechnology.
In this work, we aimed at creating Ni-binding
flagellin variants that are capable of forming nanotubes displaying thousands of regularly arranged binding sites on their surface.
Two approaches were followed. In the
first approach, the D3 domain of
flagellin was engineered to create a metal-binding site by introducing His residues at appropriate positions.
Alternatively, the D3 domain was removed and replaced by an oligopeptide with a known Ni-binding ability. These
flagellin constructs were produced by bacteria, easily obtained from the surface of cells by mechanical treatment and centrifugation, and were further purified through depolymerization/polymer- ization steps. Their metal-binding properties were charac- terized by isothermal titration calorimetry (ITC), and the thermal stability of
flagellar nanotubes built from the mutant
flagellins was also assessed. Filaments with Ni-binding ability were deposited by thiol-based surface chemistry as a thin layer on the working electrode of an electrochemical microsensor specially designed for this purpose. The immobilization of the developed metal-binding
filaments was followed by a recently developed
in situoptical method,
30,31and the prepared
filament layers were also characterized using atomic force microscopy (AFM). To assess the sensitivity, detection limit, reproducibility, and regenerability, the deposited
filament
layers were electrochemically tested in a bu
ffer solution (pH 7.4) by CV.
This paper demonstrates that mutant
flagellar
filaments have the potential to form protein-based Ni-sensing layers on a gold substrate, which can be employed in low-cost portable electrochemical biosensors to ful
fill the requirements for sensing Ni in water at concentrations as low as the World Health Organization (WHO) health threshold limit (max- imum allowable concentration).
2. EXPERIMENTAL SECTION
2.1. Cloning, Expression, and Purification of Mutant Flagellin Variants. For the construction of Ni-binding flagellin mutants, a pKOT-based plasmid containing the gene of a D3-deleted variant offlagellin served as a cloning vector.32Within this plasmid, the D3-domain coding region offlagellin was replaced with a short gene cassette, including the recognition sites of XhoI, AgeI, XmaI, and SacI (EC: 3.1.21.4) restriction enzymes.29,33
The 4H_D3 variant was constructed by the mutation of four amino acids within the D3 domain, residues 190−284 of wilde-type (unmodified) Salmonella typhimurium flagellin, to histidine. The 4H_D3 domain coding sequence containing the mutations L209H− V235H−K241H−S264H, where the numbers correspond to the position of the amino acid in wild-typeflagellin, and bearing the XhoI and SacI restriction enzyme recognition sequences on its 5′and 3′
end, respectively, was synthesized and cloned into a pUC57 plasmid by GenScript (Piscataway, NJ).
Due to the length of the HG12 motif (HGGGHGHGGGHG), complementary coding sequences were designed with the appropriate overhangs generated by the digestion of XhoI and SacI restriction sites, attached to both ends (forward, 5′-TCGAG CAC GGT GGT GGT CAC GGT CAT GGC GGC GGC CAT GGC GAGCT-3′;
reverse, 5′-C GCC ATG GCC GCC GCC ATG ACC GTG ACC ACC ACC GTG C-3′) and hybridized using oligo annealing techniques.
Both fragments (HG12 and 4H_D3) were inserted into the gene of a D3-deleted variant offlagellin between the XhoI and SacI restriction sites using a T4 DNA ligation kit (Thermo Scientific).Escherichia coli TOP10 cells (Invitrogen) were transformed by the resulting plasmid constructs, purified by a plasmid purification kit (Viogene), and checked by digestion and DNA sequencing.
In order to express theflagellin variants,flagellin-deficient SJW2536 strain of Salmonella typhimurium was electroporated by the fusion gene constructs. Purification of the fusion protein variants was carried out as described previously,34 except in order to avoid metal-ion- induced protein aggregation, 3 mM ethylenediaminetetraacetic acid (EDTA) was added to the washing buffer after the first polymer- ization step.
The protein concentration of samples was determined from spectrophotometric measurements at a wavelength of 280 nm using molar extinction coefficients (ε280 = 17880 M−1cm−1 for wild-type flagellin and 4H_FliC andε280= 10430 M−1cm−1 for HG12_FliC), calculated from the known aromatic amino acid contents of the molecules using the ProtParam program.35 The purity of protein samples was checked by SDS-PAGE using 12.5% polyacrylamide gels, stained with Coomassie blue R-250 (Merck).
2.2. Formation of Flagellar Nanotubes.In vitropolymerization of theflagellin constructs was performed by inducing nucleation and polymerization by ammonium sulfate (AS).32The protein solutions of 2−3 mg/mL were prepared in phosphate-buffered saline (PBS), and 4 M AS was added to achieve a final concentration of 0.6 M. The filament formation was judged after at least 3 h or after overnight incubation at room temperature (RT). Thefilaments were observed by dark-field microscopy with an Olympus BX50 microscope. The size distribution of reconstructedfilaments was checked by dynamic light scattering (DLS) using a Zetasizer Nano-ZS (Malvern) instrument.
2.3. Preparation of Sensor Structures.2.3.1. Microfabrication of Sensor Chips. Si wafer-integrated sensor chips were used for
testing the Ni-binding flagellar filaments. The electrochemical transducer was designed with three electrodes (Ag/Ti−reference electrode, Au/Ti−working electrode, and Pt/Ti−auxiliary electrode), as shown inFigure 1. A 4-channel potentiostat was prepared in which
the analyzing solutions were placed independently. The electro- chemical sensors detected the targeted species (contaminants), whereas one of the sensors was used as a reference.
2.3.2. Preparation of the Sensitive Flagellar Nanotube Layer.
The covalent immobilization offlagellar nanotubes on gold electrodes was carried out using thiol-based surface chemistry.36The clean chips were dipped into a dithiobis(succimidyl propionate) (DSP, Sigma- Aldrich) cross-linking agent solution prepared in dimethyl sulfoxide (DMSO from VWR), and they were incubated on a rocking shaker at RT. DSP-activated surfaces were rinsed twice with DMSO, soaked in DMSO for 2 min between rinsing sequences, and then rinsed with deionized (DI) water. In the next step, the chips were dipped into a 0.5 mg/mL solution offlagellar nanotubes prepared in PBS, followed by 3 h of incubation on a rocking shaker at RT; the nonadsorbed filaments were removed by 3×15 min sequential washings in PBS.
The preparedfilament-coated chips were stored in PBS in closed vials at 4°C.
Both the concentration (0.04−10 mg/mL) of the DSP solution and the incubation time (5−90 min) were varied to find appropriate conditions for efficient nanotube deposition. The quality of the surface coverage was judged by AFM. On the basis of these experiments, chips for CV measurements were prepared by applying a 10 mg/mL DSP concentration with a 90 min incubation time.
2.4. ITC Studies.The experiments were carried out with a VP- ITC titration calorimeter (Malvern). The measurements were performed in 10 mM 4-(2-hydroxyethyl)-1-piperazineethanesulfonic acid (HEPES) solution containing 150 mM NaCl (pH 7.0) at 25°C.
The protein samples were extensively dialyzed against the buffer at 4
°C. All solutions were thoroughly degassed before use by stirring under vacuum. The Ni-bindingflagellin variants were loaded into the calorimetric cell, and 10 μL portions of the concentrated NiSO4
solution were injected. To measure the heats of dilution, two blank titrations were performed: one with the injection of NiSO4solution into the buffer and another with the injection of buffer into the flagellin solution. The averaged heats of dilution were subtracted from the main experiment. The calorimetric data were analyzed using MicroCal Origin software,fitting them to a single binding site model.
2.5. Circular Dichroism Measurements. The temperature- induced unfolding of flagellar nanotubes was monitored by far-UV circular dichroism (CD) in a rectangular quartz cell with a path length of 0.1 cm at 222 nm in 10 mM PBS (pH 7.4) over the temperature range of 20−70°C with a heating rate of 60 °C/h. Measurements were performed with a Jasco J-1100 spectropolarimeter equipped with a Peltier thermostated cell holder.
2.6. Plasmon-Enhanced Ellipsometry Measurements. In order to verify the effect of DSP coating on the formation of a dense flagellar nanotube layer on the gold surface, in situ spectroscopic ellipsometry (SE) measurements were carried out. SE is an optical method with outstanding sensitivity to the thickness and dielectric properties of thin layer structures.37 By utilizing its high sensitivity, SE has been long used as an excellent tool for following biorelated processes.38−40
In this study, a Woollam M2000 rotating compensator spectro- scopic ellipsometer was used with a homemade Kretschmann−
Raetherflow cell (Figure 2) for internal reflection surface plasmon- enhanced ellipsometry (SPR-SE)30,31that utilizes the surface plasmon resonance (SPR) effect.41SPR is one of the most sensitive optical methods in thefield of biorelated research, and its combination with SE15 provides further advantages, such as the possibility of constructing a complex optical model and utilizing the phase information.
The substrate was a glass (BK7) hemicylinder that enabled focusing without the distortion of the measured ellipsometric angles.
A glass plate covered by a 40 nm gold layer was attached to the bottom of the hemicylinder, with the gold layer facing the liquid. The surface of the gold layer was carefully cleaned using a UV/ozone cleaner (Microvacuum Ltd., Hungary), followed by rinsing with DI water andflowing nitrogen gas. Subsequently, half of the slide was immersed into a DSP solution for 90 min, while the other half stayed intact (reference channel). This sample preparation method made the Figure 1.Sensor chip and electrochemical setting with three metal
electrodes on a Si substrate. Note that the three electrodes of the conventional arrangement are integrated on a silicon chip using planar semiconductor technology.
Figure 2.(A) Rendered visualization of the ellipsometric Kretschmann−Raether configuration for the internal reflectionin situmeasurements. (B) Location of the cell on the mapping stage of a commercial ellipsometer. The inset in the bottom right shows the structure, layers, and materials in the cell.“BK7”is the glass hemisphere on the top, which can also be seen on the photograph.
investigation of the impact of DSP on thefilament layer formation significantly more reliable, since the measuring and reference channels were located on the same substrate (only one sample was required for two measurements); thus, the quality of the surface or any unintended temperaturefluctuations in the flow cell were compensated by the reference channel and had no effect on the result.
For thein situSPR-SE measurement, a focused light beam was used with a spot size of 0.9 mm×0.3 mm. The location of the spot was repeatedly changed between the two points, with one corresponding to a position covered with the DSP layer. This method is called two- channel spectroscopic ellipsometry (here, “channel” refers to the measurement channels).30The SPR-SE measurement was carried out in a wide wavelength range of 400−1690 nm and at the optimal angle of incidence that had been carefully chosen prior to the adsorption process. The angle of incidence was held constant during the measurement.
The baseline of the measurement was provided by a 10 mM PBS solution that was delivered to the surface for 10 min by the help of a peristaltic pump. Subsequently, aflagellarfilament solution of 0.5 mg/
mL was circulated for 120 min, which corresponds to the incubation time of the chips made for the voltammetric measurements.
For the data evaluation, a complex optical model was constructed, since an SE measurement usually only provides the amplitude and phase differences of the p- and s-polarized lights, referred to asΨand Δ, respectively. The optical model consists of all dielectric functions and thicknesses of the layers in the structure, including different corrections as well, such as those that correct the effect caused by the focusing lenses or by the inner stress of the BK7 glass prism. The optical properties of the PBS solution were provided by the Sellmeier equation:
n A
B E
S( ) S
2 2
S S 2
1/2
λ ε λ
λ λ
= +
− −
∞
i
kjjjjj y
{zzzzz (1)
whereλandnS(λ) are the illumination wavelength and the refractive index spectrum of PBS, respectively. Additionally,ε∞,AS,BS, andES denote the index offset, the amplitude, the center energy, and the position of a pole in the infrared region, respectively. Thefilament layer is described by using the Cauchy equation of
n A B C
C( ) C
C2 2
C4
λ 4
λ λ
= + +
(2) with initial parameters ofAC= 1.45,BC= 0.01, andCC= 0.00. The parameter AC was fitted during the data evaluation, and only the thickness of the layer wasfixed at 40 nm. The amount of adsorbed molecules was then calculated by de Feijter’s equation,42 which provides the mass density of the adsorbed molecules:
d n n
n c
( )
d /d
a a,C S
Γ = −
(3) wheredais the thickness of the adsorbed protein layer andna,CandnS are the refractive indices of the adsorbed protein layer and the ambient solution at a wavelength of 632.8 nm, respectively.
Additionally, dn/dcis the refractive index increment of the protein for which a value of 0.18 mL/g was used.42
2.7. AFM Measurements. The AFM measurements were performed with a SmartSPM 1000 instrument manufactured by AIST-NT (Novato, US). The instrument was used in the tapping mode, scanning an area of 5μm by 5μm. The AFM images were processed using data leveling, background subtraction, and false color mapping with Gwyddion software.43
2.8. CV Measurements.The CV characterization was made using a Gamry Instruments ESA410 electrochemical signal analyzer. The measurements were performed in a pH 7.0 HEPES solution using the basic three electrode arrangement (working + Pt counter + saturated calomel reference electrodes). Si-based sensor chips were used as working electrodes. The typical measurement range was−0.6 V to 0.6 V. The conductivity of the buffer solution was enhanced by adding 100 mM NaCl. After testing the CV characteristics in the Ni-free
solution, variable amounts of a NiSO4solution were added into the measurement cell in order to study the effect of the Ni(II) concentration on the CV curves.
2.9. Sample Regeneration and Storage.In order to examine the stability and potential reuse of the sensing structure, the following sequence was applied: (i) After acquiring the CV curve in the 5μM Ni2+-containing solution, theflagellin-covered chips were rinsed in DI water and were stored at 4°C under PBS solution. (ii) After 2 months of storage, the chips were rinsedfirst in a 10 mM EDTA solution and then in DI water. (iii) The CV measurement procedure was repeated on the samples using 0, 1, 2, and 5 μM Ni2+ solutions in HEPES buffer.
3. RESULTS AND DISCUSSION
3.1. Development of Ni/Metal-Binding Flagellin Variants.
We aimed at developing
flagellin variants possessing Ni-binding ability for biosensing applications. Natural Ni- binding proteins typically contain several properly positioned His residues to coordinate the binding of metal ions.
44,45We aimed at creating a Ni-binding site within the D3 domain using molecular modeling and genetic engineering techniques. On the basis of the known atomic structure of
Salmonellaflagellin (PDB: 1UCU), computer modeling with Chimera
46helped us to identify amino acid residues L209, V235, K241, and S264, which were near to each other in an appropriate spatial arrangement and orientation to promote the creation of a Ni- binding site by replacing their original side chains for the imidazole side chain of histidine (Figure 3A). The gene segment coding for this mutant D3 domain (4H_D3) was synthesized by GenScript and was ligated into a pKOT-based plasmid containing the gene of a D3-deleted
flagellin.
In addition to engineering D3 to furnish it with Ni-binding ability, we tried another approach in which the whole D3 domain was replaced with an oligopeptide segment of known Ni-binding a
ffinity (Figure 3B). The histidine-rich HG12 dodecapeptide (HGGGHGHGGGHG) was reported to bind copper and nickel with a high a
ffinity.
47The DNA segment coding for the HG12 oligopeptide was synthesized (IDT), annealed, and ligated into the pKOT-based plasmid containing the D3-deleted mutant FliC gene between XhoI and SacI restriction sites.
When the 4H_FliC and HG12_FliC plasmid constructs
were introduced into the
flagellin-de
ficient nonmotile
SJW2536
Salmonellastrain, they were expressed at a high
Figure 3. Construction of Ni-binding flagellin variants. (A) The hypervariable D3 domain ofSalmonellaflagellin was replaced by the HG12 (HGGGHGHGGGHG) Ni-binding motif. (B) The Cα backbone trace of the D3 domain of flagellin (PDB code: 1UCU) is displayed, showing the residues mutated for histidine. Molecular modeling was performed with Chimera.46level. The restored swimming ability of the host bacteria (veri
fied by dark-
field microscopy) suggested that the fusion proteins preserved their
filament-forming ability.
For both HG12_FliC and 4H_FliC variants, the amounts of subunits built into
filaments
in vivowere studied by gel electrophoresis. The mutant cells were collected by centrifu- gation, suspended in 20 mM Tris bu
ffer (pH 7.8) containing 150 mM NaCl, and heated to 70
°C to disassemble
flagellar
filaments, and the depolymerized fractions were analyzed by SDS-PAGE. We observed strong bands at the expected positions for the depolymerized HG12_FliC and 4H_FliC (not shown), but a comparison of their band intensities to the secreted fractions suggested that a signi
ficant amount of the
flagellin-based fusion proteins was transported into the culture medium in a monomeric form. Transmission electron microscopy studies demonstrated that HG12_FliC
filaments preferentially exhibited a straight polymorphic form and were 4
−6
μm long, while 4H_FliC
filaments had a normal helical waveform and were typically 5
−8
μm long (Figure 4).
3.2. Characterization of Metal/Ni-Binding Properties of the Flagellin Variants.
The Ni-binding properties of the 4H_FliC and HG12_FliC constructs in their monomeric state were characterized and compared by ITC measurements.
Experiments were done were done in HEPES bu
ffer because this bu
ffer does not form complexes with Ni ions; therefore, it is ideal for Ni-binding studies. The Ni-binding
flagellin variants were loaded into the calorimetric cell, and 10 or 20
μL portions of concentrated NiSO
4were injected. The measured data were analyzed by a one-binding-site model. As shown in
Figure 5, both variants bound Ni with a high affinity. In control experiments, nickel binding to wild-type
flagellin was also investigated, but no interaction was observed. The measured data could be
fitted well with the applied model, with the binding parameters summarized in
Table 1. The stoichiometryof the interaction was typically lower than 1, indicating a slight aggregation of the samples or indicating uncertainties in sample concentrations. While HG12_FliC bound Ni
2+with a dissociation constant of 15.3
μM, the 4H_FliC variant exhibited a signi
ficantly higher binding a
ffinity, characterized by a
Kdof 1.4
μM. The values obtained for
ΔHand
ΔSare apparent and include contributions not only from Ni
2+binding but also from associated events such as the deprotonation of the histidines and the consequent change in the bu
ffer ionization state. Nevertheless, HG12_FliC showed a substan- tially smaller heat e
ffect and entropy change than 4H_FliC.
Preliminary experiments were also performed to check the binding a
ffinity of the variants for other heavy metals like
Co(II), Cd(II), and Cu(II). Both the 4H_FliC and HG12_FliC variants interacted strongly with Cu
2+, with a dissociation constant in the submicromolar range. 4H_FliC exhibited an interaction with Co
2+and Cd
2+, with a 2
−3 order of magnitude weaker
Kd. HG12_FliC did not show a signi
ficant interaction with Co
2+, while it bound Cd
2+with a 0.3 mM dissociation constant.
In summary, our results demonstrate that 4H_FliC shows a signi
ficantly higher a
ffinity for Ni
2+than HG12_FliC. In subsequent experiments, 4H_FliC was used to fabricate capture layers for nickel detection.
3.3.In VitroNanotube Formation.
To check the
in vitropolymerization ability of the puri
fied 4H_FliC fusion protein,
filament formation was induced by ammonium sulfate (AS) precipitation. 4H_FliC readily polymerized into
flagellar nanotubes upon the addition of 4 M AS to achieve a 0.6 M
final concentration. The average length of reconstructed filaments was about 3
−500 nm, as judged by DLS experiments.
Filaments were stable in PBS (pH 7.4) after the removal of the AS precipitant. The structural stability of reconstructed
filaments was investigated via CD spectroscopy by monitoring their temperature-induced disassembly process (Figure 6).
4H_FliC
filaments exhibited a similar thermal stability to
filaments formed from wild-type flagellin, indicating that thisvariant fully preserved its
filament-forming ability. The depolymerization and unfolding of subunits occurred around 49.4
°C, as shown by the loss of the
α-helical CD signal followed at 222 nm.
Reconstituted
flagellar
filaments are known to be highly resistant against proteolytic degradation and can be stored at RT for a long period of time. Filaments built from 4H_FliC subunits were used to create sensing layers of biochips for voltammetric measurements.
3.4. Flagellar Nanotube Deposition on Gold Electro- des.
To fabricate capture layers, 4H_FliC
filaments were cross-linked by DSP to the surface of gold electrodes. There are several methods suitable for immobilizing
flagellar nanotubes on various types of surfaces.
48,49We chose DSP- based covalent surface chemistry for use as a simple but e
ffective method for producing stable surface-
filament attach- ments that can potentially sustain complex media when the sensor is applied in future measurements. The
filament layers were characterized using SPR-SE and AFM techniques. The e
ffect of the applied DSP concentration and incubation time was investigated to
find appropriate conditions for the efficientnanotube deposition. Some representative AFM images are shown in
Figure 7. Our experiments revealed that applying aDSP solution at a concentration higher than 4 mg/mL for at least 30 min results in a su
fficiently covered surface layer (Figure 7C). According to
Figure 7A, the surface density of filaments was signi
ficantly lower in the case of noncovalent adsorption, even compared to the lower-concentration DSP experiment shown in
Figure 7B.The
filament layer formation was monitored in real-time by
in situSPR-SE techniques, and the obtained data were evaluated using the analysis method described in
section 2.6.In
Figure 8, the refractive index change is shown for awavelength of 633 nm as a function of time, induced by the formed
filament layer. Our observations are in good agreementwith the AFM results and we can conclude that the e
ffect of DSP functionalization is clearly signi
ficant. The amount of adsorbed molecules is more than double on the functionalized surface than that on the bare gold site (391 and 184 ng/cm
2,
Figure 4.Bright-field TEM images ofSalmonellacells that possess themutant flagellar filaments composed of (A) 4H_FliC and (B) HG12_FliC subunits. Samples were stained with 2% phosphotung- state to enhance the image contrast. The scale bar represents 1μm.
respectively). Note that the adsorptions plotted in
Figure 8were performed in the same process simultaneously by moving the focused spot of the ellipsometer back and forth between the functionalized and nonfunctionalized surfaces. This result demonstrates that the DSP functionalization step has a vital role in the preparation of a dense sensing layer required for detecting Ni molecules in water at low concentrations.
3.5. Electronic Measurements Using Flagellar Nano- tube Sensing Layers for Ni Detection.
The nickel- detecting capability of the CV limit of detection setting was
Figure 5.Demonstration of the Ni-binding ability of (A) 4H_FliC and (B) HG12_FliCflagellin variants by ITC. 38.3μM 4H_FliC and 49.0μM HG12_FliC protein samples were loaded into the cell, and NiSO4 solution in 0.23 mM and 0.75 mM concentration, respectively, was injected.Protein samples were loaded into the cell, and the NiSO4solution was injected in 10 or 20μL portions. Changes in the binding enthalpy (■) of the injections are shown as a function of the protein-to-ligand molar ratio. The solid line is the least-squaresfit to the measured data by using a one- binding-site model. Thermodynamic parameters derived from the modelfitting are listed inTable 1. Titrations were done in 10 mM HEPES and a 150 mM NaCl (pH 7.0) buffer at 25°C.
Table 1. Thermodynamic Parameters Characteristic for Ni- Binding of 4H_FliC and HG12_FliC Flagellin Variants Obtained by ITC
thermodynamic parametersa 4H_FliC HG12_FliC
N 0.68 0.83
Kd(μM) 1.4 15.3
ΔH(kcal/M) −52.0 −8.1
ΔS(cal/M/deg) −147 −5.3
aN, stoichiometry;Kd, dissociation constant;ΔH, binding enthalpy;
ΔS, binding entropy
Figure 6.Stability offilament samples against thermal denaturation and depolymerization, as monitored by far-UV CD spectroscopy at 222 nm.
Melting profiles of the nativefilaments (blue) and 4H_FliCfilaments (green) are shown for comparison. The inset shows derivatives of the melting profiles. Measurements were done in a PBS (pH 7.4) buffer with a 1°C/min heating rate.
tested by the measurement of bu
ffer solutions containing NiSO
4at di
fferent concentrations. As a negative control, a golden electrode covered by
“wild-type
” flagellar nanotubes (i.e., without Ni-binding sites) was used in the 0
−5
μM Ni
2+range. The set of measurements in
Figure 9A clearlydemonstrates that the addition of the metal ion has a small e
ffect on the CV curves.
Figure 9B shows CV curves taken on a freshly prepared
sensor covered by
flagellar
filaments built from 4H_FliC
flagellin. By comparison of the curve obtained from the measurement of the Ni-free solution to other curves belonging to concentrations of 1, 2, 5, 20, 50, and 100
μM Ni
2+, it is clearly visible that a cathodic peak appears in the potential range around
−250 mV, and the peak intensity monotonously increases with the Ni
2+concentration, up to saturation. This set of peaks can be associated with the binding and subsequent cathodic reduction of Ni
2+from the solution. A comparison of
Figure 9A and9B proves that the effect is due to the presence
Figure 7.AFM images demonstrating the effect of the DSP concentration and incubation time on the amount of deposited 4H_FliCfilaments. (A) Noncovalent adsorption without DSP. (B) Covalent immobilization using 4 mg/mL DSP for 5 min or (C) 30 min. Flagellar nanotubes were applied at a concentration of 0.5 mg/mL in a PBS buffer.
Figure 8.Increase of the refractive index (at a wavelength of 633 nm) in the layer modeling thefilaments at the interface during adsorption to gold surface with (red line) and without (black line) a DSP layer for covalent bonding. The change of the refractive index corresponds to surface densities of 391 and 184 ng/cm2for DSP-covered and bare surfaces, respectively. The inset shows the layer structure used by ellipsometry in the Kretschmann configuration. The light enters the system from the BK7 glass hemisphere shown at the top of the stack.
The CrO2 layer improves the adhesion of the Au layer.“EMA/Au- PBS”denotes the interface layer between thefilaments (FF) and the plasmonic Au layer, modeled as an effective medium of Au and PBS.
The dispersions of thefilament layer (“FF(Cauchy)″) and the PBS (“PBS(Sellmeier)″) were described by the Cauchy and the Sellmeier dispersion models, respectively.
Figure 9.Set of CV curves measured in the presence of Ni(II) on (A) wild-type flagellar nanotubes ([Ni2+] = 0−5 μM), (B) Ni-binding flagellar nanotubes ([Ni2+] = 0−100 μM), and (C) Ni-binding nanotubes after storage and regeneration ([Ni2+] = 0−100μM). The numbers in the legends show concentrations inμM.
of the Ni-binding site created within the 4H_FliC
flagellin.
Moreover, a signi
ficant and reproducible change of the CV profile for the 1
μM Ni2+solution is in good agreement with the micromolar dissociation constant measured for the 4H_FliC
−Ni
2+interaction by ITC (section 3.2).
The experimentally found lower limit of detection is in good agreement with the WHO threshold limit value for drinking water. This can be considered advantageous since this allows to preselect subsets of samples taken from natural waters. Only these selected ones need to be sent for further expensive and time-consuming analysis.
As noted in
section 3.2, the applied flagellin variant, 4H_FliC, also has a strong binding a
ffinity for Cu
2+, while it shows a very weak interaction with Co
2+and Cd
2+. These results suggest that the developed sensing layer may be applicable for the detection of both copper and nickel contamination. Further studies are needed to characterize in detail the selectivity of the 4H_FliC
flagellin-based sensing layer for heavy metal monitoring in the relevant concentration range speci
fied by the health threshold limit value set by the WHO.
In order to determine the stability and reproducibility of the nickel detection ability of the 4H_FliC
filament-functionalized electrodes, the CV measurements were repeated on the samples. The storage time between the measurements was two months, during which the chips were stored at 4
°C in PBS bu
ffer. Prior to the second measurement, the chips were regenerated (i.e., they were rinsed in a 10 mM EDTA solution and thoroughly rinsed in DI water). EDTA treatment was intended to completely remove possible Ni contamination on the chips accumulated throughout the
first set of measure- ments.
Figure 9C displays the CV curves measured after storage and
regeneration. The measurements clearly demonstrate that the cathodic peak in the potential range at around
−250 mV is still apparent and increasing with the applied Ni
2+concentration.
The saturation tendency also remains observable despite the fact that the Ni-binding sites of the
filament layers were previously saturated during the
first test. Therefore, this set of experiments con
firms that the
flagellin layers (i) can be regenerated by rinsing the functionalized electrode in a 10 mM EDTA solution at RT, (ii) can retain their Ni
2+-binding ability for at least 2 months at 4
°C, and (iii) can be reused as Ni- monitoring sensor layers in the 0
−100
μM Ni
2+concentration range.
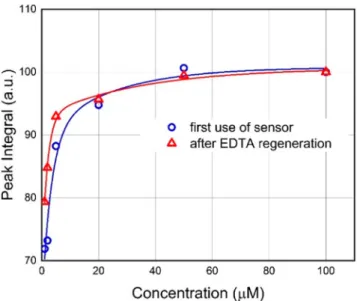
The evaluation of measurements taken on fresh and regenerated samples using the 4H_FliC
filament-covered electrode is presented in
Figure 10. A linear baseline wasdetermined in the potential range of
−150 to
−350 mV by linear interpolation of the currents measured at
−150 and
−
350 mV for every single CV curve, and the peak area under this baseline was calculated. Peak areas were expressed in terms of the percentage of the value of the peak belonging to 100
μM and were plotted against the Ni
2+concentration (Figure 10).
Fitted exponential trendlines show that increasing the Ni
2+concentration resulted in the saturation of the curves at around 50
μM, both in the case of fresh and regenerated chips. This saturation provides further proof of the protein-based mechanism of the sensing process, since the
filament layerhas a limited number of binding sites. The presence of the concentration-sensitive range (0
−50
μM) suggests that this method has the potential to not only detect Ni
2+in natural waters but, at the same time, determine its concentration in a
broader range around the maximum allowable concentration.
A comparison of the
fitted trendlines for the fresh and regenerated samples (red and blue lines in
Figure 10,respectively) shows that the di
fference between the two curves does not exceed 10% of their actual values at any point within the relevant concentration range.
4. CONCLUSIONS
In this study, we developed a Ni-sensitive biosensor coating made of protein-engineered
flagellar nanotubes. Utilizing thepolymerization ability of
flagellin variants, we have provided a method for the inexpensive and rapid production of large amounts of protein. The
flagellar nanotubes were built from mutant
flagellins by in vitropolymerization, and their applicability to form a stable sensing layer for Ni detection was demonstrated by CV measurements. The chips were covered with
filaments using a covalent immobilization process that applied thiol-based surface chemistry. The sensing capabilities were tested in a bu
ffer solution (pH 7.0) by CV measurements, showing that the sensitivity allows the detection of Ni
2+ions at concentrations as low as 1
μM, which is close to the WHO health threshold limit value of 20
μg/L (0.34
μM) speci
fied for water contamination. On the basis of the CV results obtained after EDTA treatment, we proved that the developed platform has distinguished regeneration properties without showing any detectable loss in its Ni-sensing ability.
■
AUTHOR INFORMATION Corresponding AuthorPeter Petrik−
Institute of Technical Physics and Materials Science, Centre for Energy Research, Budapest 1121, Hungary;
orcid.org/0000-0002-5374-6952; Email:petrik@
mfa.kfki.hu Authors
Zoltan Labadi−
Institute of Technical Physics and Materials Science, Centre for Energy Research, Budapest 1121, Hungary
Figure 10.Peak integral (area) values forfirst-use (blue circles) and after-regeneration (red triangles) samples, calculated using the method described in the text, as a function of the Ni2+concentration.The solid lines show exponentialfits to the measured data points.
Benjamin Kalas−
Institute of Technical Physics and Materials Science, Centre for Energy Research, Budapest 1121, Hungary
Andras Saftics−Institute of Technical Physics and Materials
Science, Centre for Energy Research, Budapest 1121, Hungary
Levente Illes−Institute of Technical Physics and Materials
Science, Centre for Energy Research, Budapest 1121, Hungary
Hajnalka Jankovics−Research Institute of Biomolecular and
Chemical Engineering, University of Pannonia, Veszprém 8200, Hungary
Éva Bereczk-Tompa−
Research Institute of Biomolecular and Chemical Engineering, University of Pannonia, Veszpre
́m 8200, Hungary
Anett Sebestyeń −
Research Institute of Biomolecular and Chemical Engineering, University of Pannonia, Veszprém 8200, Hungary
Éva Tóth−
Research Institute of Biomolecular and Chemical Engineering, University of Pannonia, Veszpre m 8200, Hungary
́ Balázs Kakasi−Research Institute of Biomolecular and
Chemical Engineering, University of Pannonia, Veszpre
́m 8200, Hungary
Carmen Moldovan−
National Institute for Research
&Development in Microtechnologies, Bucharest 077190, Romania
Bogdan Firtat−National Institute for Research
&Development
in Microtechnologies, Bucharest 077190, Romania
Mariuca Gartner− “Ilie Murgulescu
”Institute of Physical
Chemistry of the Romanian Academy, Bucharest 060021, Romania
Marin Gheorghe−
NANOM MEMS SRL, Râs
̧nov 505400, Romania
Ferenc Vonderviszt−
Institute of Technical Physics and Materials Science, Centre for Energy Research, Budapest 1121, Hungary; Research Institute of Biomolecular and Chemical Engineering, University of Pannonia, Veszpre m 8200, Hungary
́ Miklos Fried−Institute of Technical Physics and Materials
Science, Centre for Energy Research, Budapest 1121, Hungary;
Institute of Microelectronics and Technology, O
́buda University, Budapest 1034, Hungary
Complete contact information is available at:
https://pubs.acs.org/10.1021/acsbiomaterials.0c00280
Notes
The authors declare no competing
financial interest.
■
ACKNOWLEDGMENTSThe
financial support of projects include support from OTKA Grants NN117847, NN117849, and K131515 and support from the EU (ERDF) and Romanian governments, allowing for the acquisition of the research infrastructure under POS- CCE O 2.2.1 Project INFRANANOCHEM, Nr. 19/
01.03.2009. This
financial support is gratefully acknowledged.
This work was also supported by the BIONANO_GINOP- 2.3.2-15-2016-00017 Project. P.P. and M.G. thank the Hungarian and Romanian academies for support from the Bilateral Project Nr. NKM-2018-29. TEM studies were performed at the electron microscopy laboratory (Nanolab) of the University of Pannonia, established using grant no.
GINOP-2.3.3-15-2016-0009 from the European Structural and Investments Funds and the Hungarian Government.
■
(1) Leland, H. V.; Luoma, S. N.; Fielden, J. M. Bioaccumulation andREFERENCES Toxicity of Heavy Metals and Related Trace Elements.J. Water Pollut.Control Fed.1979,51(6), 1592−1616.
(2) Tchounwou, P. B.; Yedjou, C. G.; Patlolla, A. K.; Sutton, D. J.
Molecular, Clinical and Environmental Toxicology, Volume 3: Environ- mental Toxicology; Experientia Supplementum, Vol. 101; Springer Basel: Basel, Switzerland, 2012.
(3) Ali, H.; Khan, E.; Ilahi, I. Environmental Chemistry and Ecotoxicology of Hazardous Heavy Metals: Environmental Persis- tence, Toxicity, and Bioaccumulation.J. Chem.2019,2019, 6730305.
(4) Nagajyoti, P. C.; Lee, K. D.; Sreekanth, T. V. M. Heavy Metals, Occurrence and Toxicity for Plants: A Review.Environ. Chem. Lett.
2010,8(3), 199−216.
(5) Usman, K.; Al-Ghouti, M. A.; Abu-Dieyeh, M. H. The Assessment of Cadmium, Chromium, Copper, and Nickel Tolerance and Bioaccumulation by Shrub Plant Tetraena Qataranse.Sci. Rep.
2019,9(1), 1−11.
(6) Kim, A. Y.; Kim, J. Y.; Ko, M. S.; Kim, K. W. Acid Rain Impact on Phytoavailability of Heavy Metals in Soils.Geosyst. Eng.2010,13 (4), 133−138.
(7) Liao, B. H.; Liu, H. Y.; Zeng, Q. R.; Yu, P. Z.; Probst, A.; Probst, J. L. Complex Toxic Effects of Cd2+, Zn2+, and Acid Rain on Growth of Kidney Bean (Phaseolus Vulgaris L).Environ. Int. 2005,31 (6), 891−895.
(8) Pennanen, T.; Perkiömäki, J.; Kiikkilä, O.; Vanhala, P.;
Neuvonen, S.; Fritze, H. Prolonged, Simulated Acid Rain and Heavy Metal Deposition: Separated and Combined Effects on Forest Soil Microbial Community Structure.FEMS Microbiol. Ecol.1998,27 (3), 291−300.
(9) Wang, C.; Li, W.; Yang, Z.; Chen, Y.; Shao, W.; Ji, J. An Invisible Soil Acidification: Critical Role of Soil Carbonate and Its Impact on Heavy Metal Bioavailability.Sci. Rep.2015,5, 1−9.
(10) Gumpu, M. B.; Sethuraman, S.; Krishnan, U. M.; Rayappan, J.
B. B. A Review on Detection of Heavy Metal Ions in Water - An Electrochemical Approach.Sens. Actuators, B2015,213, 515−533.
(11) Ho, H.-A.; Boissinot, M.; Bergeron, M. G.; Corbeil, G.; Doré, K.; Boudreau, D.; Leclerc, M. Colorimetric and Fluorometric Detection of Nucleic Acids Using Cationic Polythiophene Derivatives.
Angew. Chem., Int. Ed.2002,41(9), 1548−1551.
(12) Zhang, L.; Wang, E. Metal Nanoclusters: New Fluorescent Probes for Sensors and Bioimaging.Nano Today2014,9(1), 132−
157.
(13) Liebermann, T.; Knoll, W. Surface-Plasmon Field-Enhanced Fluorescence Spectroscopy.Colloids Surf., A2000,171(1−3), 115−
130.
(14) Li, M.; Gou, H.; Al-Ogaidi, I.; Wu, N. Nanostructured Sensors for Detection of Heavy Metals: A Review.ACS Sustainable Chem. Eng.
2013,1(7), 713−723.
(15) Kalas, B.; Agocs, E.; Romanenko, A.; Petrik, P. In Situ Characterization of Biomaterials at Solid-Liquid Interfaces Using Ellipsometry in the UV-Visible-NIR Wavelength Range.Phys. Status Solidi Appl. Mater. Sci.2019,216(13), 1800762.
(16) Cui, L.; Wu, J.; Ju, H. Electrochemical Sensing of Heavy Metal Ions with Inorganic, Organic and Bio-Materials. Biosensors and Bioelectronics; Elsevier Ltd., 2015; pp 276−286.
(17) Shi, L.; Chu, Z.; Liu, Y.; Jin, W.; Chen, X. An Ultrasensitive Electrochemical Sensing Platform for Hg2+ Based on a Density Controllable Metal-Organic Hybrid Microarray. Biosens. Bioelectron.
2014,54, 165−170.
(18) Li, H.; Xue, Y.; Wang, W. Femtomole Level Photo- electrochemical Aptasensing for Mercury Ions Using Quercetin- Copper(II) Complex as the DNA Intercalator. Biosens. Bioelectron.
2014,54, 317−322.
(19) Park, S. H.; Xia, Y. Macroporous Membranes with Highly Ordered and Three-Dimensionally Interconnected Spherical Pores.
Adv. Mater.1998,10(13), 1045−1048.
(20) Yang, Y.; Yuan, Z.; Liu, X. P.; Liu, Q.; Mao, C. J.; Niu, H. L.;
Jin, B. K.; Zhang, S. Y. Electrochemical Biosensor for Ni2+ Detection
Based on a DNAzyme-CdSe Nanocomposite. Biosens. Bioelectron.
2016,77, 13−18.
(21) Wei, D.; Sun, Y.; Yin, J.; Wei, G.; Du, Y. Design and Application of Fe3+ Probe for“Naked-Eye”Colorimetric Detection in Fully Aqueous System.Sens. Actuators, B2011,160(1), 1316−1321.
(22) Bonyár, A.; Nagy, P.; Mayer, V.; Vitéz, A.; Gerecs, A.; Sántha, H.; Harsányi, G. A Colorimetry Based, Semi-Automated Portable Sensor Device for the Detection of Arsenic in Drinking Water.Sens.
Actuators, B2017,251, 1042−1049.
(23) Moldovan, C.; Ion, M.; Dinulescu, S.; Savin, M.; Brasoveanu, C.; Firtat, B.; Gartner, M.; Lete, C.; Mihaiu, S.; Gheorghe, M.;
Gheorghe, S. New System for Nitrites and Nitrates Detection from Natural Water Sources. In Proceedings of 2018 IEEE Biomedical Circuits and Systems Conference (BioCAS), Cleveland, Ohio, 17−19 October, 2018; IEEE, 2018.
(24) Chooto, P. Cyclic Voltammetry and Its Applications. In Voltammetry; IntechOpen, 2019.
(25) Vonderviszt, F.; Namba, K. Structure, Function and Assembly of Flagellar Axial Proteins. In Madame Curie Bioscience Database;
Landes Bioscience, 2008; pp 1−19.
(26) Klein, Á.; Kovács, M.; Muskotál, A.; Jankovics, H.; Tóth, B.;
Pósfai, M.; Vonderviszt, F. Nanobody-Displaying Flagellar Nanotubes.
Sci. Rep.2018,8(1), 3584.
(27) Bereczk-Tompa, É.; Vonderviszt, F.; Horváth, B.; Szalai, I.;
Pósfai, M. Biotemplated Synthesis of Magnetic Filaments.Nanoscale 2017,9(39), 15062−15069.
(28) Klein, Á.; Szabó, V.; Kovács, M.; Patkó, D.; Tóth, B.;
Vonderviszt, F. Xylan-Degrading Catalytic Flagellar Nanorods.Mol.
Biotechnol.2015,57(9), 814−819.
(29) Klein, Á.; Tóth, B.; Jankovics, H.; Muskotál, A.; Vonderviszt, F.
A Polymerizable GFP Variant.Protein Eng., Des. Sel. 2012,25 (4), 153−157.
(30) Nador, J.; Kalas, B.; Saftics, A.; Agocs, E.; Kozma, P.; Korosi, L.;
Szekacs, I.; Fried, M.; Horvath, R.; Petrik, P. Plasmon-Enhanced Two- Channel in Situ Kretschmann Ellipsometry of Protein Adsorption, Cellular Adhesion and Polyelectrolyte Deposition on Titania Nanostructures.Opt. Express2016,24(5), 4812−4823.
(31) Kalas, B.; Nador, J.; Agocs, E.; Saftics, A.; Kurunczi, S.; Fried, M.; Petrik, P. Protein Adsorption Monitored by Plasmon-Enhanced Semi-Cylindrical Kretschmann Ellipsometry. Appl. Surf. Sci. 2017, 421, 585−592.
(32) Muskotál, A.; Seregélyes, C.; Sebestyén, A.; Vonderviszt, F.
Structural Basis for Stabilization of the Hypervariable D3 Domain of Salmonella Flagellin upon Filament Formation.J. Mol. Biol.2010,403 (4), 607−615.
(33) Szabó, V.; Muskotál, A.; Tóth, B.; Mihovilovic, M. D.;
Vonderviszt, F. Construction of a Xylanase a Variant Capable of Polymerization.PLoS One2011,6(9), e25388.
(34) Bereczk-Tompa, É.; Pósfai, M.; Tóth, B.; Vonderviszt, F.
Magnetite-Binding Flagellar Filaments Displaying the MamI Loop Motif.ChemBioChem2016,17(21), 2075−2082.
(35) Gasteiger, E.; Hoogland, C.; Gattiker, A.; Duvaud, S.; Wilkins, M. R.; Appel, R. D.; Bairoch, A. Protein Identification and Analysis Tools on the ExPASy Server. In Proteomics Protocols Handbook;
Humana Press, 2005; pp 571−607.
(36) Hirlekar Schmid, A.; Stanca, S.E.; Thakur, M.S.; Thampi, K. R.;
Raman Suri, C. Site-Directed Antibody Immobilization on Gold Substrate for Surface Plasmon Resonance Sensors.Sens. Actuators, B 2006,113(1), 297−303.
(37) Hinrichs, K.; Eichhorn, K. J.; Ertl, G.; Mills, D. L.; Lüth, H.
Ellipsometry of Functional Organic Surfaces and Films; Springer Series in Surface Sciences, Vol.52; Springer-Verlag: Berlin, Germany, 2014.
(38) Kozma, P.; Kozma, D.; Nemeth, A.; Jankovics, H.; Kurunczi, S.;
Horvath, R.; Vonderviszt, F.; Fried, M.; Petrik, P. In-Depth Characterization and Computational 3D Reconstruction of Flagellar Filament Protein Layer Structure Based on in Situ Spectroscopic Ellipsometry Measurements.Appl. Surf. Sci.2011,257(16), 7160.
(39) Nemeth, A.; Kozma, P.; Hülber, T.; Kurunczi, S.; Horvath, R.;
Petrik, P.; Muskotál, A.; Vonderviszt, F.; Hős, C.; Fried, M.; Gyulai, J.;
Bársony, I. In Situ Spectroscopic Ellipsometry Study of Protein Immobilization on Different Substrates Using Liquid Cells.Sens. Lett.
2010,8(5), 730−735.
(40) Kozma, P.; Nagy, N.; Kurunczi, S.; Petrik, P.; Hámori, A.;
Muskotál, A.; Vonderviszt, F.; Fried, M.; Bársony, I. Ellipsometric Characterization of Flagellin Films for Biosensor Applications.Phys.
Status Solidi C2008,5(5), 1427.
(41) Oates, T. W. H.; Wormeester, H.; Arwin, H. Characterization of Plasmonic Effects in Thin Films and Metamaterials Using Spectroscopic Ellipsometry.Prog. Surf. Sci.2011,86(11−12), 328−
376.
(42) De Feijter, J. A.; Benjamins, J.; Veer, F. A. Ellipsometry as a Tool to Study the Adsorption Behavior of Synthetic and Biopolymers at the Air−Water Interface.Biopolymers1978,17(7), 1759−1772.
(43) Nečas, D.; Klapetek, P. Gwyddion: An Open-Source Software for SPM Data Analysis.Central European Journal of Physics2012,10, 181−188.
(44) Sigel, A.; Sigel, H.; Sigel, R. K. O. Nickel and Its Surprising Impact in Nature; Wiley, 2007; Vol.2.
(45) Boer, J. L.; Hausinger, R. P. Nickel-Binding Sites in Proteins. In Encyclopedia of Metalloproteins; Springer: New York, 2013; pp 1528−
1534.
(46) Pettersen, E. F.; Goddard, T. D.; Huang, C. C.; Couch, G. S.;
Greenblatt, D. M.; Meng, E. C.; Ferrin, T. E. UCSF Chimera - A Visualization System for Exploratory Research and Analysis. J.
Comput. Chem.2004,25(13), 1605−1612.
(47) Pappalardo, G.; Impellizzeri, G.; Bonomo, R. P.; Campagna, T.;
Grasso, G.; Saita, M. G. Copper(II) and Nickel(II) Binding Modes in a Histidine-Containing Model Dodecapeptide.New J. Chem.2002,26 (5), 593−600.
(48) Kumara, M. T.; Tripp, B. C.; Muralidharan, S. Layer-by-Layer Assembly of Bioengineered Flagella Protein Nanotubes.Biomacromo- lecules2007,8(12), 3718−3722.
(49) Kurunczi, S.; Nemeth, A.; Hulber, T.; Kozma, P.; Petrik, P.;
Jankovics, H.; Sebestyen, A.; Vonderviszt, F.; Fried, M.; Barsony, I. In Situ Ellipsometric Study of Surface Immobilization of Flagellar Filaments.Appl. Surf. Sci.2010,257, 319.