FACULTY OF AGRICULTURAL SCIENCES INSTITUTE OF AGRICULTURAL ENGINEERING
Program leader Prof. Dr. János Schmidt
DSc
Subprogram leader and supervisor Prof. Dr. Miklós Neményi
DSc
EXAMINATION
OF DRYING CHARACTERISTICS OF MAIZE (ZEA MAYS L.) HYBRIDS AND THEIR
GENETIC DETERMINATION
Written by ATTILA J. KOVÁCS
A kiadvány a TÁMOP 4.2.2 B-10/1-2010-0018 számú projekt támogatásával valósult meg.
ISBN 978-963-334-126-1
Original copy: 1998 Revised
2013
1. CONTENTS
1. CONTENTS . . . 2
2. INTRODUCTION . . . 3
3. THIN LAYER DRYING CHARACTERISTICS . . . 4
3.1. INTRODUCTION . . . .4
3.2. LITERATURE REWIEV . . . .4
3.2.1. Drying Characteristics . . . .4
3.2.2. Moisture Content Definition . . . .6
3.2.3. Inheritance of Artificial Drying Characteristics . . . .6
3.3. MATERIALS AND METHODS . . . .8
3.3.1. Maize Samples . . . .8
3.3.2. Drying Experiments . . . .8
3.3.3. Evaluation Method of Drying Experiments . . . .8
3.4. RESULTS . . . .10
3.4.1. Measurements at Different Drying Temperatures . . . .10
3.4.2. Artificial Drying Characteristics of Hybrids and Local Strains . . . .12
3.4.3. Preliminary Examinations for Revealing the Inheritance of Artificial Drying Characteristics . . . .19
3.5. CONCLUSIONS . . . .22
4. SCANNING ELECTRON MICROSCOPY (SEM) . . . 23
4.1. INTRODUCTION . . . .23
4.2. LITERATURE REVIEW . . . .23
4.2.1. Structure of Maize Kernels . . . .23
4.2.2. Scanning Electron Microscopy . . . .25
4.3. MATERIALS AND METHODS . . . .26
4.4. RESULTS . . . .27
4.5. CONCLUSIONS . . . .34
5. MAGNETIC RESONANCE IMAGING (MRI) . . . 35
5.1. INTRODUCTION . . . .35
5.2. BASIC THEORY OF MRI . . . .35
5.3. LITERATURE REVIEW . . . .36
5.4. MATERIALS AND METHODS . . . .37
5.4.1. MRI Parameters . . . .37
5.4.2. Drying Parameters . . . .38
5.4.3. Image Preparation . . . .38
5.5. RESULTS . . . .38
5.5.1. Measurement of T2 Values . . . .38
5.5.2. MRI of Maize Kernels during Drying . . . .39
5.6. CONCLUSIONS . . . .46
6. SUMMARY . . . 47
7. THESES . . . 49
8. ACKNOWLEDGEMENT . . . 50
9. REFERENCES . . . 51
LIST OF SYMBOLS AND ABBREVIATIONS . . . 56
APPENDICES . . . 57
2. INTRODUCTION
Maize1* is among the three most important grains (beside wheat and rice) in the world.
Globally they provide the most basic of animal feed and food for human consumption.
Compared with the other grains, maize has a remarkably high carbohydrate (energy) content - which is stored in the endosperm as a form of starch - and so high nutritional value. Remember for example the breakfast foods or the feed mixtures of livestock.
Cereal grains are very often harvested at moisture contents different from the equilibrium moisture content at the storage temperature and relative humidity. Without reducing the initial moisture content the storage is doomed to failure. Preserving the grain against deterioration after harvesting always needs different kinds of processes called post-harvest techniques (handling, transportation, cleaning, drying, storage etc.). The drying process is the most widely practised grain preservation method of post-harvest treatments to ensure safe storage as well as providing a commercially marketable commodity. Maize is frequently subjected to artificial drying because its moisture content at harvesting is very often higher than that for safe storage (ca. 12
…14% w.b.). The huge mass of bulk which is dried each season, the deterioration of grain by improper drying and the fact that drying uses about 60% of the total energy used in corn production (Broker et al., 1992), makes the study of drying important.
The basic leading concept of this Ph.D. work was to find links and relationships between the agrophysical (heat physical) and the biological characteristics of maize grains. These characteristics are not separated from each other and none of them can be investigated in isolation without taking the other into consideration. The results provide information for an agricultural engineer, who deals with drying technologies, an agronomist, who must select varieties and a plant breeder, who develop new hybrids, too.
Each chapter - 3. Thin Layer Drying Characteristics; 4. Scanning Electron Microscopy (SEM); 5. Magnetic Resonance Imaging (MRI) - is somewhat independent of the others, having an own Introduction; Literature Review; Materials and Methods; Results;
Conclusions (modular structure). All of these require distinctly different theory, approach and evaluation method and technique. Hence, combining them into continuous sub- chapters would have been resulted a very complicated and confusing structure.
Thin layer drying experiments were carried out to investigate the artificial drying characteristics (different temperature measurements), to establish the differences in drying velocities of maize types (ranking lists). Projecting the results in practise, using artificially fast drying types of hybrids can result in general 15 … 20% saving of drying energy. Genetic studies were begun to reveal the inheritance of artificial drying characteristics. Scanning electron microscopy was used to study internal structure of maize kernels in relation to their artificial drying characteristics. The micrographs proved links between the structure of floury endosperm and drying types. Calculation of moisture gradient vectors from nuclear magnetic resonance imaging of maize kernels during drying may give a break-through in checking of mass transfer models.
However, throughout this work the guiding line was to reveal the connections of artificial drying characteristics, based on the research of Neményi (1983, 1988, 1993).
1 * Throughout this work the word “maize” is used referring to Zea mays L. in the British sense, which in the North American is referred to as “corn”.
3. THIN LAYER DRYING CHARACTERISTICS
3.1. INTRODUCTION
Rapid rate of drying is of great importance for several reasons. (i) Drying costs are reduced by consuming less energy exploiting hybrids, which require less time to dry (fast drying types). (ii) Fast drying can be advantageous in those regions where the harvesting period is short, because of early unfavourable weather conditions, which necessitates the farmers’ quicker post-harvest labour. (iii) Since the fast drying produces high evaporation the core temperature of the kernels is lower therefore the quality of the grain, which possesses fast drying characteristics, is more likely to be preserved.
There are three possibilities to decrease the energy consumption of grain dryers.
(i) Increase the energy efficiency of grain dryers. (ii) Preferential selection of hybrids based on their field dry-down rate. (iii) Using artificially fast drying types. (Neményi, 1988; Neményi and Kacz, 1993). This study is dealing with the last mentioned way (iii) and tries to answer some questions:
Which drying temperature produces the biggest differences of drying velocity?
How big are the differences of artificial drying characteristics among different hybrids, local strains and inbred lines? How can they be ranked or classified?
How can be the drying velocity as a function of initial moisture content established into an equation? (Are they really correlating linearly (Neményi, 1993) between wide initial moisture content ranges, too?)
Part of this chapter deals with the inheritance of artificial drying characteristics.
However, this work is only the first steps of a comprehensive genetic research; although a plant breeder is able to use these results as preliminary examinations.
3.2. LITERATURE REVIEW
3.2.1. Drying Characteristics
As it was mentioned in the chapter 2. (Introduction) this work could be the continuation of Neményi’s work (1983, 1988 and 1993). His research program of drying of maize hybrids began in 1981 at the Pannon Agricultural University, Faculty of Agricultural Sciences, Mosonmagyaróvár. He studied the physical, chemical and morphological characteristics of different drying types of hybrids. Diffusion equations and mathematical connections among diffusion parameters and distinctive features of the substance were set up (Neményi, 1983). The drying characteristics of Opaque mutant hybrids were tested (Neményi, 1988), projected the inspiration and basic idea of present genetic examination. The drying characteristics of hybrids with different FAO numbers were tested (Neményi, 1991). Several market hybrids were studied in respect to their thin and thick layer drying characteristics (Neményi, 1991, 1993). It was concluded that the differences in thin layer drying experiments were smaller. In 1991 Neményi plotted the average drying velocity as a function of initial moisture contents and gave a curve (instead of one point) to typify the drying characteristics of
maize hybrids. Regression lines were fitted to the points of average drying velocity vs.
initial moisture content. (Neményi, 1993; Neményi and Kacz, 1993). Although the lines fitted in good correlation to the measured points, the range of initial m.c. was relatively narrow (Xi 0.15 … 0.40 kg/kg).
Everybody accepts that differences occur among drying behaviour of different grains. Bakker-Arkema et al. (1983) compared drying rates of six grains (barley, maize, rice, wheat, sorghum and soybeans) and found that maize and soybeans were the slowest thin layer drying grains and wheat was the fastest. Deviations of artificial drying characteristics are in one species (e.g. Zea mays L.) sometimes (few times) not so unambiguous. Thompson et al. (1968) studied the effect of maize variety on thin layer drying. They found no significant effect of variety on drying rates, however only a few experimental tests were carried out to evaluate the effect of the variety.
Misra et al. (1980) compiled 774 thin layer drying tests, consisted of more than 15,000 observations, to develop a drying equation which fitted well for all of the measured data in order to arrive to a standard method to conduct thin layer drying tests. They found a heterogeneous nature of the observed data due to the differences in sample preparation, drying conditions, and different types of dryers, as well as data recording techniques. However, though not mentioned in the article, it is possible that differences in variety was also contributed to the anomalous data.
Henderson and Pabis (1961) studied the factors affecting thin layer drying rates giving an equation for the drying constant. The experimental points scattered from the theory, which were explained of natural variation.
Nass and Crane (1970) examined the drying rates of a normal and nine endosperm mutant hybrids in three hybrid backgrounds. They found mutants that had greater drying rates, others have slower rates and two of the nine mutants had the same drying rate as the normal one. Opaque-2 had a significantly greater drying rate at earlier harvests only. In their study the endosperm seemed to be a major factor controlling moisture loss by the maize kernel, since the pericarps were identical for each mutants.
Varietal differences in moisture loss during artificial drying were found by the study of Wight (1981). A high-lysine cultivar appeared initially to lose moisture more slowly with an increase in the drying temperature, but thereafter more rapidly than the other three examined cultivars.
Stroshine and Martins (1986) compared thin layer drying rates of five maize hybrids with very similar initial moisture contents (wi ≈ 25% w.b.) and found substantial differences among them. The differences in drying efficiency (heat energy per unit of water removed) between the fastest and the slowest hybrid increased by up to 85% in two-hour test. The rank of efficiencies among hybrids was nearly identical to the rank of the thin layer drying tests.
Thin layer drying curves obtained from the same drying conditions (temperature, relative humidity, air flow rate) must not be compared unless the initial moisture contents of the grain was the same, because drying rate was found to be significantly affected by the initial moisture content (Li and Morey, 1984).
Exhibited differences in drying rate of maize inbreds and hybrids were found (Stroshine et al., 1981). The relative ranking of types were the same in the studied two
years (1979 and 1980), however the drying rates of inbreds and hybrids tested in 1979 were slower. The aim of this study was to demonstrate differences between inbreds and hybrids for maize breeding programs.
Stroshine et al. (1986) studied thin layer drying rates of different hybrids. They measured statistically significant differences among the drying rates and found that fast drying hybrids have apparently energy saving potential.
The effect of moisture content of maize at harvests (initial m.c.) was studied by Liu et al. (1997). They found that kernels of lower moisture content dry more slowly than kernels of average moisture and kernels of higher than average m.c. dry faster. This also proves that initial moisture content must be taken into consideration examining the artificial drying characteristics.
Wall et al. (1975) investigated the effect of drying temperatures for maize grain quality. They found that above 80°C drying is related to heat denaturation of maize proteins, however at grain temperatures below 100°C only little damage takes place to amino acids during drying.
3.2.2. Moisture Content Definition
The moisture content of grains denotes the quantity of water per unit mass of either wet or dry grain. The moisture content dry basis, X is defined as (Kraszewski, 1998 and Beke, 1994):
d w
m
X m (1)
where mw is the mass of water, and md is the mass of dry material. The wet basis moisture content, w is usually expressed as a percentage basis and defined as:
100
d w
w
m m
w m (2)
Conversions from moisture contents are done as follows (Beke, 1994 and Broker, 1992):
1 100
X
w X
(3)
1 100
X
w X (4)
3.2.3. Inheritance of Artificial Drying Characteristics
Maize is a plant of infinite possibilities; no man can ever foresee just which lines of investigation will yield the information of tomorrow’s needs (Wallace and Bressman, 1949). Thinking over this disclosure the investigation of inheritance of artificial drying characteristics may become in one day more in focus for maize genetics, which is - to be honest - nowadays not among the practical work of maize breeders. These are:
yield; quality; response of cultivation practices; resistance to diseases, pests and adverse
environmental factors; suitability for mechanised cultivation and harvesting (FAO, 1982). However, the artificial drying characteristics still exist among requirements of the breeding work to satisfy mechanisation requirements (Bálint, 1990).
Very few literature can be found dealing with the genetics of artificial drying characteristics of maize kernels. Prudy and Crane (1967) studied the inheritance of drying rate of maize from husked ears at 38°C drying air temperature. Diallel analysis was carried out and indicated that the drying date is fixable. Another diallel analysis was reported by Bdliya and Burris (1988) to examine the tolerance of drying injury in seed maize. Large and significant variability was obtained among inbred lines and hybrids, too. Maternal effect was observed for tolerance of hybrid seeds to drying injuries.
In contrast with this the studies of inheritance of filed drying rate is more detailed.
Several factors (ear and kernel weight; husk numbers and width; shank length; pericarp permeability etc.) were examined in an attempt to learn if they were associated with differing field drying rate by Crane et al (1959). The final aim of these investigations was the same, namely to reduce the drying cost using hybrids which lost moisture quicker in field. Hence less drying would be needed. Hadi (1982, 1983 and Agr. Res. Inst. of the HAS, 1985) carried out extensive research of moisture loss at the Agricultural Research Institute of the Hungarian Academy of Sciences, Martonvásár.
Baron and Daynard (1984) studied the grain dry-down rate of European and Canadian maize hybrids. They concluded that factors affecting moisture loss could explain hybrid differences. Significant variation was also found among hybrids of field dry-down rate by the work of Cross and Kabir (1989). Hybrid’s relative rate of moisture loss was measured in a diallel set of hybrids. Results of their experiment suggest several breeding strategies for developing maize hybrids with faster rates of moisture loss.
Indirect selection for low moisture (faster drying rates) hybrids was used by Sweeney et al. (1994). They suggest that selection of early husk senescence in inbreds would result in hybrids with lower grain moisture.
Cross (1985) found that selection for fast drying rates of moisture loss in the field improved the laboratory drying rates.
Restriction fragment length polymorphism (RFLP) is a new technique which can be utilised to find genetic markers and/or develop linkage data, beside the “classical”
breeding techniques (diallel crossing etc.). RFLP loci were find to have significant effect on grain moisture at harvest (Walton and Jaris, 1987). This suggests that it would be possible to select for lower grain moisture levels by selecting for the presence of the detected loci. This new technique surely would provide progress finding genetic reasons of artificial drying characteristics, too. Therefore, using RFLP techniques breeding program developing fast drying hybrids at elevated temperatures (grain dryers) could be shortened.
3.3. MATERIALS AND METHODS
3.3.1. Maize Samples
Thin layer drying tests were run with different hybrids, local strains and inbred lines with different initial moisture contents from each type. The IKR Bábolna Co provided maize samples from three harvests in the experimental year 1993. The following years examinations (1994, 1995, 1996 and 1997) the maize samples were harvested from own experimental fields. In 1995 additional studies were carried out at the Catholic University (KU) Leuven, Belgium. The specimens of different harvests were received from an experimental field of Pioneer Company, Belgium. These measurements is marked as “1995, KU Leuven”, meanwhile the 1995 Hungarian experiments is marked only with the year (“1995”).
Maize kernels from the middle part of the ear were used as samples in the experiments. One layer of grains (approx. 40 g) was placed on an aluminium tray and placed on the balance of the dryer.
After every drying test initial moisture content was determined using a conventional drying chamber at 105°C for 72 hours (ASAE Standard 43rd Ed., 1996).
3.3.2. Drying Experiments
OHAUS Model MB200 drying chambers were used for the drying experiment. The dryers were connected on-line with a PC and weight loss (due to moisture loss) was recorded every minute during drying. The measurements were carried out at 70°C.
Preliminary measurements were performed at different drying temperatures (60°C, 70°C, 80°C and 90°C) in 1993.
3.3.3. Evaluation Method of Drying Experiments
An example is now given from chosen measurements in the 1996-year studies explaining the evaluation method of the drying experiments.
The measured thin layer drying curves of two hybrids (Florencia, Helga) by different initial moisture contents can be seen in Figure 1. Average drying velocities, X/ were calculated using the first 120 minutes drying. Each thin layer drying curve (Figure 1) denotes one drying velocity point as a function of its initial moisture content (Figure 2). Linear regression lines can be fitted with very good correlation (R2 > 0.9 for the majority of the measurements) thus the artificial drying characteristics of a hybrid can be defined as a line (Neményi, 1993). These lines can differ from their slopes and intercepts. In particular case this could mean that, when the lines cross each other, one hybrid lost moisture quicker than the other only at high initial moisture contents.
Figure 1. Drying curves of two hybrids with different initial moisture contents, Xi.
Figure 2. Average drying velocities of the selected hybrids (Fig. 1) as a function of initial moisture contents. Each point represents one drying.
Selecting a particular initial moisture content, around the harvesting point the grains can be categorised with one point. In Figure 3 hybrids are ranked by plotting the slope of their drying velocity lines (Figure 2) as a function of their average drying velocities by Xi = 0.4 kg/kg initial moisture content. The horizontal position (abscissa) of a point characterises the drying velocity, the higher the value (X/) the faster the kernel drying. The vertical position (ordinate) shows how the variety keeps its velocity with different initial moisture contents.
Figure 3. The selected hybrids were categorised relatively by plotting their slope of drying velocity lines (Fig. 2) as a function of average drying velocities at a particular initial moisture content, (Xi = 0.4 kg/kg).
The general and specific combining ability of the crossed inbred lines were calculated using the following equations (Jánossy et al., 1966). The general combining ability (GCA), PA of a parent line A can be expressed as:
(5)
where n is the number of total lines; and Bi is the mated line from the population.
The specific combining ability (SCA), pAB of two parent lines (A and B) is:
(6) where is the average phenotypic value of the F1 generation. The average com- bining ability is due to the additive genetic variance in the base of population. Dif- ferences of special combining ability are attributable to the non-additive (dominance, epistasis) genetic variance (Falconer, 1960).
3.4. RESULTS
(The database of all the measurements can be seen in Appendix 1.) 3.4.1. Measurements at Different Drying Temperatures
Drying velocities of two hybrids (DK 300 and DK 523) were compared at different drying temperatures (Figure 4).
Figure 4. Average drying velocity lines of two hybrids (DK 523: good drying; and DK 300: bad drying type) as a function of initial moisture contents with different drying temperatures.
Figure 5 shows the differences of the average drying velocities by three initial moisture contents (Xi = 0.20; 0.25 and 0.30 kg/kg). The greatest differences were measured between 70°C and 75°C drying temperatures.
Figure 5. Differences of drying velocities taken as a function of drying temperatures of the two examined hybrids (DK 523, DK 300).
Taking into consideration this result and the work of Wall et al. (1975) the drying temperature for experiments of comparing different maize types was chosen 70°C.
3.4.2. Artificial Drying Characteristics of Hybrids and Local Strains
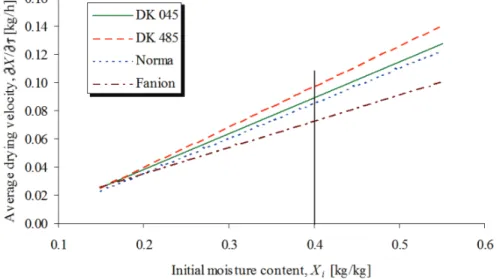
Several hybrids were tested throughout five years to find the differences of the artificial drying velocities. In Figure 6 the most typical average drying velocity lines can be seen from the first year experiments (1993). The differences in velocity run up to 45% between the fastest and the slowest hybrid.
Figure 6. Average drying velocities of four selected hybrids from the 1993-experiments as a function of initial moisture content.
In 1993 the artificial drying characteristics of hybrids followed the tendencies that higher drying velocity possessed bigger slope (Figure 7). This means that hanging the initial moisture content does not change the differences in moisture loss. For example, Fanion always dries the slowest and Occitan the fastest among these varieties.
Figure 7. The ranking list of 1993 experiments. Hybrids on the upper right corner are considered good (fast drying) ones, meanwhile hybrids on the left bottom are slow (bad) types.
The result of the 1994 experiments can be seen in Figure 82*. The hybrids Sze DK 371 and MTC 344 have nearly the same drying velocities, but the slopes are different. This denotes that in lower initial moisture content (Xi < 0.4) MTC 344 is decreasing slower its velocity than Sze DK 371. The same can be observed for Sze DC 488 and TC 3515.
Figure 8. The slopes of velocity lines as a function of average drying rates of hybrids in 1994-experiments.
2 * The graphs of average velocity lines, the equations and R2 values of all the drying experiments can be seen in Appendix 2.
Measurements in 1995 (Figure 9) differ from the previous ones. The drying velocity of MTC 344 is still high but its slope is much slower. The correlation between drying velocity (X/) and slope (tg) has changed. In 1995-year study the higher drying velocity was not followed by bigger slope. There were types with the same velocity but different slope (Stira and P 3769), and hybrids with different velocity but the same slope (MTC 344 and Marista).
Figure 9. Results of 1995-year examinations. In this case higher average drying velocity did not followed by bigger slope of velocity line.
The same tendency can be seen in Figure 10 (1996-year studies) and more in Figure 11 (1997-year studies). In Figure 12 (1995, KU Leuven) the correlation between slopes and average velocities is again higher. The reason is evident if we look at the range of the initial moisture contents, where the measurements were done. Table 1 shows the average values of the initial moisture contents of the studied range in each year.
Table 1. The average values of measurement ranges of initial m.c. Xi.
Year 1993 1994 1995 1995
KUL 1996 1997
Average value of initial
m.c., Xi [kg/kg] 0.223 0.265 0.575 0.294 0.416 0.589
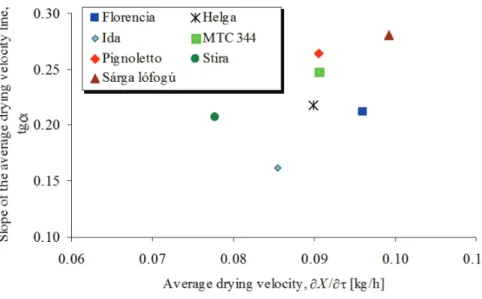
Figure 10. Slope of average drying velocity lines of 1996-experiments as a function of average drying velocities.
Figure 11. Ranking list of hybrids measured in 1997.
Figure 12. Results of the experiments carried out in 1995/96 at KU Leuven. Higher slope of velocity lines was found at hybrids having faster average drying velocity.
In 1993, 1994 and 1995 (KU Leuven) experiments the hybrids were harvested with lower initial moisture contents. In 1995, 1996 and 1997 the grain samples were more moist due to the weather conditions in each autumn (Időjárási havijelentés / Monthly Weather Report, 1993 … 1997)3*. This deviation can be studied in the connection between slopes of average velocity lines and the drying velocity lines.
There were also differences in drying velocities between the two local strains (Pignoletto, Sárga lófogú) examined in 1996 (Figure 10) although they both were ranked as fast drying types with big slopes.
The ranks of hybrids, which were measured more than one year were studied. We have already concluded that MTC 344 showed high average drying velocity in the years 1994 and 1995 (Figures 8 and 9), but it was middle type in 1996 (Figure 10). Florencia was middle in 1993 (Figure 7) and 1997 (Figure 11), but well in 1996 (Figure 10). The average drying velocity of Stira was intermediate in 1995 and 1997, but slow in 1996 (Figures 9, 11 and 10). Helga performed middle drying velocity in 1996 (Figure 10), and fast in 1997 (Figure 11).
However, the fact is have to be taken into consideration that each year different hybrids were presented beside the above reported ones (Florencia, Helga, MTC 344 and Stira), and as mentioned before the initial moisture contents were not the same, too. Thus their positions in the ranking list are relative and can be different in every year.
3 * Appendix 3. contains the monthly precipitation values between 1993 and 1997 measured at Mosonmagyaróvár meteorological station.
The results of the different year examinations of hybrids were plotted on the same graphs (Figures 13, 14, 15 and 16). Thus the average drying velocities could be studied with wider range of initial moisture contents than by the yearly evaluations. In this manner polynomial equations can describe more precisely the measured drying velocity points than linear ones.
Figure 13. Average drying velocity as a function of initial moisture content of two-year experiment of Helga.
Figure 14. Polynomial fitting of the measured velocity points of Florencia in 1993, 1996 and 1997 experiments together.
Figure 15. Three-year study of MTC 344 resulted a polynomial curve of average drying rate as a function of initial m.c.
Figure 16. The drying velocity vs. initial moisture content showed nearly linear relationship in the 3-year study of Stira.
Does it mean that the average drying velocities can be described more accurately using polynomial equations instead of lines, which were presented earlier in this chapter? Yes, the polynomial curve fits better to the measured points.
On the other hand polynomial curves are starting to deviate from a line at very low and very high initial moisture contents (0.2 < Xi < 0.6 kg/kg). In practice maize
hybrids are to be harvested between Xi = 0.25 … 0.40 kg/kg moisture contents, where the section of polynomial lines are nearly linear. Hence linear equation can be used for average drying velocity points in this initial moisture content range. However polynomial fitting is needed when the artificial drying velocity is studied in wide range of initial moisture content (Figure 17).
Figure 17. Comprehensive graph of drying velocities of the four examined hybrids showing their drying types.
The charts on Figure 13 … 17 also proved that the results of different years could be compared together instead of the evident meteorological differences. This indicates that the artificial drying characteristics are independent of the environmental conditions.
Hereby these characteristics must be genetically determined.
3.4.3. Preliminary Examinations for Revealing the Inheritance of Artificial Drying Characteristics
Inbred lines were tested to find differences in artificial drying velocities among them in 1994 and 1995 (Figure 18 and 19). A three-way cross hybrid (MTC 344) was also studied among its parent lines (A635, W117, W153R). Although the hybrid showed heterotic vigour in 1995 this was not so in 1994 when the inbred W153R had higher average drying velocity.
The range of initial moisture content also differed in these two-year experiments.
The average initial moisture content all of the examined types were Xi = 0.259 kg/kg in 1994 and Xi = 0.559 kg/kg in 1995.
Figure 18. Slope of drying velocities of inbred lines and a hybrid (MTC 344) vs. their average drying velocities (1994-experiments).
Figure 19. Results of the 1995-year study of different maize lines and a hybrid.
Analysis of diallel crossing, including reciprocals of public inbred lines A635, W117 and W153R, was carried out to begin the study of the inheritance of artificial drying characteristics in 1996 (Figure 20). The reciprocals (A635 W117 and W117 A635 etc.) did not performed differences neither in drying velocities nor in slopes. This corroborates that maternal effect does not play a role of the inheritance of artificial drying characteristics.
Figure 20. The results of 1996-drying experiments. The slopes of average drying rates of inbred lines and their crosses were plotted as a function of their average drying velocities.
Table 2 shows the average drying velocities in a 33 diallel set of the examined inbred lines.
Table 2. The results of tests measuring average drying velocity,
X/ [kg/h] of inbreds and their reciprocals.
& % A635 W117 W153R Average
A635 0.108 0.105 0.097 0.103
W117 0.102 0.101 0.094 0.099
W153R 0.098 0.094 0.102 0.098
Average 0.103 0.100 0.098 0.09837*
* The average values of the total F1 reciprocals (P).
The general combining ability (GCA) was compared to the total average of F1 crosses (Jánossy et al., 1966):
P P
pA A (7)
The best general combining ability was attributed to the A635 inbred line, and W153R showed the less GCA (Table 3).
Table 3. General combining ability of the studied inbred lines.
Inbred line A635 W117 W153R
GCA PA 0.10041 0.09883 0.09586
pA 0.00204 0.00046 -0.00251
Table 4 shows specific combining ability (SCA) effects. A635 W117 and its reciprocal W117 A635 have gene interactions that possess fast drying characteristics.
In contrast the combination of W117 W153R results slower drying rate.
Table 4. Specific combining ability of the examined inbred lines.
& % A635 W117 W153R
A635 - 0.00514 -0.00134
W117 0.00238 - -0.00313
W153R -0.00005 -0.00299 -
The results have not showed real heterosis effect but it would be too early to reach considerable conclusions of the inheritance of artificial drying characteristics of maize without further examinations.
3.5. CONCLUSIONS
The method used in this study for thin layer artificial drying characteristics of maize hybrids is a capable tool for distinguishing differences among types. Optimal drying temperature was necessary to be determined for the measurements of the biggest differences. The several year experiments supplied data to study the diversity of drying velocities of different hybrids, local strains and inbred lines.
Ranking lists serve information to agronomists choosing the optimal hybrid from a point of view concerning artificial drying. The preliminary investigations of inheritance of drying characteristics are a good basis for further, more sophisticated genetic research. The results of drying tests can supply information for structural engineers, who design grain dryers; and a scientist, who mathematically models the artificial drying process.
4. SCANNING ELECTRON MICROSCOPY (SEM)
4.1. INTRODUCTION
The structural-mechanical characteristics of agricultural materials are principal in drying technological point of view (Ginsburg, 1979). This means that the mechanical characteristics, which primarily influence the drying (viscosity, elasticity, plasticity and firmness), are strongly connected with the material structure. In addition the structure of kernels is also in focus of maize genetic research, thus the results can be in interest of plant breeders as well.
This chapter begins with a relatively long, detailed description of kernel structure, which partially belongs to the next chapter, 5. Magnetic Resonance Imaging (MRI), too. Moreover, the schematic diagram (Figure 21) in this review was made from a real kernel using digital image processing4*.
4.2. LITERATURE REVIEW
4.2.1. Structure of Maize Kernels
Figure 21 shows the diagram of the mature dent maize caryopsis. The maize kernel is composed of the three main structural parts: hull (pericarp and seed coat), endosperm5*, and germ (Wolf et al., 1952a). Each part consists of several layers and different tissues. This study there looked at only those components of maize kernels that were closely connected to moisture movement.
Figure 21. Schematic diagram of a dent maize kernel.
4 * The photo of the grain can be seen in Appendix 4.
5 * The thesaurus of two types of endosperm are the following: (i) floury or opaque or soft endosperm; and (ii) horny or translucent or vitreous or hard endosperm.
The pericarp, together with the tip cap form the outermost covering for an individual kernel. Although there is absorption of water by the pericarp cells, most of the water entering the kernel is taken up through the basal end of the tip cap and moves rapidly through the uninterrupted labyrinth of air spaces in the spongy parenchyma of the tip cap (Wolf et al., 1952b). Among the four layers of the pericarp, the cross and tube cells (the innermost layers) are partially in contact, which result in many intercellular spaces. Thus it is an area through which water can move easily (MacMasters, 1962).
As Wolf et al. (1952b) established, the spongy parenchyma cells of the tip cap are similar to the cross cells of the pericarp and the two form continuous tissue. Kiesselbach and Walker (1952) found that in the germinal side, opposite the scutellar node, the inner pericarp was greatly compressed as was the inner part of the outer pericarp. The inner pericarp was not distinguishable in the distal end of the kernel.
The seed coat acts as a semi-permeable membrane. Together with the hilar layer, they form a protective wall over the entire seed except for a small area opposite the primary root or radicle (Kiesselbach and Walker, 1952). As Brandbury et al. (1962) assumed, the seed coat and the hilar layer undoubtedly constitutes a partial barrier to the passage of moisture.
The aleuron layer, in which there are no intercellular spaces, encloses the endosperm and the germ and it is interrupted over the hilar layer at the base of the kernel (Wolf et al., 1952c). The thickness of the aleuron layer, which is generally one cell layer, is considerably thinner in the dent region. Water and dissolved substances must diffuse through the thick aleuron cell walls before reaching the starchy endosperm cells.
The endosperm is the hardest part of the kernel, which to remove moisture from.
This is partly because it is surrounded by other tissues, and mainly contains only small, unconnected, intercellular spaces according to MacMasters (1962). The shape and size of the starch granules vary with their location in the endosperm. Large granules are found in the inner, loosely organized cells of the floury endosperm. Wolf et al. (1952c) confirmed that the proteinaceous matrix, in which the starch granules are embedded, is loose and fragmentary in the inner floury endosperm, being dense and well developed in the outer portions of the endosperm, particularly in the horny portions. Song et al. (1992) found out from their 3D MRI examinations that the floury endosperm lost moisture faster than the vitreous endosperm. From the previously mentioned work, it is clear that the moisture in the center of the kernel is transferred through the glandular layer of the scutellum. The particular arrangement of the cells of the epithelium tissue creates an extensive interconnected system of intercellular space around and over the epithelial cells. The epithelium dips into the scutellum forming glands (Wolf et al., 1952d).
The transfer of water between the scutellum and the cavity, occupied by the embryonic axis, is retarded by the scutellar epidermal cells. This is because of the single-layered epidermis of the scutellum in the border of the cavity, covered with a heavy cuticle. The water holding capacity of the embryo is much greater than that of the endosperm, which surrounds it. Wolf et al. (1952d) concluded that water absorbed by the embryo is held as free water in the intercellular spaces - which in the air-dried
state are small. This water is bounded by the cell walls and by the protoplasm, which is holding most of the water absorbed.
4.2.2. Scanning Electron Microscopy
Sefa-Dedeh and Stanley (1979) found that anatomical structures could be used to explain functional properties such as water absorption. Their results indicated that the factors affecting water absorption contributed unequally during the soaking process.
During the initial stage the external structure of the seed was expected to be important.
The porous cotyledon structure and the thin, amorphous seed coat explained the rapid absorption of water. In the later stages the protein content became increasingly important.
Muzilla et al. (1991) indicated from SEM examinations that the more open and less dense ultrastructure of soybean hulls facilitate the movement of water into the hull.
Tang and Sokhansanj (1993) developed a physical model of laird lentil, based on the SEM examinations of lentil microstructure.
Neményi and Szabó (1987) and Neményi (1983, 1988 and 1993) studied extensively the pericarp of maize grains with optical microscope. They found connections between thickness and structures of pericarps and the permeability of different hybrids.
Although the optical microscope gives very expressive pictures of two-dimensional excisions, like pericarp, it is not able to make three-dimensional images, if e.g. the air spaces among starch granules in endosperm are needed to study.
Pomeranz (1972) studied the endosperm of malted barley with SEM. He found that the central starchy endosperm showed starch granules embedded in a protein matrix. It was found from the SEM investigations of the buckwheat kernel that the starch granules in the center of the endosperm of buckwheat kernel filled the contents of cells surrounded by relatively thin cell walls (Pomeranz and Sachs, 1972). Higher magnifications (1,310) of the center of the endosperm indicated that the starch granules were not free but surrounded by a matrix, presumably proteinaceous, which strengthened the structural unity of the cell contents.
Palmer (1972) studied the morphology of starch granules in cereal grains with SEM and light microscopes. It was observed that there were fewer small granules at the distal (non-embryo) end of the barley endosperm. In the dry endosperm the small starch granules were normally associated with protein material forming clumps. It was found that the starch granules of the mealy (opaque) area were loosely associated with paper sheets of protein material. There was a noticeable absence of small starch granules.
Conversely, the steely periphery was tightly packed with a rigid starch-protein matrix. The starch granules were seen to be angular and were intimately associated.
Smaller starch granules were present to a greater extent than in the mealy region and, when dislodged, they left indentations on the surface of the large granules.
Stenvert and Kingswood (1976) studied the moisture penetration during tempering of wheat grains. They found that the endosperm structure had been shown to be of primary importance in water penetration and its more ordered structure - vitreous grains - strongly retarded the rate of moisture penetration. The more closely the protein
matrix occluded the starch granules, the harder the endosperm became and the rate of moisture penetration was slower.
Gunesekaran et al. (1985) studied the stress cracks in maize kernels by SEM. Stress cracks were observed to originate at the inner core of floury endosperm and propagate radially outward along the boundary of starch granules. Robutti et al. (1974) examined the structure of normal and modified opaque-2 corn endosperms with SEM. They found loosely packed, nearly round starch granules associated with thin sheets of protein and many intergranular air spaces in the soft endosperm. The hard endosperm had tightly packed, polygonal starch granules associated with a continuous protein matrix and no intercellular spaces. They gave an explanation as to why the starch granules differed in shape.
The microstructure of opaque mutants in contrast with normal maize (W64A) were studied by SEM (Dombrink-Kurtzman, 1994). The starch granules of all mutants were free and adherent as well the protein bodies, which were smaller than in the normal line.
Wolf et al. (1969) studied eight different varieties of maize. They found that all varieties of corn showed that the outer endosperm had a higher portion concentration than in the inner endosperm. Other general trends apparent from the photomicrographs were an increase in size of both cells and starch granules from the aleuron layer inward to the centre of the kernel. They also found that the endosperm protein fills the space between starch granules.
Nass and Crane (1970) stated that drying rate of maize seeds in the field is regulated in part by colloids in the endosperm.
Wang et al. (1993) studied the morphology of starch granules of 17 maize mutant genotypes. They found that genetic background played a major rule in determining the fine structure of starch components. They have also concluded that the combination of different genes (wx, h wx, sh2 wx, wx du1, ae etc.) creates additional variations in the structure and shape of starch granules. Hence, the SEM examinations of endosperm structures in connections with artificial drying characteristics surely play a role in plant breeding research too.
4.3. MATERIALS AND METHODS
The scanning electron microscopic studies were carried out at the KU Leuven, Belgium in 1995/96. Single kernels were studied each time with SEM. Prior to the examinations kernels were cut into two halves with a razor blade and glued to aluminum stubs. The surface of specimen was sputter-coated with gold (200Å). A JEOL JXA-733 Electron Probe, Japan SEM was used for viewing and photographing the microstructure of the half kernels with 600 and 1500 magnifications.
The images were photographed directly on Polaroid films and the pictures were evaluated visually. Figure 22 shows a typical image of SEM. The distinguishing particles were the starch granules (size, homogeneity of size, shape), the protein matrix surrounding the starch granules (presence, continuance) and air spaces between the constituents.
The legend on the bottom of the pictures contains (from left to right) the following:
kilo-voltage used by the probe; magnification: first two digits (decimal number) multiple by ten over the third digit, (1500 = 15·102 152). The third label is the number of the picture; and the last one is a vertical bar stands for as many micrometers as written above (in Figure 22 it is 10 m).
Figure 22. Scanning electron micrograph of the floury endosperm of a maize kernel (W153R) showing the basic constituents.
4.4. RESULTS
The examined hybrids were classified in two categories: slow drying (Dea, Helga and Stira) and fast drying types (Janna, Florencia and MTC 344), according to the results of the thin layer drying experiments (chapter 3.4.2. Artificial Drying Characteristics of Hybrids and Local Strains).
Floury and horny endosperms of each kernel were studied with SEM. There were no significant differences among the micrographs of horny (vitreous) endospems. The starch granules were very tightly packed surrounded by continuous, unbroken protein matrix as shown in Figure 23. Small differences occurred only in the shape of starch grains (spherical vs. polymorphous).
Figure 23. Scanning electron photomicrograph (600) of the horny endosperm (Marietta).
Structural differences were found only in floury endosperms. Figure 24 shows an image of a floury endosperm of a slow drying type hybrid. The starch granules were packed with few air spaces. The diameter of all granules was very similar. The shape of the starch bodies was not totally spherical but rather amorphous.
Figure 24. Scanning electron microscopic image (1500) of the floury endosperm of the hybrid Dea (slow drying type).
In spite of this, in Figure 25, where a fast drying type can be seen, the starch granules are more spherical and differ very much its sizes. The proteinaceous matrix is less present. The three above mentioned hybrids were harvested at an experimental field of Pioneer Co in Belgium.
Figure 25. Scanning electron micrograph of the fast drying type hybrid Janna (1500).
Floury endosperms of two artificially slow drying hybrids (Helga and Stira) from the Hungarian field experiments were studied with SEM (Figure 26-29). The characteristics of particles were the same (like by the hybrid Dea): dense structure of non-spherical starch granules with very similar sizes; protein-matrix were well visible, but not always uninterrupted. However, the hybrid Stira showed slower drying rate (Figures 26 and 28) in this case Helga showed a bit denser structure (Figures 27 and 29) which could refer higher resistance to water removal.
Figure 26. SEM image (1500) of the floury endosperm of Stira (slow drying type).
Figure 27. SEM image (1500) of the floury endosperm of Helga (slow drying type).
Figure 28. Scanning electron micrograph of the slow drying type hybrid, Stira (600).
Figure 29. Scanning electron micrograph of the slow drying type hybrid, Helga (600).
Floury endosperms of two fast drying hybrids (Florencia and MTC 344) were examined, too (Figure 30 … 33). Their starch granules are much smoother and more spherical (Figures 30 and 32). In smaller magnification (600) the whole structure of soft endosperms seem to be more disconnected with lots of air space (Figures 31 and 33).
The protein matrix is still present and sometimes shows not distinguishable differences with the slow drying ones (Figure 27 and 32). The major dissimilarity is the size of starch granules. While it was nearly the same in slow drying hybrids, here the divergence is apparent.
One can find granules five-ten times bigger than its neighbours (Figure 33). This inhomogenity shows irregular starch development, which does not allow the granules to be put into symmetrical order.
The morphological inhomogenity can cause open structure of endosperms which facilitates quick moisture loss, but it can be also attributed to have different chemical composition, chain lengths of amylose-amylopectin etc. (Hoover et al., 1996). Hence it is not questionable that the drying characteristics is influenced both morphological and structural composition, which points out the future research.
Figure 30. SEM image of the soft endosperm of good drying hybrid, MTC 344 (1500).
Figure 31. Scannig electron picture of the same (MTC 344) hybrid (600).
Figure 32. SEM image of the soft endosperm of good drying hybrid, Florencia (1500).
Figure 33. Scannig electron picture of the same (Florencia) hybrid (600).
4.5. CONCLUSIONS
Scanning electron microscopic (SEM) images of opaque endosperm showed distinctly different structure according to the drying characteristics. The technique seemed to be able to find an explanation why one hybrid dries faster than the other.
Fast drying types showed loose structure, lots of open airspace derived the unequally developed starch granules, and meanwhile slow drying types had dense, compact structure with similar sized starch grains.
The results explain one of the reasons of differences in artificial drying characteristics of maize. Moreover this can be very useful information for plant breeders because genes which affect the quality and quantity of carbohydrate (basic part of endosperm) are well known (Marx, 1981). Investigations, improved techniques (without sputter coating etc.) and studies of more repetition from each variety could result more detailed consequences. In addition these experiments ought to associate with chemical analysis.
5. MAGNETIC RESONANCE IMAGING (MRI)
5.1. INTRODUCTION
Moisture diffusivity of maize kernel components is needed to accurately predict the moisture transport during different grain conditioning operations: storage, drying, aeration, etc. (Muthukumarappan and Gunasekaran, 1994). Knowledge of thermal properties (heat and mass transfer) of maize is essential for studying the drying processes. A number of papers deal with the heat and mass transfers of cereal grains during drying with the final aim of enhancing the efficiency of the dryers. Both the modeling and the basic research of drying are needed to understand the underlying mechanism. The basis of this mechanism is the inside heat and mass transfers of grains.
The heat transfer of intact biological materials can be followed using thermovision method (Neményi and Kacz, 1992; Neményi, 1993 and Neményi and Kacz, 1993) evaluating the thermophotos of infrared camera during drying.
Nuclear magnetic resonance imaging is one of the few experimental techniques which has the capability for studying mass transfers of biological systems non-invasively and non-destructively. Since the discovery of NMR in 1946, magnetic resonance images were only made from the early 1970’s (Crooks, 1985). The first reports of MRI studies of the drying of agricultural products came in the late 1980’s (McCarthy, 1994).
So far two methods were used to evaluate NMR images of cereals for studying mass transfer processes. (i) The moisture content and its movement was investigated visually from series of image sequences, e.g. the brightness of the image is proportional to the proton density (Song et al., 1992). (ii) Graphs of pixel lines of MRI images at different drying times were used to follow the moisture increase or decrease during drying. These results are very difficult to build in the mathematical models of drying simulations. In this study moisture gradient vectors were calculated from the image subtractions in each pixel point, which provide a new method for evaluating the MRI images, since they give a mathematical description of the real moisture loss from whole kernels during drying.
5.2. BASIC THEORY OF MRI
The magnetic resonance phenomena occurs between atomic particles which possess a spin (e.g. hydrogen nucleus, 1H) and an external magnetic field. The spin itself creates a magnetic field that gives the nucleus a magnetic moment and it can be considered as a little compass magnet. In a strong magnetic field the protons align with the external field and precess at the Larmour frequency () given by:
(8) where is the gyromagnetic ratio [T-1s-1], and B0 is the magnetic field strength [T].
This linear relationship is the basis for locating nuclei in an object (Crooks, 1985).
Spatial information can be obtained by altering the magnetic field by superimposing a
linear field gradient, which results different field strengths across the specimen so the precession frequency () also differs from point to point.
A radio frequency pulse (RF) is applied which disturbs the alignment of the protons (resonance) into the transverse y-plane (perpendicular to the B0 field), and increases their energy level. There the rotating magnetization induces voltage in a receiver coil. After terminating the pulse the nuclei return to their equilibrium state dissipate absorbed energy and dephase coherent spins (relaxation). This signal is recorded and Fourier transformed to yield intensity versus frequency data (Clark et al., 1997).
In a standard imaging experiment employing a Hahn spin-echo pulse sequence (pulse sequence: adjusting RF pulses, gradients and timing the data acquisition) the signal intensity (S, relative units) at any point (pixel) in the image is given as:
) exp(
2 exp exp
2 1
2 1
1 T
T T
T T
T T N
S R E
E R H
(9)
where: TE [ms], echo-time the time between the radio frequency pulse and formation of the signal; TR [ms], repetition time between pulse sequences. NH is the proton density; T1 [ms] and T2 [ms] are sample-dependent parameters, describing the longitudinal and transverse relaxation times, respectively. Pure spin (proton) density images can be obtained by choosing the parameters TR 5·T1 (Smith, 1985 and Song et al., 1992) and TE << T2 (Clark et al., 1997).
In practice, because of limitations in data acquisition time (TR < 5·T1) the signal intensity is contributed by both proton density and T1 weighted images. However, according to Song et al. (1992) T1 (and T2, also) did not change significantly during drying, therefore the changes of the NMR signal intensity in the images were caused by the proton density changes (moisture loss).
The ability of an instrument to discriminate between signals and noise is usually expressed as a signal-to-noise ratio (SNR):
amplitude noise
average
amplitude signal
average
SNR (10)
An increase in SNR ratio usually indicates a reduction in noise and thus a more desirable measurement (Willard et al., 1988).
5.3. LITERATURE REVIEW
The factors responsible for the transport of moisture inside maize kernels during the drying process have not been fully determined which should be considered in constructing mathematical models (Weres and Jayas, 1994).
Several attempts have been made to determine the internal mass transfer of grain drying systems. Syarief et al. (1987) developed a procedure to determine the moisture diffusion coefficients of different components of maize kernels during drying. The mass transfer coefficients were calculated from measurements of water vapour pressures,
produced by evaporation, using small tubes attached to different parts at the uncovered surface of waxed kernels. The highest moisture diffusion found from the germ, it was lower from the floury and horny endosperm and lowest from the pericarp.
Water penetration movement of individual wheat kernels was studied during soaking by an autoradiographic method (Stenvert and Kingswood, 1976). The grains were sectioned with microtome and the half kernels were placed in a striping film. A rapid water movement was applied in the germ and smaller in the dorsal and central crease regions.
These methods are inherently damaging to the kernels, and are thus inaccurate, altering the natural movement of water inside the grains. Nuclear magnetic resonance imaging (MRI) is a non-destructive and non-invasive technique that enables the moisture distribution inside intact kernels to be determined.
The fundamentals and the applications of MRI in food science were summarised in detail by McCarthy (1994). He found that the studies of measuring moisture movement with MRI had not provided any dramatic improvements in understanding of mass transfer in food materials. Pulsed proton NMR was used to estimate the moisture content of wheat (Brusewitz and Stone, 1987) and maize (Ratković, 1987). Jenner et al.
(1988) studied the movement of water in developing wheat grains with MRI microscopy.
Transient moisture profiles of ears of maize were examined during drying by Song and Litchfield (1988, 1990a and 1990b). The trends of moisture loss from different parts of maize kernels with cobs were determined from cross sections of the cobs. The drying time versus moisture content of selected image points were plotted so the drying rates from the chosen pixels might be followed.
Single maize kernels were studied during soaking using MRI (Ruan and Litchfield, 1992 and Ruan et al., 1992). The steeping was investigated with one-dimensional moisture (Ruan et al., 1992) or proton density (Ruan and Litchfield, 1992) profiles at a same line of maize images taken every half an hour.
Song et al. (1992) explained the MRI techniques and the structure of the maize kernel. A series of proton density images of one central slice were evaluated. The slices and their subtractions from the same points but at different drying time were displayed together. It was found that the moisture distribution in the kernels was not uniform, and also that the moisture loss of the parts differed during the drying process. Two primary transfer routes were found one through the pericarp and the other through the glandular layer (epithelium).
5.4. MATERIALS AND METHODS
5.4.1. MRI Parameters
The images were obtained using a Bruker AVANCE 300 MHz spectrometer equipped with a vertical bore magnet system having a 150 mm inner diameter and a microimaging accessory at a test laboratory of the Bruker Analytische Messtechnik GmbH in Rheinstetten, Germany. A standard Hanh spin-echo 3D pulse sequence was used to collect the data. The inner diameter of the radio frequency (RF) probe was 10
mm. The data matrix size was 1286416 with the field of view of 1688 mm. Thus, the resolution of one pixel was 0.1250.1250.5 mm. For the spin-echo experiment the repetition time was TR = 200 ms, the echo time TE = 2.08 ms. One acquisition was taken 7 min 48 s, which was somewhat a long acquisition time in combination with the dynamic drying process.
5.4.2. Drying Parameters
Yellow dent maize kernels hybrid (Helga, Pioneer) were glued to a capillary tube on the opposite side of the germ in the longitudinal direction, and hung in the middle of the RF coil. The kernels were allowed to dry out in the RF coil during the whole process, so the images could be compared. The drying air temperature was 45 ± 1°C and the air velocity was 1.4 m/s. The initial moisture content of the grains was 53.3%
on a dry basis measured by the oven method (with the unused grains) at 105°C for 24 hours.
5.4.3. Image Preparation
Every 30 minutes during drying an NMR image were taken from the maize kernel.
The acquired images were stored in 32 bit binary files. The following computations, namely filtering and equalisation methods, the image acquisition and subtraction, and the gradient vector calculation and visualisation were prepared with MATLAB 5.1 software. MATLAB computed the gradient of a function of two variables, F(x,y) defined as:
(11) and can be thought of as a collection of vectors pointing in the direction of increasing values of F. In our case F means the subtracted image matrix, and x and y are the co- ordinate of the pixels (iˆ and jˆ are unit vectors).
5.5. RESULTS
5.5.1. Measurement of T2 Values
Preliminary examinations were carried out to measure the transverse relaxation time, T2 of the different parts of maize grains, to be sure that these values are high enough to acquire not T2-weighted images instead of images corresponding to proton density. Figure 34 shows the decay of transverse relaxation time (TR = 2 s, image interval: 30 ms).
Figure 34. The rate of decay of transverse magnetisation Mx,y for calculating T2 relaxation time of different part of the examined kernel prior to drying.
The following equation was used to fit the curves to the measured points calculate T2 relaxation times (Holz, 1983):
2
- 0
,y eT
x M
M
(12)
where Mx,y is the transverse magnetization; M0 is the equilibrium magnetization to the x-y direction; and is the delay period in ms. Table 5 shows the relaxation times obtained which met the requirements of the proton density measurement (TE << T2).
Table 5. T2 values of different parts of the examined hybrid.
Component Scutellum Pericarp Endosperm
T2 value [ms] 21.95 13.93 9.07
5.5.2. MRI of a Maize Kernel during Drying
Figure 21 shows the schematic diagram of the main parts of a half-sectioned maize kernel. For comparison: Figure 35 is a NMR signal intensity image of an actual maize kernel before drying. The colourbar next to the image represents the signal intensity represented by the different colours: the higher the value, the higher is the proton density and so the moisture contents.
Figure 35. NMR image of a maize kernel.
The moisture distribution inside the kernel was not uniform. The lowest moisture content occurred in the floury endosperm. The moisture content was higher in the horny endosperm and higher still in the pericarp. The highest water content was detected in the scutellum.
This result agrees with the oven measurements of moisture content of the parts (Table 6), but not entirely with the examinations of Song et al. (1992). They found higher moisture content in the floury endospermium than in the horny endosperm.
Table 6. Initial moisture content of the components of a maize kernel measured by the oven method.
Components Scutellum Pericarp Horny
endosperm
Floury endosperm Moisture content, d.b.
[%] 92.9 65.0 26.9 24.4
Sixteen slices were taken from the maize kernel through its longitudinal axis in each acquisition time. The initial moisture distribution of the 16 slices of the MRI image of the kernel is shown in the Figure 36. The scutellum part is seen on the middle slices (slice 6 to 13), on slices 1 to 5 and 14 to 16 only the endosperm and hull are visible.
Figure 36. MRI signals from 16 slices of the examined kernels before drying. The co-ordinates represent the position of pixels.
The signal-to-noise ratio and its changing during measurements can be seen in Figure 37, the 60th horizontal slice of Figure 36. The signal is easily distinguishable from the noise, even after 270 minutes drying.
Figure 37. The 60th vertical line of the16 examined slices before and after 270 min drying showing the signal-to-noise ratio.
Therefore the SNR was enough high for the MRI tests as it can be seen in Table 7, too.
Table 7. The values of signal-to-noise ratio of the MRI measurements.
Average signal amplitude, S
Average noise amplitude, N
S i g n a l - t o - n o i s e ratio, SNR
Before drying 7.3967·107 8.3931·106 8.81
After 270 min
drying 5.9683·107 8.3634·106 7.14
The 9th slice was chosen to evaluate the moisture transfer during drying. Each step in Figure 38 represents 30 min drying of the selected slice, thus the last picture was taken after 270 min drying. It clearly shows that the highest moisture loss occurs from the endosperm close to the crown side of the kernel, while the pericarp remained wet around the endosperm (120…150 min drying). The moisture loss from the scutellum was the slowest, with the inner part of the scutellum remaining at high moisture content even after 270 min drying.
Figure 38. MRI images of one selected slice during the drying process. The colourbar represents signal intensities and the scale shows the pixels.
Figure 38. (continued) MRI images of one selected slice during the drying process.
Figure 38. (continued) NMRI images of one selected slice during the drying process.
Gradient vectors, calculated and visualised using Matlab, showed the moisture movement from each point of the pictures. Image subtraction was needed to compute the gradient vectors. Figure 39 shows the subtracted images of the first (before drying) and second (after 30 min of drying) pictures. In this case the colours mean moisture movement; positive values (more red colour intensity) represent moisture decrease and negative values (greater blue intensity) means moisture increase. The highest moisture decrease was detected in the scutellum close to the outer part of the germ and the pericarp. The moisture content did not decrease from each part. The water content of the epithelium (between the scutellum and endosperm) increased and there were spotty increases inside the endosperm and in the scutellum too, as the moisture began to move.