DOI: 10.1556/066.2019.48.1.9
LIQUORICE (GLYCYRRHIZA GLABRA L.) ROOT SHERBET (EXTRACT): MICROENCAPSULATION AND STORAGE STABILITY
B. BASYIGIT* and I. HAYOGLU
Food Engineering Department, Engineering Faculty, Harran University, 63300, Haliliye, Sanliurfa. Turkey (Received: 16 February 2018; accepted: 2 July 2018)
The objectives of this study were to produce microencapsulated liquorice root extract (LRE) and determine storage stability of the product obtained. Maltodextrin (MD) and gum arabic (GA) as wall material were used to produce microencapsulated LRE by spray drying technology. Ratio of MD to GA was determined by response surface methodology. Three parameters: microencapsulation yield (MY), microencapsulation effi ciency (ME), and Carr index as response were evaluated for optimization. MD emulsion was best for microencapsulation of LRE. Control emulsion was prepared without using any wall material. MD and control emulsions were stored for 6 months. Both preserved their bioactive and physical properties during storage. Total phenolic content (TPC) and antioxidant activity (AA) of MD and control emulsions ranged from 8.09–9.09 and 34.59–39.02 mg GAE/g (TPC); 44.78–51.27 and 136.13–171.08 mg TEAC/g (AA), respectively, during storage. Furthermore, moisture content, water activity, solubility, wettability, Carr index, and Hausner ratio of samples were found to vary between 1.54–3.12%, 0.16–0.32, 93.54–99.22%, 180–240 sec, 22.5–35.63, and 1.29–1.56, respectively, during storage. This study provides direct comparative data on properties of LRE powders produced without using wall material and microencapsulated using wall material by spray drying.
Keywords: liquorice, spray drying, maltodextrin, gum arabic, response surface methodology, storage stability
Liquorice root extract (LRE) as a traditional beverage is consumed widely in the summer in the southeast of Turkey. However, shelf life of LRE is only one day, as it has suitable conditions for growing microorganisms because of its low acidity and high water activity (ADAY et al., 2018). Therefore, some studies have been made in order to stabilize it.
Microencapsulation could be also an alternative technique to stabilize LRE. To this extent, although there are many techniques to produce samples with good quality, spray drying is the most commonly used microencapsulation technique due to its lower cost (FANG & BHANDARI, 2011). Wall material used in microencapsulation has also an important effect on quality of fi nal sample. Maltodextrin (MD) and gum arabic (GA) as wall material are widely used in microencapsulation carried out with spray drying as they ease spray drying, have good solubility, improve microencapsulation yield (MY) and microencapsulation effi ciency (ME) (TONON et al., 2009).
The aims of the study were to transform the extracts into soluble LRE by spray drying, to optimize ratio of MD to GA used in the microencapsulation, to extend shelf life of LRE by decreasing its moisture content and water activity, and to determine storage stability of microencapsulated LRE.
1. Materials and methods 1.1. Plant material
Liquorice root was purchased from a local market in Şanlıurfa city (Turkey). The root was dried in a place isolated from sunlight at room temperature. The dried root was packed in plastic bags at 4 °C until analysed.
1.2. Extraction process
Five grams of liquorice root was mixed with 50 ml of distilled water and for extraction was maintained at 60 ºC for 60 min in shaking water bath (Heat Tech 26 L, ThermoScientifi c).
After centrifugation (Model Nüve NF615, Ankara, Turkey) at 5000 r.p.m. for 5 min, the resulting supernatant was collected. The extraction procedure was made daily. Some properties of LRE are given in Table 1.
Table 1. Some properties of liquorice root extract used in microencapsulation Total phenolic
content (mg GAE/g)
Antioxidant activity (mg TEAC/g)
Colour parameters pH Total soluble
solids (°Brix) L*
(Lightness)
a*
(Redness)
b*
(Blueness)
10.2±1.3 65.9±17.9 18.06±0.8 0.51±0.0 1.16±0.1 9.4±0.0 4.0±0.1
GAE: gallic acid equivalent; TEAC: Trolox equivalent
For the extraction of surface phenolic content (SPC) (ZHANG et al., 2007), total phenolic content (TPC), and antioxidant activity (AA) (ICYER, 2012) from samples, 0.5 g was weighed into a vial. Ten millilitres of ethanol for SPC and distilled water for TPC and AA was added to this vial and this mixture was stirred for 5 min at room temperature. After centrifugation at 4000 r.p.m. for 5 min, the resulting supernatant was fi ltered through a 0.45 mm fi lter and analysed.
1.3. Preparation of infeed solutions and spray drying conditions
Simplex-Lattice design was used to determine optimum ratio of MD to GA. MY, ME, and Carr index were used as response. The ratio of MD to GA was selected as independent variable. Experiments were performed under the following conditions: the total soluble solid content of the extracts was initially 4.0±0.1 g/100 g, which was then adjusted to 16 g/100 g by adding MD or/and GA as wall material under continuous mixing with an Ultra-Turrax homogenizer (IKA-T18 Basic, Japan). The mixture with ratio of core to wall (1:3) was homogenized for 5 min. All feed emulsions for spray drying were prepared as 100 ml portion of mixture. Control emulsion was also prepared without using any wall material.
A laboratory scale spray dryer (Buchi-B290, Flawil, Switzerland) with chamber diameter of 16.5 cm and a chamber length of 60 cm was used for microencapsulation, and the inlet air temperature, outlet air temperature, pump rotation speed, and feeding rates were 140, 93±2.78 °C, 600 ml h–1, and 8 ml min–1, respectively.
1.4. Microencapsulation yield and microencapsulation effi ciency
MY (CAM et al., 2014) and ME (ZHANG et al., 2007) were calculated according to following equations:
The weight of fi nal product (g)
MY (%) = ______________________________ × 100 The weight of initial substances (g)
Total phenolics of fi nal product-Phenolics on fi nal product's surface ME (%) = _______________________ _________________________________ ×100
Total phenolics of fi nal product
1.5. Antioxidant activity, total phenolic content, and surface phenolic content
ABTS radical scavenging activity for AA (DAI et al., 2010) and Folin-Ciocalteu assay for SPC and TPC of samples (SINGLETON et al., 1999) were used. All measurements were performed in triplicate.
1.6. Moisture content and water activity
Moisture content was determined gravimetrically by the method of ICYER (2012), and water activity was measured by a water activity meter (HygroPalm AW1, Rotronic AG, Germany).
The experiment was repeated three times.
1.7. Wettability and solubility
Wettability and solubility were determined by the method of TURCHIULI and co-workers (2005) and CANO-CHAUCA and co-workers (2005), respectively. Analyses were carried out in triplicate.
1.8. Bulk and tapped density
For bulk and tapped density, 3 g of sample was placed into the measuring cylinder (25 ml) and the initial volume was recorded. After recording, the cylinder was manually tapped until reaching a constant volume with a fl at surface, and the fi nal volume was also recorded (TATAR
et al., 2014). All measurements were performed in triplicate, and they were calculated according to following equations:
Product's mass Bulk density (ρB) = ________________
Volume of product
Product's mass
Tapped density (ρT) = ____________________
Final volume of product
1.9. Hausner ratio and Carr index
Hausner ratio and Carr index were determined by the method of TURCHIULI and co-workers (2005). All measurements were performed in at least three replications and calculated by the formula below:
Hausner ratio = _____ρT ρB ρT – ρB Carr index = ________ × 100
ρT
where, ρT= the tapped density, ρB= the bulk density 1.10. Colour analysis
A colorimeter (Colour Quest XE, Reston, VA, USA) was used to measure the CIE L*
(lightness), a* (redness), and b* (yellowness) values. Analyses were carried out in at least three replications.
1.11. Storage stability
Samples were stored at room temperature in an incubator for 6 months and analysed on the days 1, 30, 60, 90, 120, 150, and 180 during storage.
1.12. Statistical analysis
Statistical analysis was performed using 22.0 SPSS (SPSS Inc., Chicago, USA) and the signifi cant differences at P<0.05 between means were determined by independent sample t test and one-way ANOVA using Tukey’s HSD test. Optimization in Simplex-Lattice design was performed using a statistical software (Design Expert 7.0.0, Stat-Ease Inc., Minneapolis, MN). Quadratic models were constructed from the experimental results.
2. Results and discussion
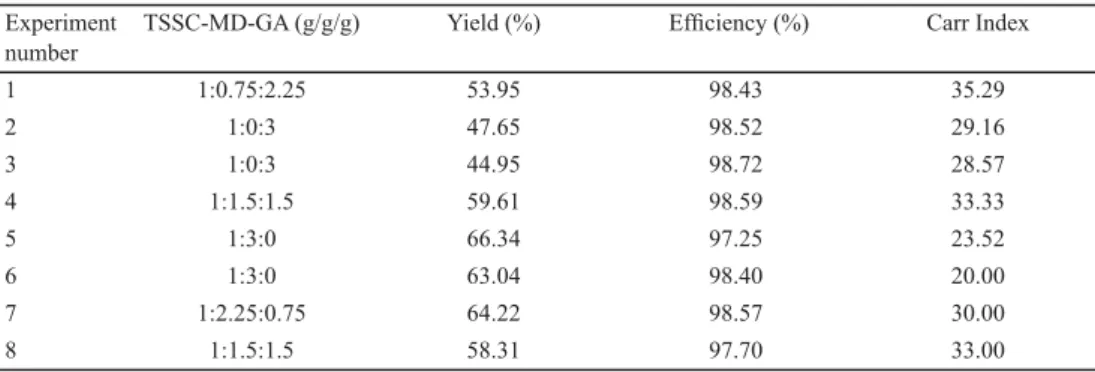
Simplex-Lattice design was used to perform optimum ratio of maltodextrin to gum arabic for microencapsulation of liquorice root extract. Simplex-Lattice design points and their results are presented in Table 2. The effect of the ratio of maltodextrin to gum arabic was statistically signifi cant (P<0.05) on microencapsulation yield and Carr index. The microencapsulated sample produced by using 100% maltodextrin had the best properties and a desirability value of 0.909. Regression equations of microencapsulation yield and Carr index were:
Microencapsulation yield =3.855×A+5.407×B+0.106×AB (R2=0.97) Carr index=2.427×A+1.808×B+0.232×AB (R2=0.94) where, A= maltodextrin, B= gum arabic
Table 2. Simplex-Lattice design points and their responses Experiment
number
TSSC-MD-GA (g/g/g) Yield (%) Effi ciency (%) Carr Index
1 1:0.75:2.25 53.95 98.43 35.29
2 1:0:3 47.65 98.52 29.16
3 1:0:3 44.95 98.72 28.57
4 1:1.5:1.5 59.61 98.59 33.33
5 1:3:0 66.34 97.25 23.52
6 1:3:0 63.04 98.40 20.00
7 1:2.25:0.75 64.22 98.57 30.00
8 1:1.5:1.5 58.31 97.70 33.00
TTSC: Total soluble solid content; MD: maltodextrin; GA: gum arabic
The emulsion was prepared with 100% maltodextrin, as it proved the best for microencapsulation according to the results obtained from Simplex-Lattice design to determine some properties of microencapsulated liquorice root extract during storage. The microencapsulation yield of maltodextrin and control emulsion was 78.29±4.31 and 64.04±2.81%, respectively, similar to those obtained by PAINI and co-workers (2015) (microencapsulation of phenolic compounds from olive pomace) comprised between 51–
94% and higher than those obtained by CAM and co-workers (2014) (microencapsulation of pomegranate peel phenolics) comprised between 39.50–50.50%. Furthermore, our results were more than 50% which is regarded as critical level for effi ciency drying (BHANDARI et al., 1997).
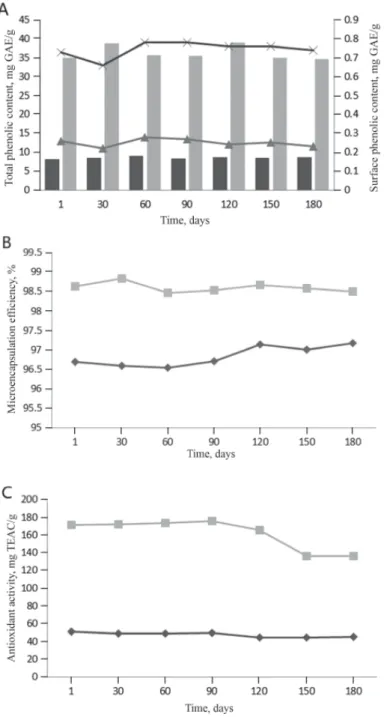
Changes in total phenolic content, surface phenolic content, microencapsulation effi ciency, and antioxidant activity of samples during storage are presented in Figure 1. No statistically signifi cant differences were observed among these parameters during storage.
This means that these samples could retain their physicochemical properties in the long run.
Total phenolic contents of maltodextrin and control emulsion were found to be in the ranges of 8.39–9.08 and 34.59–39.02 mg GAE/g, respectively. Total phenolic content of control emulsion was higher than that of the maltodextrin emulsion during storage. Initial antioxidant activity of maltodextrin and control emulsion was 51.27 and 171.08 mg TEAC/g, respectively.
The antioxidant activity of all samples decreased on the last day of storage. As expected, antioxidant activity of control emulsion, like total phenolic content, was higher than that of the maltodextrin emulsion, as none of the wall materials, including maltodextrin, are considered sources of bioactive substances. As expected, surface phenolic content of control emulsion (0.44–0.52 mg GAE/g) was also higher than that of the maltodextrin emulsion (0.22–0.28 mg GAE/g), as the product was produced without using any wall material provided protection of bioactive substances. However, it was surprising that microen- capsulation effi ciency of control emulsion (98.47–98.84%) was higher than that of the maltodextrin emulsion (96.54–97.18%). The results could be due to high total phenolic content of control emulsion. Furthermore, liquorice root contains starch and different gums behaving like a wall material, and these structures could also protect bioactive substances.
Due to lack of information about microencapsulation of liquorice root extract and its changes during storage, we have compared the results with those of other products, such as surface phenolic content (2.36–14 mg GAE/g) of sour cherry pomace (CILEK et al., 2012) and surface
Fig. 1. Changes in total phenolic content and surface phenolic content (A), microencapsulation effi ciency (B), and antioxidant activity (C) of samples during storage
Total phenolic content: 1:3:0 ;1:0:0 ; surface phenolic content: 1:3:0 ; 1:0:0 Microencapsulation effi ciency: 1:3:0 ; 1:0:0
Antioxidant activity: 1:3:0 ;1:0:0
1:3:0 and 1:0:0: ratio of total soluble solid content maltodextrin, and gum arabic; GA: gallic acid equivalent;
TEAC: Trolox equivalent antioxidant capacity
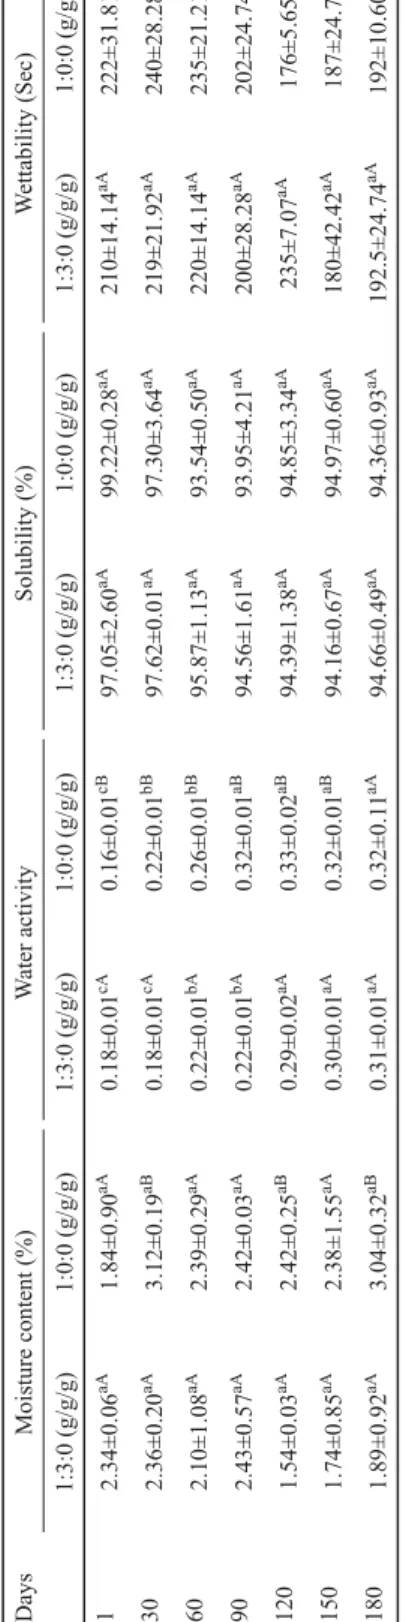
Table 3. Changes in moisture content, water activity, solubility, and wettability of samples during storage Moisture content (%)Water activitySolubility (%)Wettability (Sec) 1:3:0 (g/g/g)1:0:0 (g/g/g)1:3:0 (g/g/g)1:0:0 (g/g/g)1:3:0 (g/g/g)1:0:0 (g/g/g)1:3:0 (g/g/g)1:0:0 (g/g/g) 2.34±0.06aA1.84±0.90aA0.18±0.01cA0.16±0.01cB97.05±2.60aA99.22±0.28aA210±14.14aA222±31.81aA 2.36±0.20aA3.12±0.19aB0.18±0.01cA0.22±0.01bB97.62±0.01aA97.30±3.64aA219±21.92aA240±28.28aA 2.10±1.08aA2.39±0.29aA0.22±0.01bA0.26±0.01bB95.87±1.13aA93.54±0.50aA220±14.14aA235±21.21aA 2.43±0.57aA2.42±0.03aA0.22±0.01bA0.32±0.01aB94.56±1.61aA93.95±4.21aA200±28.28aA202±24.74aA 1.54±0.03aA2.42±0.25aB0.29±0.02aA0.33±0.02aB94.39±1.38aA94.85±3.34aA235±7.07aA176±5.65aB 1.74±0.85aA2.38±1.55aA0.30±0.01aA0.32±0.01aB94.16±0.67aA94.97±0.60aA180±42.42aA187±24.7aA 1.89±0.92aA3.04±0.32aB0.31±0.01aA0.32±0.11aA94.66±0.49aA94.36±0.93aA192.5±24.74aA192±10.60aA expressed as means ± standard deviation. Means within ferent letters (a–c) differ signifi cantly (P<0.05). Means within each row with different letters (A–B) differ signifi cantly (P<0.05) for each parameter.
As shown in Table 3, the moisture content of samples was lower than 5%, which is regarded as critical level for powder produced by spray drying technology (SANTANA et al., 2017). Furthermore, all samples preserved their moisture content during storage. However, this did not apply to water activity. This result indicated that a linear correlation is not always possible, although there is a general correlation between moisture content and water activity (BICUDO et al., 2015). Moreover, the water activity of samples increased on the last day of storage as amorphous wall materials converted to crystal form (BASTIOGLU et al., 2017).
However, all samples could be regarded as safe against microbiological and chemical hazards during storage as the water activity was less than 0.3 (BICUDO et al., 2015). The solubility of maltodextrin and control emulsion was found to be in the ranges of 94.16–97.62 and 93.54–
99.22 %, respectively, during storage. Moreover, the wettability of maltodextrin and control emulsion was found to vary in the ranges of 180–235 and 176–240 s, respectively. These results were in agreement with BERNSTEIN and NOREÑA (2015) (water activity and solubility), TONON and co-workers (2009) (moisture content, water activity, and solubility), CANO- CHAUCA and co-workers (2005) (solubility) while working with spray dried red cabbage anthocyanins, açai (Euterpe oleraceae Mart.), and mango juice, respectively.
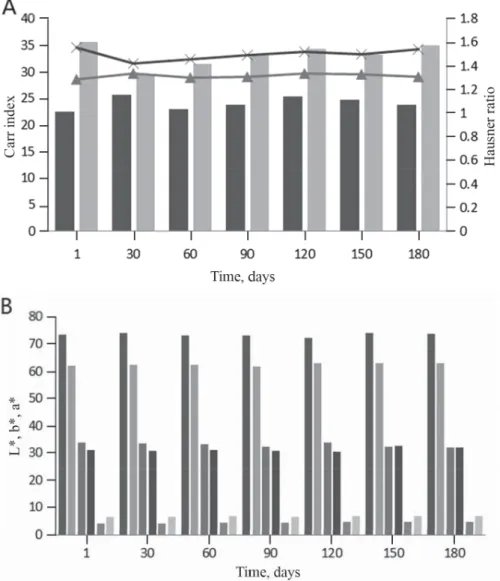
Carr index and Hausner ratio give information about fl owability of samples (TURCHIULI
et al., 2005). The lower the Carr index and the Hausner ratio, the higher the fl owability is. No statistically signifi cant differences were observed in fl owability of samples during storage (Fig. 2). The results indicate that all samples preserved their fl owability during storage. The Carr index and Hausner ratio of maltodextrin emulsion were found to be in the ranges of 22.5–25.65 and 1.29–1.34, respectively, during storage. These values for control emulsion were 29.51–35.63 and 1.42–1.56. The difference could be explained by particle size, van der Waals and electrostatic forces. The fl owability of our samples was higher than that of spray dried pitaya fruit (Carr index: 39.04–48.16; Hausner ratio: 1.64–1.93) (TZE et al., 2012).
These differences between results might be due to different parameters such as core material type, or ratio of core to wall.
Both of them preserved their stability in terms of colour during storage (Fig. 2). L* and a* values of maltodextrin emulsion were found to be in the ranges of 72.02–73.90 and 3.99–
4.64, respectively. These values for control emulsion were 61.79–63.08 and 6.37–6.76.
Furthermore, the b* value of the samples was not affected by the fact whether drying aid material was used or not. These results indicated that L* changed clearly depending on wall material compared to a* and b* values. Moreover, BERNSTEIN and NOREÑA (2015) reported that usage of maltodextrin as wall material had a low impact on colour of microencapsulated products. On the other hand, TZE and co-workers (2012) reported that there was a signifi cant correlation between core material and L* values.
Fig. 2. Changes in Carr index and Hausner ratio (A) and colour parameters (B) of samples during storage Carr index: 1:3:0 ; 1:0:0 ; Hausner ratio: 1:3:0; 1:0:0
L*: 1:3:0 ; 1:0: 0 ; b*: 1:3:0 ; 1: 0:0 ; a*: 1:3:0 ; 1:0:0 1:3:0 and 1:0:0: ratio of total soluble solid content, maltodextrin, and gum arabic
3. Conclusions
This study clearly showed that shelf life of liquorice root extract could be extended by pulverization. Furthermore, this product can be produced with or without a wall material as well. Future studies are necessary to produce microencapsulated liquorice root extract with other wall materials and to determine the exact shelf life of the product.
*
References
ADAY, S., PALA, Ç.U., ÇAM, B.A. & BULUT, S. (2018): Storage quality and microbiological safety of high pressure pasteurized liquorice root sherbet. LWT – Food Sci. Technol., 90, 613–619.
BASTIOĞLU, A.Z., KOÇ, M., YALÇIN, B., ERTEKIN, F.K. & ÖTLEŞ, S. (2017): Storage characteristics of microencapsulated extra virgin olive oil powder: Physical and chemical properties. J. Food Meas. Charact., 11(3), 1210–1226.
BERNSTEIN, A. & NOREÑA, C.P.Z. (2015): Encapsulation of red cabbage (Brassica oleracea L. var. capitata L. f. rubra) anthocyanins by spray drying using different encapsulating agents. Braz. Arch. Biol. Techn., 58, 944–952.
BHANDARI, B.R., DATTA, N., CROOKS, R., HOWES, T. & RIGBY, S. (1997): A semi-empirical approach to optimise the quantity of drying aids required to spray dry sugar-rich foods. Dry. Technol., 15, 2509–2525.
BICUDO, M.O.P., JÓ, J., OLIVEIRA, G.A.D., CHAIMSOHN, F.P., SIERAKOWSKI, M.R., FREITAS, R.A.D. & RIBANI, R.H.
(2015): Microencapsulation of juçara (Euterpe edulis M.) pulp by spray drying using different carriers and drying temperatures. Dry. Technol., 33, 153–161.
CAM, M., IÇYER, N.C. & ERDOǦAN, F. (2014): Pomegranate peel phenolics: Microencapsulation, storage stability and potential ingredient for functional food development. LWT – Food Sci. Technol., 55, 117–123.
CANO-CHAUCA, M., STRINGHETA, P.C., RAMOS, A.M. & CAL-VIDAL, J. (2005): Effect of carriers on the microstructure of mango powder obtained by spray drying and its functional characterization. Innov. Food Sci. Emerg., 6, 420–428.
CILEK, B., LUCA, A., HASIRCI, V., SAHIN, S. & SUMNU, G. (2012): Microencapsulation of phenolic compounds extracted from sour cherry pomace: effect of formulation, ultrasonication time and core to coating ratio. Eur. Food Res.
Technol., 235, 587–596.
DAI, J., ORSAT, V., VIJAYA RAGHAVAN, G.S. & YAYLAYAN, V. (2010): Investigation of various factors for the extraction of peppermint (Mentha piperita L.) leaves. J. Food Eng., 96, 540–543.
DINC, M., ASLAN, D., IÇYER, N.C. & CAM, M. (2012): Microencapsulation of gilaburu juice. Electron. J. Food Technol., 7(2), 1–11.
FANG, Z. & BHANDARI, B. (2011): Effect of spray drying and storage on the stability of bayberry polyphenols. Food Chem., 129, 1139–1147.
ICYER, N.C. (2012): Nar kabuğu fenolik bileşiklerinin su ile ekstraksiyonu ve ekstraktlarin mikroenkapsülasyonu (Extraction of pomegranate peel phenolics with water and microencapsulation of the extracts). Erciyes University, Turkey, MSc thesis, p. 90.
PAINI, M., ALIAKBARIAN, B., CASAZZA, A.A., LAGAZZO, A., BOTTER, R. & PEREGO, P. (2015): Microencapsulation of phenolic compounds from olive pomace using spray drying: A study of operative parameters. LWT – Food Sci.
Technol., 62, 177–186.
SANTANA, A.A., MARTIN, L.G.P., DE OLIVEIRA, R.A., KUROZAWA, L.E. & PARK, K.J. (2017): Spray drying of babassu coconut milk using different carrier agents. Dry. Technol., 35(1), 76–87.
SINGLETON, V.L., ORTHOFER, R. & LAMUELA-RAVENTÓS, R.M. (1999): Analysis of total phenols and other oxidation substrates and antioxidants by means of Folin-Ciocalteu reagent. Methods Enzymol., 299, 152–178.
TATAR, F., TUNÇ, M.T., DERVISOGLU, M., CEKMECELIOGLU, D. & KAHYAOGLU, T. (2014): Evaluation of hemicellulose as a coating material with gum arabic for food microencapsulation. Food Res. Int., 57, 168–175.
TONON, R.V., BRABET, C., PALLET, D., BRAT, P. & HUBINGER, M.D. (2009): Physicochemical and morphological characterisation of açai (Euterpe oleraceae Mart.) powder produced with different carrier agents. Int. J. Food Sci. Tech., 44, 1950–1958.
TURCHIULI, C., FUCHS, M., BOHIN, M., CUVELIER, E., ORDONNAUD, C., PEYRAT-MAILLARD, M.N. & DUMOULIN, E. (2005):
Oil encapsulation by spray drying and fl uidised bed agglomeration. Innov. Food Sci. Emerg., 6, 29–35.
TZE, N.L., HAN, C.P., YUSOF, Y.A., LING, C.N., TALIB, R.A., TAIP, F.S. & AZIZ, M.G. (2012): Physicochemical and nutritional properties of spray-dried pitaya fruit powder as natural colorant. Food Sci. Biotechnol., 21, 675–
682.
ZHANG, L., MOU, D. & DU, Y. (2007): Procyanidins: Extraction and microencapsulation. J. Sci. Food Agr., 87, 2192–2197.