SIMULATIONS OF THEORETICAL ECOSYSTEM GROWTH MODEL (TEGM) DURING VARIOUS CLIMATE CONDITIONS
Á.DRÉGELYI-KISS1 –L.HUFNAGEL2*
1 Budapest Tech, Bánki Donát Faculty of Mechanical Engineering H-1081 Budapest, Népszínház u. 8., Hungary
(phone: +36-1-666-5332; fax: +36-1-666-5480)
2Corvinus University of Budapest, Department of Mathematics and Informatics H-1118 Budapest, Villányi út 29-43., Hungary
(phone: +36-1-482-6261; fax: +36-1-466-9273)
*Corresponding author e-mail: leventehufnagel@gmail.com
(Received 2nd February, 2009 ; accepted 6th July 2009)
Abstract. Climate change has a great impact on the build and the work of natural ecosystems.
Disappearance of some population or growth of the number in some species can be already caused by little change in temperature. A Theoretical Ecosystem Growth Model was investigated in order to examine the effects of various climate patterns on the ecological equilibrium. The answers of the ecosystems which are given to the climate change could be described by means of global climate modelling and dynamic vegetation models. The examination of the operation of the ecosystems is only possible in huge centres on supercomputers because of the number and the complexity of the calculation.
The number of the calculation could be decreased to the level of a PC by considering the temperature and the reproduction during the modelling of a theoretical ecosystem and several important theoretical questions could be answered.
Keywords: climate modelling, ecosystem, climate change, theoretical ecological model
Introduction
The important community-ecological researches have three main approaches related to methodology considering the climate change. The ecologists working in the fields observing the real natural processes have aspired to take the fewest possible interferences to their processes (Spellerberg, 1991). The aim is to describe the community ecological patterns unbiased (Juhász-Nagy P.).
The other school of ecological researches examines hypothesises about the natural processes. The basis of these researches is to test the differential prediction in manipulative trials (Précsényi, I, 1995). The third part of ecologists deals with modelling where a precise mathematical model is made for basic and simple rules of the examined phenomena.
The work of the modelling ecologists consists of two parts. The first is to test the mathematical model with case studies and the second is to develop (repair and fit again) the model. Nowadays these available models are far away from the observations of field ecologists.
It is obvious that all the three approximations have advantages and disadvantages.
There are two approaches: monitoring and hypothetic central approximations. In the course of monitoring approaches the main purpose is to discover the relationships and patterns among empirical data. This is a multi dimensional problem where the tools of the biomathematics and statistics are necessary. The data are originated from large
monitoring systems (e.g. national light trap network, Long Term Ecological Research (LTER)).
There are hypothetical central facts where the known or assumed relationships mean the starting point. There are three types of the researches in this case:
• Testing simple hypotheses with laboratory or field experiments (e.g. fitotron plant growing room)
• Analyzing given ecosystems with tactical models (e.g. local case studies, vegetation models, food net models, models of biogeochemical cycles) (Fischlin et al., 2007; Sipkay et al., 2008; Vadadi-Fülöp et al., 2008)
• Examination of general questions with strategic modelling (e.g. competition and prediction models, cell-automats, evolutionary-ecological models)
Our aim is to analyze the effect of some temperature climate-patterns to the production and common-ecological relations in a strongly simplified theoretical model.
There is an important task is to save and protect the biodiversity beside climate change. It is generally can be said that the living beings do not react uniformly on the change in their environment. During the history of the Earth the climate changes have great impact on the composition of the flora and the fauna. The decrease in biodiversity is caused by a decrease in the number of species.
There is an important task is to research the relationship between the biodiversity and climate change. Our aim is to analyze the effect of some climate-patterns to the production and diversity with a strongly simplified theoretical model (TEGM).
Material and methods
Theoretical Ecosystem Growth Model (TEGM)
During our examinations the behaviour of a theoretical ecosystem is studied on various changing of the temperature. The simulation was made by Excel with simple mathematical background. An algae community in a terrestrial freshwater ecosystem is modelled by the theoretical ecosystem.
The algae species are characterized by the temperature interval in which the given species are able to reproduce. This reproductive feature depends on their temperature sensitivity. There are four types of species related to their sensitivity: super-generalists (SG), generalists (G), transitional species (T) and specialists (S). The temperature- optimum curve is originated from the normal- (Gaussian-) distribution, where the expected value is the temperature optimum. The dispersion depends on the niche- overlap among the species. The overlapping is set on a way where the results agree with the niche overlap of the lizard species studied by Pianka (1974) where the average of the total niche overlap decreases with the number of the lizard species.
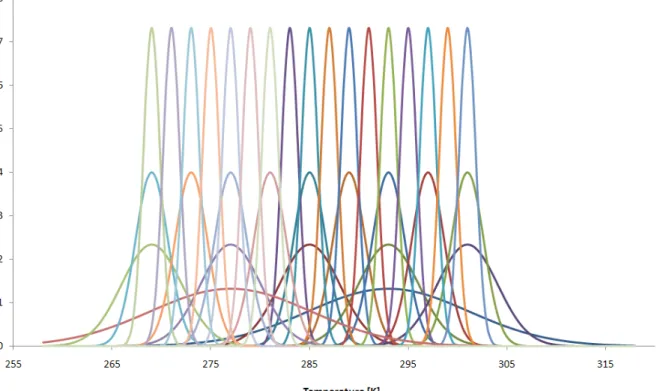
Niche overlap=(niche separation/ niche spread)=(µ1-µ2)/σ (Eq.1) The examined temperature range agrees with the temperature variation in the temperate zone. 33 algae species with various temperature-sensitivity can be seen in the 1st figure. The daily reproductive rate of the species can be seen on the vertical axis which means with how many times the number of specimens can increase on a given temperature. This corresponds to the reproductive ability of freshwater algae in temperate zone (Felföldi, 1981; Reynolds, 2006; Sipkay et al., 2007).
Figure 1. Reproductive temperature pattern of 33 algae species
The 33 species are described by the Gaussian distribution with the following parameters:
• 2 super-generalists (µSG1=277 K; µSG2=293 K; σSG=8.1)
• 5 generalists (µG1=269 K; µG2=277 K; µG3=285 K; µG4=293 K; µG5=301 K;
σG=3.1)
• 9 transitional species (µT1=269 K; µT2=273 K; µT3=277 K; µT4=281 K; µT5=285 K; µT6=289 K; µT7=293 K; µT8=297 K; µT9=301K; σT=1.66)
• 17 specialists (µS1=269 K; µS2=271 K; µS3=273 K; µS4=275 K; µS5=277 K;
µS6=279 K; µS7=281 K; µS8=283 K; µS9=285 K; µS10=287 K; µS11=289 K;
µS12=291 K; µS13=293 K; µS14=295 K; µS15=297 K; µS16=299 K; µS17=301 K;
σS=0.85).
Since the reproductive ability is given the daily number of specimens related to the daily average temperature is definitely determinable. We suppose 0.01 number of specimens for every species as starting value and the following minimum function describes the change in the number of specimens:
( )
Xi 1 =0.01N for every i=1,2, …, 33 species, where N(Xi): the number of specimens of the ith species
( ) ( ) ( )
( )
01 , 0 1 ;
33 1 1
+
− ⋅
=
∑
− =
r
Kj i N Xi
j a Xi RR j Min
Xi j N Xi N
ν
, (Eq.2)
where
j :is the number of the days (normally j=1,2,…,3655)
RR(Xi)j: is the reproductive rate of the Xi species on the jth day a=8
ν=0.8
r: is the velocity parameter (r=1 or 0.1)
(
2 3)
4 100000 () 500001⋅sin ⋅ + + + ⋅ −
=d d k d d Rnd
Kj , this is the restrictive function of
reaching the sunlight.
k=1,2,…,366 , this is the sequential number of the given year (year-day) d1=4950000, d2=0,0172, d3=1,4045, d4=5049998
The constant values of the Kj restrictive function is set in a way where the period of the function is 365.25, the maximum place is on 23rd June and the minimum place is on 22nd December.(These are the most and the least sunny days.)
In our researches the distribution of the algae community of a theoretical freshwater ecosystem is examined under changing the temperature. Rivalry begins among the species with the change of temperature. In every temperature there are dominant species who win the competition. The temperature was changed according to plan in order to estimate the various effects separately. The duration of the simulation was usually 10 year in the experiments. Two experiment series were run related to the dual value of the velocity parameter.
The effect of the existing climate patterns (historical or future daily temperatures) was analyzed.. The daily average temperature data are periodic through years; therefore appropriate functions were made to describe the climate.
The output parameters of the experiments are annual complete number of species and the related Shannon diversity index.
Results
Historical data (Budapest, 1960-1990)
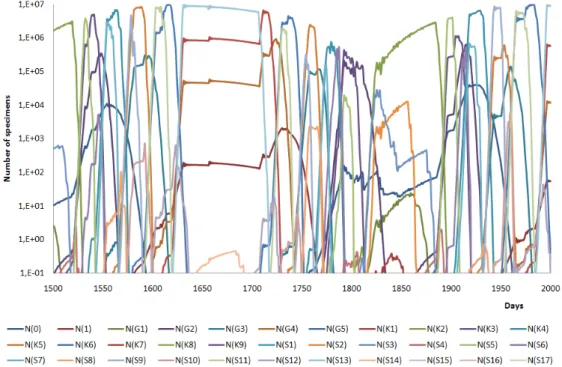
The equilibrium has been reached; the competition of the species can be seen in Fig.2-3. The faster ecosystem has a lot of specialists and some transient species. In summer there is stationer temperature therefore the slower and the faster ecosystems show quite similar picture (S13, T7, G4 and SG1 species), winter the K2 (light blue) species occurs.
Future (Budapest, 2070-2100)
According to the A2 scenario (HC adhfa) there is no optimum reproductive temperature for any species during the slower or the faster (Fig. 4.) processes. In winter there will be more species such as G2, T3, S5 and S6.
According to the B2 scenario (HC adhfd) the G5 species has optimum reproductive temperature in summer.
Comparing the Max Planck Institute (MPI) and the Hadley Centre (HC) predictions for 2100 it is stated that the seasons do not separate from each other related to the contents of the ecosystem.
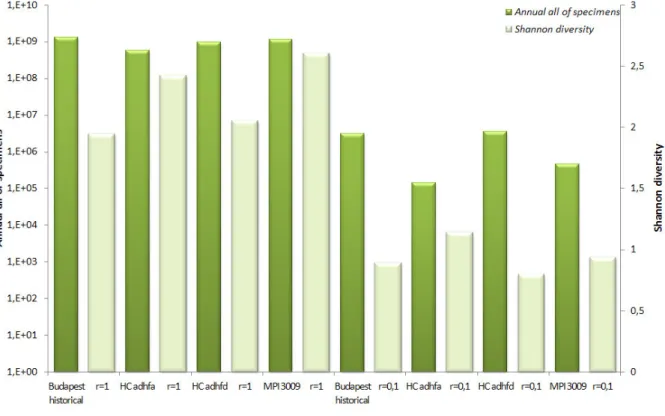
The Shannon diversity values for the various climate patterns can be seen in Fig. 5.
In the figure the number of all specimens are shown for the slower and the faster ecosystem.
Figure 2. Appereance of all species under historical climate of Budapest (1960-1990) between the 1500th and the 2000th day of simulation (velocity factor is equal to 1)
Figure 3. Appereance of all species under historical climate of Budapest (1960-1990) between the 1500th and the 2000th day of simulation (velocity factor is equal to 0.1)
Figure 4. Appereance of all species under future climate of Budapest (HC adhfa, 2070-2100) between the 1500th and the 2000th day of simulation (velocity factor is equal to 1)
Figure 5. Annual complete number of specimens and diversity in the course of various climate patterns
Conclusion
The number of all specimens in a year decreases for a given species in the future (estimated weather data series by 2070-2100, MPI 3009, HC adhfa and HC adhfd), the amount of decrease is different among the various results.
Regarding diversity the annual value of the Shannon index increases towards the future (in case of HC adhfa and MPI 3009 data series), but the HC adhfd prognosis shows the same pattern with the historical data (Budapest, 1960-1990). These processes are similar during the slower and the faster ecosystem. The diversity value of the slower process is the half of the faster’s.
Summary
In the course of our simulations has been shown what kind of effects are there in the composition and competition of an ecosystem with the change of temperature. The specialists reproducing in narrow temperature interval are dominant species in case of constant or slowly changing temperature pattern but these species disappear under small fluctuation in the temperature.
Comparing the Hungarian historical data with the regional predictions of huge climate centres (HC, MPI) it is stated that the newer estimations (such as HC adhfa, HC adhfd and MPI 3009) show a decrease in number of specimens in our theoretical ecosystem.
The ecosystems make an important role in the biosphere in development and maintenance of the equilibrium. Regarding the temperature patterns not only the climate environment affects the composition of ecosystems but the plants make a feedback to their milieu throughout the photosynthesis and respiration in the global carbon cycle.
The specimens of the ecosystems do not only suffer the change in climate but they could affect the equilibrium of the biosphere or the composition of the air through the biogeochemical cycles. There is an opportunity to examine the controlling ability of temperature-climate with the theoretical ecosystem.
In our further research we would like to examine the effect of the ecosystem back to the climate. These temperature feedbacks have got a great emphasis related to DGVM models with large computation skills (Friedlingstein et al., 2006), but the feedbacks are not estimated directly. We would like to examine the process of the feedback with PC calculations to answer easy questions.
Acknowledgements. This investigation was supported by the “Bolyai János” Research Fellowship (Hungarian Academy of Sciences) and the Research Assistant Fellowship Support (Corvinus University of Budapest).
REFERENCES
[1] Felföldy L (1981): A vizek környezettana. Általános hidrobiológia. – Mezőgazdasági Kiadó, Budapest [Water environmental sciences]
[2] Fischlin, A., Midgley, G.F., Price, J.T., Leemans, R., Gopal, B., Turley, C., Rounsevell, M.D.A., Dube, O.P., Tarazona, J., Velichko, A.A. (2007): Ecosystems, their properties, goods, and services. Climate Change 2007: Impacts, Adaptation and Vulnerability.
Contribution of Working Group II to the Fourth Assessment Report of the
Intergovernmental Panel on Climate Change, M.L. Parry, O.F. Canziani, J.P. Palutikof, P.J. van der Linden and C.E. Hanson, Eds. – Cambridge University Press, Cambridge, 211-272.
[3] Friedlingstein, P., Cox, P. M., Betts, R. A., Bopp, L., von Bloh, W., Brovkin, V., Cadule, P., Doney, S., Eby, M., Fung, I., Bala, G., John, J., Jones, C. D., Joos, F., Kato, T., Kawamiya, M., Knorr, W., Lindsay, K., Matthews, H. D., Raddatz, T., Rayner, P., Reick, C., Roeckner, E., Schnitzler, K. G., Schnur, R., Strassmann, K., Weaver, A. J., Yoshikawa, C., and Zeng, N. (2006): Climate-Carbon Cycle feedback analysis: Results from the C4MIP model incomparison. – J. Climate 19: 3337-3353
[4] Juhász-Nagy, P. (1984): Beszélgetések az ökológiáról. – Mezõgazdasági Kiadó, Budapest [Conversation about ecology]
[5] Juhász-Nagy, P. (1986): Egy operatív ökológia hiánya, szükséglete és feladatai. – Akadémiai Kiadó, Budapest, pp 251. [Absence, necessity and tasks of operation ecology]
[6] Juhász-Nagy, P. (1993): Az eltűnő sokféleség. (A bioszféra-kutatás egy központi kérdése) – Scientia Kiadó, Bp. [The missing biodiversity]
[7] Pianka, E. R. (1974): Niche overlap and diffuse competition. – Proc. Nat. Acad. Sci. USA 71(5): 2141-2145.
[8] Précsényi, I. (1995): Alapvető kutatásszervezési, statisztikai és projectértékelési módszerek a szupraindividuális biológiában. – KLTE, Debrecen [Basic research- organizational, statistical and project-valuation methods in supra-individual biology]
[9] Reynolds, C, (2006): Ecology of Phytoplankton – Cambridge University Press, Cambridge
[10] Sipkay, Cs., Hufnagel, L., Révész, A., Petrányi, G. (2007): Seasonal dynamics of an aquatic macroinvertebrate assembly (Hydrobiological case study of Lake Balaton No. 2).
– Applied Ecology and Environmental Research 5(2): 63-78
[11] Sipkay, Cs., Horváth, L., Nosek, J., Oertel, N., Vadadi-Fülöp, Cs., Farkas, E., Drégelyi- Kiss, Á., Hufnagel, L. (2008): Analysis of climate change scenarios based on modelling of the seasonal dynamics of a Danubian copepod species. – Applied Ecology and Environmental Research 6(4): 101-108
[12] Spellerberg, I.F. (1991): Monitoring ecological change. – Cambridge University Press, Cambridge
[13] Vadadi-Fülöp Cs., D. Türei, Cs. Sipkay, Cs. Verasztó, Á. Drégelyi-Kiss, L. Hufnagel (2008): Comparative assessment of climate change scenarios based on aquatic food web modelling. – Environmental Modeling and Assessment, DOI 10.1007/s10666-008-9158-2