Nyugat-magyarországi Egyetem
Kitaibel Pál Környezettudományi Doktori Iskola
„Biokörnyezet-tudomány” program
Analysis of forest-climate interactions, applying the regional climate model REMO
Az erd ı – klíma kölcsönhatás elemzése a REMO regionális klímamodell segítségével
DOKTORI (PhD) ÉRTEKEZÉS
Gálos Borbála
okl. környezetmérnök-tanár
Témavezetık:
Prof. Dr. Mátyás Csaba Prof. Dr. Jacob, Daniela
Sopron 2010
Analysis of forest-climate interactions, applying the regional climate model REMO
Az erd ı – klíma kölcsönhatás elemzése a REMO regionális klímamodell segítségével
értekezés doktori (PhD) fokozat elnyerése érdekében készült
a Nyugat-magyarországi EgyetemKitaibel Pál KörnyezettudományiDoktori Iskolája Biokörnyezet-tudomány programja keretében.
Írta:
Gálos Borbála
Témavezetık: Prof. Dr. Mátyás Csaba
Elfogadásra javaslom (igen / nem)
(aláírás) Prof. Dr. Jacob, Daniela
Elfogadásra javaslom (igen / nem)
(aláírás) A jelölt a doktori szigorlaton …... % -ot ért el,
Sopron, 2009. október 2.
a Szigorlati Bizottság elnöke Az értekezést bírálóként elfogadásra javaslom (igen /nem)
Elsı bíráló: Prof. Dr. Mika János igen /nem
(aláírás) Második bíráló: Dr. Gribovszki Zoltán igen /nem
(aláírás) (Esetleg harmadik bíráló (Dr. …...) igen /nem
(aláírás) A jelölt az értekezés nyilvános vitáján…...% - ot ért el
Sopron, ………..
a Bírálóbizottság elnöke A doktori (PhD) oklevél minısítése…...
………..
Az EDT elnöke
Contents
Abstract ... 6
Kivonat ... 6
1. Introduction ... 8
1.1 Background and objectives ... 8
1.2 Structure of the dissertation... 9
2. Climate change and forest-climate interactions ... 10
2.1 Climate change in Europe and in Hungary ... 10
2.1.1 Regional scale climate tendencies for Europe... 10
2.1.2 Projected climate change for Hungary ... 12
2.2 Droughts and their effects on the forest ecosystems in Hungary... 14
2.2.1 Definition and characteristics of droughts, drought indices... 14
2.2.2 Drought vulnerability of the xeric forest limit ... 17
2.3 Feedback of forests on climate... 20
2.3.1 Climatic role of forest ecosystems ... 20
2.3.2 Interception and its hydrologic role ... 23
2.3.3 Climatic effects of land cover change ... 27
2.4 Models as research tools for studying climate change ... 30
2.4.1 General aspects of climate modelling ... 30
2.4.2 Regional climate modelling ... 31
2.4.3 Land surface models... 34
2.5 Discussion and research needs ... 36
3. Objectives and research questions... 38
4. Data and methods... 39
4.1 Simulation of climate change and forest-climate interactions applying the regional climate model REMO in Hungary ... 39
4.1.1 The regional climate model REMO ... 39
4.1.2 Simulation of climate change and drought trends in Hungary... 45
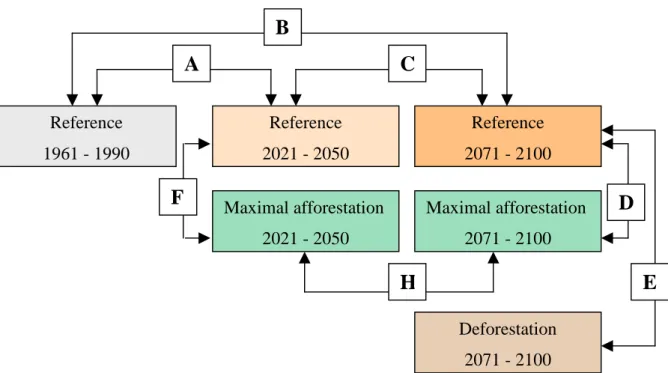
4.1.3 Simulation of feedback of forest cover change on the regional climate and the climate change altering effect of afforestation in Hungary ... 48
4.2 Measuring and modelling interception on local scale ... 55
4.2.1 The Hidegvíz-Valley forest hydrological research area... 55
4.2.2 The hydrologic model BROOK90 ... 56
4.2.3 Application of BROOK90 for interception in the Hidegvíz-Valley ... 59
5. Results ... 62
5.1 Climate change and drought frequency... 62
5.1.1 Validation of the regional climate model REMO for temperature, precipitation and droughts ... 62
5.1.2 Projected temperature and precipitation tendencies for the 21st century... 64
5.1.3 Probability and severity of droughts in the 21st century... 68
5.1.4 Spatial differences in the drought trends... 70
5.1.5 Summary ... 72
5.2 Feedback of forest cover change on the regional climate ... 73
5.2.1 Climatic effects of maximal afforestation and deforestation ... 73
5.2.2 Effect of maximal afforestation in the region characterised by the largest possible forest cover increase... 75
5.2.3 Interaction of the main climatic forcings of afforestation during the summer months ... 81
5.2.4 Climatic role of the potential afforestation survey... 83
5.2.5 Summary ... 84
5.3 Climate change altering effect of afforestation ... 85
5.3.1 Magnitude of the feedback of maximal afforestation on precipitation compared to the climate change signal ... 86
5.3.2 Effect of maximal afforestation on the probability and severity of droughts 87 5.3.3 Influence of the extent of the present forest cover on the projected climate change... 88
5.3.4 Comparison of the feedbacks of maximal afforestation on precipitation under moderate and enhanced climate change ... 89
5.3.5 Magnitude of the effects of deforestation compared to the climate change signal ... 90
5.3.6 Summary ... 91
5.4 Measuring and modelling of interception on local scale... 92
5.4.1 Adaptation and validation of the hydrologic model BROOK90 for interception in the Hidegvíz-Valley ... 92
5.4.2 Sensitivity of the simulated interception to the precipitation intensity ... 93
5.4.3 Summary ... 94
6. Discussion and Conclusions... 95
7. Outlook... 98
8. Theses of the dissertation... 100
Acknowledgements... 101
References ... 102
Annex... 114
Abstract
Forest-climate interactions have been investigated for Hungary in the 21st century, applying the regional climate model REMO. The projected tendency of temperature and precipitation means and the probability and severity of droughts have been analysed for summer, based on the results of IPCC-SRES1 emission scenario simulations (B1, A1B, A2). For the assessment of the biogeophysical feedbacks of forest cover change on the regional climate, REMO was driven by three different land cover change scenarios. At the end of the 21st century (2071- 2100), effects of maximal afforestation (forests over all vegetated area) and deforestation (forests replaced by grasslands) have been investigated for Hungary. For 2021-2025, the climatic influence of the potential afforestation survey has been studied.
Based on the simulation results, under enhanced climate change (2051-2100), the probability and severity of droughts can be significantly higher, the consecutive dry periods may last longer than in the second half of the 20th century. The simulated increase of the probability of extreme dry summers is largest in the southwest part of Hungary.
For the 21st century, maximal afforestation weakens the projected climate change signal by increasing evapotranspiration and precipitation and decreasing surface temperature over the whole country, for the whole summer period. This climate change weakening effect differs among regions. It is simulated to be the largest in the northeastern area (here, 50% of the projected precipitation decrease can be relieved), whereas the smallest in the southwestern part of the country. The potential afforestation has a very slight feedback on the regional climate compared to the maximal afforestation scenario.
How experiences from local-scale measurements and modelling of interception can contribute to a more detailed representation of forest-related hydrological processes in the regional climate model needs further investigations.
Kivonat
A disszertáció aszályos nyarak valószínőségének és szélsıségességének várható alakulását, valamint az erdıterület-változás lehetséges klímamódosító hatását elemzi, a REMO regionális klímamodell segítségével. A 21. századi éghajlati viszonyok becsléséhez különbözı IPCC- SRES1 kibocsátási forgatókönyveken (B1, A1B, A2) alapuló modellfuttatások eredményeit hasonlítja össze. A magyarországi erdık klimatikus értékét három felszínborítás-változási forgatókönyvre számszerősíti. A 2071-2100-as idıszakra vizsgálja, hogy a feltételezett maximális erdıtelepítéssel (minden növényzettel borított felszín erdı), valamint a hazai erdıterületek gyeppel történı helyettesítésével milyen irányban és mértékben befolyásolhatók az elırevetített hımérséklet- és csapadéktendenciák. A 2021-2025-ös periódusra a rossz adottságú és gyenge minıségő szántók helyére tervezett erdık regionális léptékő éghajlati hatásait elemzi.
A modellszimulációk eredményei alapján 21. század második felében mindhárom kibocsátási forgatókönyv esetén szignifikánsan megnıhet a száraz nyarak gyakorisága, szélsıségessége, akár minden második nyár aszályos lehet. Az összefüggı száraz periódusok hosszabbá válhatnak, mint a 20. század második felében. A melegedı-szárazodó tendencia az ország délnyugati részén a legnagyobb.
1 Intergovernmental Panel on Climate Change - Special Report on Emissions Scenarios
Az erdıterület változás, amennyiben nagy kiterjedéső, összefüggı területeket érint, hatással van a regionális klímára. A 21. század végén maximális erdıtelepítéssel az erıteljes szárazodó tendencia az ország egész területén jelentısen enyhíthetı. Az erdıterületek növekedésével a nyári hónapban az evapotranspiráció és a csapadékmennyiség növekszik, a felszínhımérséklet csökken, melynek nagysága régiónként eltérı. A REMO regionális klímamodell eredményei alapján a legnagyobb hatás az ország északkeleti részén várható, ahol maximális erdıtelepítéssel a klímaváltozással járó csapadékmennyiség-csökkenés fele kiegyenlíthetı. A délnyugati országrészben a legkisebb az erdısítés csapadéknövelı hatása. A gazdaságtalan szántók helyén potenciálisan megvalósítható, országos átlagban 7%-os erdıterület növekedésnek nincs jelentıs hatása a regionális éghajlati viszonyokra.
Az intercepció lokális szintő mérése és modellezése során szerzett tapasztalatok alkalmazhatóságának lehetısége a regionális klímamodell hidrológiai folyamatainak pontosabb leírásában további vizsgálatokat igényel.
1. Introduction
1.1 Background and objectives
Natural vegetation is a dynamic component of the climate system. Not only the distribution of vegetation is determined and limited by temperature and precipitation conditions, but also vegetation has an effect on the biogeophysical properties of the land surface, which plays a key role in determination of weather and climate.
Changes of the land cover due to climatic conditions and human influence feed back to the atmosphere, lead to the enhancement or reduction of the original climate change signal.
Forests, due to their larger leaf area and roughness length, lower albedo and deeper roots compared to other vegetated surfaces, affect the exchange of water, energy and momentum with the atmosphere. These processes are very complex and their variability is large both in time and space. Several papers have addressed the warming effect of boreal forests and the cooling and moistening effect of tropical forests. Most uncertain is the climatic effect of temperate forests, they can cool or warm the surface air temperature depending on the characteristic of the studied region. On local scale, the forest-related socio-economic and ecosystem services are well known. But recent studies have shown that the regional scale effects can differ from both the local and global scale tendencies.
Hungary has a special ecologic position on the border zone of closed forests and forest steppe (lower forest limit), which is especially vulnerable. The increase of drought frequency can lead to decrease of the forest cover across this region. This phenomenon is not typical in humid areas of the world.
In the last century, afforestation is started to increase and it is planned to continue also in the near future. Climatic effects of the possible reduction or the proposed increase of forest cover in Hungary for longer future time periods are still unknown. Information about the forest- climate interaction is essential not only for the sustainment of the ecological services of forest and for the assessment of their climate protecting effects, but also for the development of adaptation strategies in the next decades.
Therefore this study investigates the biogeophysical feedbacks of forest cover change
• on the regional climate,
• in the temperate zone, in a relative small region (Hungary),
• for the future (21st century).
To study forest-climate interactions for long time periods and to get information about climate change and tendency of climatic extremes, regional climate modelling is essential due to the relatively coarse resolution of recent general circulation models. For the simulation of the climatic feedbacks of forest cover change, forest-related processes of the investigated region have to be represented realistically in the climate model. This study is focusing on interception. To understand the processes of interception in a forest ecosystem more in detail, local scale measurements and modelling are essential. The aim is to point out the basic meteorological and stand characteristics connected to interception, which should be included also in a regional climate model for more detailed and appropriate representation of the effect of forests on the water and energy balance on fine horizontal resolution.
To analyse future climatic conditions and forest-climate interactions during summer month (May, June, July, August) in Hungary, research questions of the dissertation are ordered into four groups:
• Climate change and drought trends
• Feedback of forest cover change on the regional climate
• Climate change altering effect of afforestation
• Measuring and modelling of interception on local scale
1.2 Structure of the dissertation
The dissertation is organised as follows:
After the introduction (Chapter 1), an overview on the recent climate change studies is given in Chapter 2, with special focus on Europe and Hungary. This chapter also addresses the effects of droughts on the forest ecosystems and the basic properties of forests, through which they affect climate, with special attention on the role of interception in the hydrologic cycle. It is followed by an overview on the climatic feedback of land-use change for different scales and regions and the theoretical background of regional climate modelling. Afterwards, based on the recent researches introduced in Chapter 2, the relevance of this work is explained.
The research questions are described in Chapter 3. Regarding the aim of the present study, a more detailed introduction is given for the models, data and methods applied (Chapter 4). In Chapter 5 results of the regional and local scale simulations are presented and summarised.
Results are discussed, conclusions are drawn and the possibilities for the practical application are stressed in Chapter 6. Finally, suggestions are given for the improvement of the methods and further research needs are pointed out (Chapter 7). In Chapter 8, theses of the dissertation are presented.
2. Climate change and forest-climate interactions
2.1 Climate change in Europe and in Hungary
Global climate simulations show the increase of the global average air temperature, widespread changes of precipitation, the melting of glaciers and ice caps and the rise of the mean sea level for the 21st century (IPCC 2007). The climate projections are results of climate model simulations driven by predefined greenhouse gas emission scenarios (IPCC 2001), which are introduced in detail in Annex I. The difference between the simulated climatic conditions for the future and for the present time period is the climate change signal.
The climate change signal on regional scale is different from the global means. Numerous international research projects and scientific papers address climate change and its impacts on different spatial and temporal scales and sectors. Sect. 2.1.1 gives an overview of the future tendencies of temperature and precipitation means and extremes for Europe, while Sect 2.1.2 focuses on the expected changes in Hungary. In both sections, temporal and spatial distributions and differences are also discussed.
2.1.1 Regional scale climate tendencies for Europe
Temperature and precipitation means. There are several recent EU-projects2 carried out in the last decade, to predict climate change and its impacts in Europe for the 21st century. For the period 2021-2050 all regional climate models predict a quite robust (i.e. above the noise generated by the internal model variability and consistent across multiple climate models) surface warming in Central and Eastern Europe. The annual precipitation shows an increase in the Northeast and decrease in the Southwest regions. Around a neutral zone (Hungary, Rumania) precipitation changes are quite small.
At the end of the 21st century, a warming is expected in all seasons over Europe, which is stronger than in the first half of the 21st century. All models agree that the largest warming for summer is projected to occur in the Mediterranean region, Southern France and over the Iberian Peninsula. Less warming is projected over Scandinavia. For winter the maximum warming occurs in Eastern Europe (Giorgi et al. 2004, Christensen and Christensen 2007).
For precipitation, the largest increase is predicted in winter, whereas the decrease is the strongest in summer. Changes in the intermediate seasons (spring and autumn) are less pronounced.Results of the regional model simulations show a north-south gradient of annual precipitation changes over Europe, with positive changes in the north (especially in winter) and negative changes in the south (especially over the Mediterranean area in summer). The line of zero change moves with the seasons. This transition zone can be characterised by the largest spread between models (Christensen and Christensen 2007).
Spatial distribution of the projected temperature and precipitation changes in summer refers to a marked shift towards a warmer and drier climate for Southern and Central Europe (Vidale et al. 2007).
2 http://ensembles-eu.metoffice.com/, http://prudence.dmi.dk/, http://www.clavier-eu.org, http://www.cecilia- eu.org
Temperature and precipitation extremes. On the example of the temperatures the three basic cases of the changes of climatic means and extremes due to climate change are the following (IPCC 2001):
Figure 1. Schematic illustration of the effect on extreme temperatures when (a) the mean temperature increases, (b) the variance increases, and (c) when both the mean and variance increase for a normal
distribution of temperature (IPCC 2001, WG I. Fig. 2.32)
a) Increase in the mean temperature (figure 1a): warming occurs without changes in the temperature variability. The range between the hottest and coldest temperatures i.e. the shape of the probability density function remains the same, which refer to more hot and less cold extremes.
b) Increase in the variance of temperature (figure 1b): the mean temperature remains the same but its variability increases, which leads to more cold and more hot extremes.
c) Increase in the mean and variance of temperature (figure 1c): warming occurs together with increased probability of hot extremes and stagnant or decreased probability of cold extremes. The distribution function is wider and flatter and is shifted in the direction of higher temperatures.
Recent results from enhanced greenhouse-gas scenarios over Europe suggest that during the summer season the third case (figure 1c) might be valid. It means that not only the climatic means are changing, but there is also an increase in the inter-annual variability of the future temperature and precipitation values, which leads to higher probability of extremes compared to the present-day conditions (Schär et al 2004, Giorgi et al. 2004, Seneviratne et al. 2006, Kjellström et al. 2007, Vidale et al. 2007). In the frame of the STARDEX project3, numerous indices were defined to analyse the tendency of temperature and precipitation extremes for Europe. The STARDEX scenarios indicate increases/decreases in the frequency and intensity of hot/cold extremes, together with more spatially and seasonally variable changes in the occurrence of rainfall extremes. The increase in summer temperature variability projected for Central and Eastern Europe is influenced by both the soil-moisture–temperature feedback and the atmospheric circulation (Seneviratne et al. 2006).
3http://www.cru.uea.ac.uk/projects/stardex/reports/STARDEX_FINAL_REPORT.pdf
The considerable enhancement of inter-annual variability of the European summer climate as well as the changes of the hydrological cycle are often associated with higher risks of heat waves and extension of the length of dry spells. For 2071-2100 frequency, intensity and duration of heat waves are expected to increase over Europe. Especially the Mediterranean region might be affected by earlier and longer droughts (Beniston et al. 2007). In contrast, for parts of Scandinavia a reduction in length of summer droughts is projected. The intensification of the regional hydrological cycle can lead to shorter return times of heavy precipitation events (e.g. Christensen and Christensen 2003, Pal et al. 2004, Semmler and Jacob 2004). For summer, the number of days with intense precipitation is very likely to increase in the north-eastern European regions, which can result in severe flood episodes despite of the reduction the summer mean precipitation in the main part of the continent (Christensen and Christensen 2003, Beniston et al. 2007). The Central-Mediterranean and Central-Western Europe seem to be especially vulnerable to increases in both summer drought and flood (Pal et al. 2004).
2.1.2 Projected climate change for Hungary
Temperature and precipitation means. Based on the results of the CLAVIER project4, the projected increase of annual mean temperature in Hungary can be approximately 1.4°C for the period of 2021-2050 relative to 1961-1990 (Szépszó and Horányi 2008). For the precipitation, the country is situated around a neutral zone surrounded by increasing precipitation in the Northeast and decreasing precipitation in the Southwest. So the predicted changes of the annual precipitation are quite weak in this region. The spatial distribution of precipitation change shows that the reduction of the summer precipitation sum is the largest in the southern part of the country (Szépszó and Horányi 2008).
For the end of the 21st century, all participating regional climate models of the PRUDENCE project5 show a quite robust surface warming (Christensen 2005, Mika 2007). The largest temperature increase is expected in summer (4.5-5.1°C; figure 2), whereas the smallest warming is predicted for spring, compared to 1961-1990 (Bartholy et al. 2007). Climate change signal for temperature is largest in the southern and eastern areas. On daily time scale, both maximum and minimum temperatures can be higher. In summer the projected increase of daily maximum temperatures is larger than the warming of the daily minimums, which refers to larger daily temperature amplitudes (Bartholy et al. 2007).
°
Figure 2. Changes of the summer temperature mean (T; left) and precipitation sum (P; right) 2071-2100 vs. 1961-1990, A2 IPCC-SRES emission scenario (Annex I; Bartholy et al. 2007)
4 http://www.clavier-eu.org
5 http://prudence.dmi.dk
P [%]
T [°C]
The annual precipitation sum is not expected to change significantly, whereas its distribution is affected by climate change. Summer was the wettest season in the 20th century but it becomes the driest in case of A2 scenario (Annex I) and the driest winter tends to be the wettest (based on the results of the CLAVIER project, this tendency is also typical for the near future). In summer, the projected precipitation decrease is 24-33% for the A2 (figure 2) and 10-20% for the B2 scenario (Annex I). In winter, the expected precipitation increase is 23- 37% (A2) and 20-27% (B2). A slight precipitation increase in spring and a decrease in autumn are also expected (Bartholy et al. 2007). Depending on the season, magnitude of the climate change signals differ among regions. In northwest-Hungary drying of summers is the smallest while winter precipitation increase is the largest.
Temperature and precipitation extremes. For the 20th century several climate extreme indices have been analysed and compared for Hungary based on the guidelines suggested by the joint WMO-CCl/CLIVAR Working Group on climate change detection (Bartholy and Pongrácz 2007). Similarly to the global and continental trends (Klein Tank and Können 2003), for Central/Eastern Europe, strong increasing tendencies have been detected in case of the annual numbers of hot days, summer days, warm days, warm nights, and the heat wave duration index in the second half of the 20th century. Furthermore, intensity and frequency of extreme precipitation have increased, while the total precipitation amount has decreased (Bartholy and Pongrácz 2007).
For 2021-2050, all simulation results of the CLAVIER project agree on increasing numbers of tropical nights and decreasing numbers of frost days. The projected changes of the maximum number of consecutive dry days show a relatively clear annual cycle with decreasing maximum lengths of dry periods for winter and increasing maximum lengths of dry periods for spring, summer, and partly also for autumn.
For 2071-2100, this tendency is projected to continue under enhanced greenhouse gas concentrations. The frequencies of warm extremes (i.e. heat waves, hot periods, hot days) are expected to increase and the probability of cold extremes (i.e. frost days, cold days) is projected to decrease compared to 1961-1990. The number of days with precipitation could slightly decrease in Hungary, whereas days with heavy precipitation are expected to occur more often (Szépszó 2008).
For summer, the strong warming and drying can lead to the increased probability of severe droughts (Mika 1988, 2007, Bartholy et al. 2007). The larger amount of precipitation in March and April can result in high water level in the main rivers (Radvánszky and Jacob 2009). In the frame of the EU project CLAVIER, possible ecological and economical impacts of climate change have been evaluated more in detail. The clear impacts of climate change on water management, extreme events, natural ecosystems, human health and infrastructure underline the importance of the analyses of regional scale climate projections for the affected regions and sectors.
2.2 Droughts and their effects on the forest ecosystems in Hungary
2.2.1 Definition and characteristics of droughts, drought indices
Droughts are very complex natural disasters, many parameters are responsible for their occurrence (e.g. atmospheric circulation, precipitation, temperature, humidity, soil moisture).
Contrary to other extreme meteorological events (flood, tornado, hurricane, hailstorm, frost), droughts are the most slowly developing ones, have the longest duration and the affected area is the largest. Beginning, end, probability and intensity of droughts are the least predictable among the atmospheric hazards (Pálfai 1994, Bussay et al. 1999, Jankó Szép et al. 2005, Dunkel 2009).
There is no general definition for droughts, it varies depending on the climate, soil and vegetation conditions of the region. Commonly used definitions are meteorological, agricultural, hydrological and socio-economic (Wilhite and Glantz 1985, Bussay et al. 1999).
All these approaches seem to agree that droughts are caused by the precipitation deficit during a long time period. Figure 3 summarises the sequence of the most important processes related to droughts.
Figure 3. Sequence of droughts (modified after NDMC6)
Meteorological droughts develop, if the precipitation deficiency is large, relative to the long term mean of the analysed region. Other climatic factors such as high temperature, high wind and low relative humidity can significantly increase severity. Definitions of meteorological drought are region specific since the atmospheric conditions that result in deficiencies of precipitation are highly variable among regions.
Agricultural droughts occur if precipitation shortage causes soil moisture deficits. Available soil moisture can be also reduced by the increased evapotranspiration due to higher saturation deficit of air, which is induced by the higher temperature (Figure 3). The high potential evapotranspiration rate and/or the lack of available soil moisture leads to water stress of plants, reduced photosynthetic activity and crop production, or in extreme cases to mortality
6 http://www.drought.unl.edu/
(Szász 1988, Vig 2002, Bréda et al. 2006). For forests, available precipitation and soil moisture are the most important factor in the growing season. In the absence of winter precipitation, the soil does not fill up with water, which can induce earlier and much more severe summer droughts (Vig 2002).
Hydrological droughts are associated with the effects of precipitation deficiency on surface or subsurface water supply. They usually occur later than meteorological and agricultural droughts since it takes longer for precipitation deficiencies to show up in components of the hydrological system such as soil moisture, streamflow, and ground water and reservoir levels7. Although climate is a primary contributor to hydrological droughts, physical soil properties or changes in land use (e.g. deforestation) can affect their frequency and severity via altering the infiltration and runoff rates.
Characteristics of droughts. Droughts can be characterised by frequency, duration and severity. Frequency gives information about the number of occurrences in the investigated time period. The longer duration increases the impacts of droughts. Severity can be described by the magnitude of the precipitation and soil moisture deficits as well as of the environmental impacts. The most severe droughts develop, if large precipitation deficit occurs together with extremely high temperatures.
Drought as abiotic stress. The increased probability and severity of climatic extremes through climate change as well as the abrupt changes of the meteorological parameters lead to stress in vegetation. Changes of the extremes challenge the adaptability much more than the slow changes of the climatic means. Therefore these extremes are important limiting factors of the vegetation distribution. Response to water stress depends on the severity and duration of droughts as well as on the resilience, the adaptive and reproductive capacity of the plant species (Láng 2002). Severe drought as abiotic stress can lead to further biotic and abiotic damages, which will be discussed in Sect. 2.2.2 more in detail.
Drought indices
Severity and spatial extent of droughts can be investigated using several indices and functions, analysing satellite images or calculating the hydrologic water balance. Numerous studies deal with the review, characterization and classification of the drought indices (e.g.
Tuhkanen 1980, Bussay et al. 1999, Maracchi 2000, Dunkel 2009). They are classified mostly based on their complexity or input parameters, the precipitation, temperature, evapotranspiration and soil moisture conditions. Many of them are suitable only in special circumstances or for special plant species. Therefore the application of these indices for other regions or species as well as the spatial comparison of the results are limited.
In this section an overview about indices is given, with focus on the commonly used ones in the agricultural and forestry sectors and which will be referred to in the later investigations.
Indices of precipitation anomalies provide information about the meteorological drought by calculation of the deviation from a normal precipitation value. These are the simplest drought indices that need only precipitation as input parameter. The relative precipitation anomaly index, which will be also used in the present work allows the spatial and temporal comparison of droughts.
7 http://www.drought.unl.edu/
It can be calculated as
100 P *
P P−
(1)
where P [mm] is the precipitation sum in the investigated time period and P [mm] is the long term climatic mean of precipitation.
The Standardized Precipitation Index (SPI; McKee et al. 1993) was the first index, which could be applied to quantify the precipitation deficit for multiple time scales. SPI is well suitable for analysis of the duration and severity of agricultural and hydrological droughts over Europe (Bussay et al. 1999, Szalai and Szinell 2000, Lloyd-Hughes and Saunders 2002), since it shows a strong correlation with the discharge and the groundwater level.
The other very commonly used and accepted index is the Palmer drought severity index (PDSI; Palmer 1965). It considers monthly precipitation, evapotranspiration, and soil moisture conditions to measure the departure of the moisture supply. Using the PDSI, the comparisons of soil moisture content and severity of droughts between months and between regions with different climate are possible (Dunkel 2009).
The Pálfai Drought Index: PAI (Pálfai et al. 1999) is suitable under Hungarian climate conditions to characterize the severity of droughts. Additionally to the precipitation and temperature conditions, the ground water level is considered.
Aridity indices describe the relation of the energy and water budgets. They are used to characterize agricultural and hydrological droughts and the climatic limits of the distribution of the ecosystems. The simplest indices give information about the aridity (or humidity) of the region or time period determining the ratio of the precipitation to potential evapotranspiration (Varga-Haszonits 1987).
Index based on remotely sensed parameters. In practice, the normalized difference vegetation index (NDVI) is often used as drought index since stress induced by water shortage results in altered spectral reflectance of vegetation (Wilhite and Glantz 1985).
The commonly used drought indices are not sufficient to represent drought conditions for forests, because drought sensitivity and tolerance of these ecosystems are different from agricultural plants. For application in the forestry, forestry aridity indices have been developed considering temperature and precipitation weighted for the month, in which these climatic conditions are especially important for the growth and production. In most of these indices soil moisture content is also taken into account.
The Ellenberg-index (EQ; Ellenberg 1988) is commonly applied to model the distribution of zonal tree species (e.g. beech, Fagus sylvatica, L.; hornbeam, Carpinus betulus L.; sessile oak, Quercus petraea L.) over Europe (Standovár and Kerekes 2003, Jensen et al. 2004, Franke and Köstner 2007, Czúcz et al. 2010). It can be calculated based on the annual precipitation sum (Pann [mm]) and the temperature mean in July (TVII [°C]) as
1000
. *
ann VII
P
EQ=T (2)
To describe the drought tolerance limit of beech in Hungary, a beech tolerance index (TIB) has been developed (Berki et al. 2007). Considering the weighted precipitation sum and temperature mean for summer, the index corresponds to the special climatic needs of this tree
species. Under a critical threshold value, drought leads to mortality of beech. TIB can be determined as
3 / ) (
* 8 , 0
* 5 , 0
* 2 , 0
. . .
. .
. . . .
VIII VII VI
VIII VII
VI V IV III
B T T T
P P
P P P TI P
+ +
+ + + +
= + (3)
where P [mm] is the precipitation sum and T [°C] is the temperature mean for the certain months. TIB is also suitable to investigate the changes of beech distribution due to the increased drought probability projected for the future.
Contrary to the TIB, the forestry drought index (FAI; Führer and Járó (2000) is primary designed to simulate the effect of drought on the production. It can be applied also for other zonal tree species. The FAI be calculated as
*100
. .
. .
VIII VII VII V
VIII VII
P P
FAI T
−
−
+−
= (4)
where P [mm] is the precipitation sum and T [°C] is the temperature mean for the corresponding months. Physiological water stress in forest-hydrology models is commonly described by the ratio of the actual and potential transpiration (Federer et al. 2003, Zierl 2007).
2.2.2 Drought vulnerability of the xeric forest limit
The xeric limit concept
For all zonal tree species the lower limits of distribution are ecologically very important. This limit is called xeric forest limit, which may be defined as “low altitude and low latitude limits of species distribution areas along a moisture balance gradient” (Mátyás et al. 2009, Mátyás 2010). It extends along the forest steppe and woodland ecotones of the Mediterranean, Southeast Europe, South Siberia and North America.
Whereas the upper forest limit is determined by the temperature conditions (called thermal limit), on the lower margin, presence of forests is primary limited by the climatic aridity (Mátyás 2009). Here, extent of the climatically suitable area of the certain tree species is determined by the frequency, severity and duration of droughts rather than by the climatic means. Small increase of the frequency of extremes can lead to drastic effects (growth decline or mortality of forests) in these regions (Mátyás et al. 2008). Therefore the study of long-term tendencies of droughts at the xeric limit becomes even more important with the projected climate change.
Hungary has special climatic conditions regarding forest vegetation zonation. Here, many of the zonal tree species have their lower limit of distribution, which are especially sensitive and vulnerable to the consecutive and severe dry periods.
Drought trends in Hungary in the 20th century and its effects on the xeric limit
Droughts are a recurrent feature in Hungary’s climate (Szinell et al. 1998). Due to the high annual variability of precipitation the relatively dry and warm weather events have a very high probability in this country.
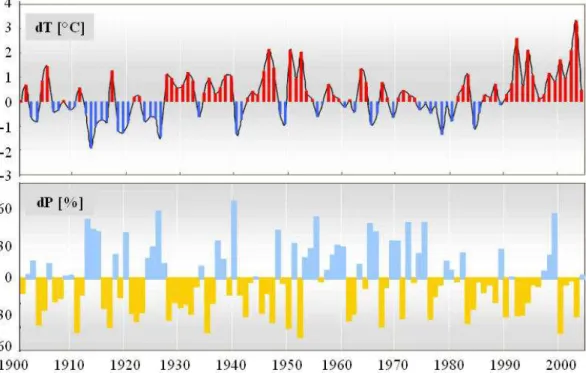
Similar to global and continental trends, annual mean temperatures became higher during the second half of the 20th century, in particular, summers were warmer in the last 15 years (1990–2004) compared to the climate period 1961-1990 (figure 4). Precipitation decreased in the last century, the strongest negative trend appeared in spring (Szalai et al. 2005). The number of days with precipitation of more than 1mm decreased, whereas the intensity of precipitation events increased, leading to severe droughts and floods (Bartholy and Pongrácz 2007).
At the end of the 20th century a significant increase in drought frequency has been observed.
Between 1983 and 1994, a continuous, extraordinarily dry period with severe droughts occurred in the Carpathian Basin (figure 4). Based on the Pálfai Drought Index (PAI) the Great Plane was the most affected region (Pálfai 1994). The PDSI values showed also a decrease, which refers to dryer conditions especially in the East Hungarian regions (Szinell et al. 1998, Bussay et al. 1999). The higher temperatures and the lower amount of precipitation led to decrease of the soil moisture content (Jankó Szép et al. 2005 Makra et al. 2002). This tendency seemed to continue in the first years of the 21st century. Impacts of droughts depend also on the sensitivity and vulnerability of the affected system. Bella et al. (2005) developed a method to define the drought vulnerability on regional scale, which consider the meteorological, hydrological, relief and soil properties of a certain area. Due to the unfavourable soil conditions over the Great Plane, pound water and drought occur often in the same year.
Figure 4. Average temperature (dT; top) and precipitation (dP; bottom) anomalies for summer 1900-2000 relative to the mean of 1961-1990 (after Szalai et al. 2005)
Observed impacts of droughts on forests
Several studies are dealing with the drought-related forest damages and mortality throughout the world (e.g. Breda et al. 2006, McDowel et al. 2009, Allen 2009). Droughts have been showed to have a major influence on the health conditions of zonal tree species in Hungary.
Recurrent droughts at the end of the 20th century resulted in loss of vitality (Mátyás et al.
2007, Berki et al. 2009), and triggered the severe insect outbreaks and the appearance of pests
and pathogens in the beech and oak stands at the forest/steppe limit (Csóka 2007, Molnár and Lakatos 2007). Also the drought damages of forests reported by the National State Forest Service are very high in this time period (figure 5).
Figure 5. Reported drought damages in hectares 1961-2005 (Source: National State Forest Service) In the southwestern regions of Hungary, after the extreme dry periods 1992-1994 and 2000- 2004, an increasing decline of beech forests has been observed (Berki et al. 2007). Figure 6 visualises that decrease of the climatically favourable area for beech is the largest in this area relative to the beginning of the 20th century. It can be related to the decreasing trend of summer precipitation during the last century, which is stronger, than in other part of the country (Szalai et al. 2005).
Figure 6. Change of climatically favourable area for beech (prepared by Rasztovits and Móricz)
Projected impacts of droughts on forests for the future
Climatic sensibility and shift of the lower forest limit in Hungary has been investigated and modelled first by Mátyás and Czimber (2004) assuming different temperature and precipitation scenarios. If the probability and severity of climatic extremes increase in the future, zonal beech may almost disappear from Hungary (Berki et al. 2007, Czúcz et al. 2010).
Effects are predicted to occur first at the xeric limits of the distribution causing health decline and mortality of the tree species. Here, open woodlands could potentially replace a significant part of present-day closed forests (Mátyás et al. 2008). Shifts triggered by current and future climatic changes are too fast compared to spontaneous natural processes (Mátyás et al. 2009) that underline the urgent need of adaptation and mitigation strategies to help the maintenance of these ecosystems.
1901 – 1930 1975 – 2004
2.3 Feedback of forests on climate
2.3.1 Climatic role of forest ecosystems
Terrestrial ecosystems interact with the atmosphere through exchanges of energy, moisture, momentum, mineral aerosols, carbon-dioxide and another trace gases. Effects of land surface on climate, which are referred as feedbacks in this work, can be divided into two categories:
biogeophysical and biogeochemical. Vegetation affects the physical characteristics (e.g.
colour, roughness, water conductivity) of the land surface (biogeophysical effects), which control the partitioning of available energy at the surface between sensible and latent heat, and the partitioning of available water between evapotranspiration, soil water and runoff. Through biogeochemical effects, ecosystems alter the biogeochemical cycles, thereby change the chemical composition of the atmosphere (Betts 2001, Bonan 2002, Pitman 2003, Bonan 2004, Feddema et al. 2005). These land-atmosphere interactions can enhance or weaken the climate change signal.
This chapter is focusing on the role of land surface, particularly forests, in the
• surface energy balance,
• surface hydrologic cycle,
• vertical turbulent exchanges.
Surface energy balance
The energy balance at the land surface can be written as
F G E H L
L S
Rn =(1−α)* ↓+( ↓− ↑)= +λ + + (5) Rn [W m-2] is the net solar radiation absorbed by the ground surface after accounting for reflection of solar radiation and emission of net long-wave radiation. An amount of energy (S↓ [W m-2]) reaches the Earth’s surface and some is reflected, depending on the albedo α.
Long-wave radiation is also received (L↓ [W m-2]) and emitted (L↑ [W m-2]) by the Earth’s surface, depending on the temperature and emissivity of the land and atmosphere. Rn is balanced by sensible heat (H [W m-2]), latent heat (λE [W m-2]), heat storage (G [W m-2]) and the chemical energy (F [W m-2]) stored during photosynthesis and released by respiration (Pitman 2003, Bonan 2004, Bonan 2008b).
Albedo (α) is defined as the fraction of incoming solar radiation that is reflected by a surface (Bonan 2004). The surface albedo influences the short wave radiation budget, hence the energy availability at Earth’s surface (Betts 2001, Bonan 2002). It strongly depends on the wavelength of the solar radiation and on the surface properties. Surface albedo varies not only spatially but also temporally with the solar angle, vegetation phenology and with snow and ice cover. Albedos generally range from 0.05 to 0.15 for coniferous, 0.15-0.2 for deciduous forests and 0.16-0.26 for grasslands (Bonan 2004). In the regions, where forests have lower surface albedo (are darker) than grasslands, they receive more incoming solar radiation, which leads to the increase of net radiation and higher temperatures of the vegetation surface. This process, which is called albedo-effect, is one of the basic biogeophysical feedbacks of vegetation on climate and is typical in boreal regions (Bonan et al. 1992, Brovkin 2002, Kleidon et al. 2007).
Vegetation also influences the absorption of energy by the surface via modification of the surface albedo, thus alteration of energy partitioning between sensible and latent heat.
Sensible heat flux in the atmosphere is a flux of energy, which heats the surface without evaporating a liquid from it. Latent heat is the energy required to evaporate water from the evaporating surface. When water evaporates, energy is absorbed from the evaporating surface without a rise in temperature, which is the latent heat of vaporisation (Bonan 2008b). The latent heat flux cools the surface because of the large amount of energy required to evaporate water.
The sensible heat flux is directly proportional to the temperature difference between the surface and air, whereas the latent heat flux is directly proportional to the vapour pressure difference between the surface and air (Bonan 2004). Both are dependent from the surface roughness length and the wind speed.
The processes related to the surface energy and water balance are basically determined by the ratio of sensible heat flux (H [W m-2]) to latent heat flux (λE [W m-2]), which is called Bowen-ratio (BR).
E BR H
= λ (6)
When the magnitude of BR is less than one, a greater proportion of the available energy at the surface is passed to the atmosphere as latent heat than as sensible heat. In this case, evapotranspiration is not limited by the soil water, the boundary layer is cooler and moister, which should increase instability and should lead to more convective clouds (Kleidon 2004).
The converse is true for values of BR greater than one.
Surface hydrologic cycle
Land-atmosphere interactions related to the energy and water cycle are linked by the processes of evapotranspiration. Evapotranspiration is a collective term for all the processes, by which water in the liquid or solid phase at or near the earth’s land surfaces becomes atmospheric water vapour (Dingman 2002). It is the sum of transpiration, interception, bare soil evaporation and evaporation from open water and snow.
Transpiration is the vaporization of water from the saturated interior surfaces of leaves to the surrounding air via microscopic pores called stomata (Hungate and Koch 2003). Stomata open and close in response to environmental factors such as light, temperature, CO2
concentration and soil water. Interception and its hydrological role is introduced and discussed more in detail in Sect. 2.3.2. Bare soil evaporation is the vaporization of water directly from the mineral soil surface. It is only a small amount under forests because of the litter on the ground (Hewlett 1982).
Vegetation is basically influencing the water budget through interception and transpiration, which are affected by the leaf area and the rooting depth of the plants.
Leaf area index (LAI) is defined as a one sided green leaf area per unit ground area (Bonan 2008b). It affects the radiative transfer process within the canopy and evapotranspiration from the plant surface. LAI varies temporally with age and phenology. Its value differs strongly among plant communities. Measurements by Járó (1959) showed the large variability of LAI (from 2.5 to 8.4) in different Hungarian forest types depending on age and site conditions.
Forests have larger leaf area compared to other vegetated surfaces. Larger LAI warms the surface due to lower albedo. But larger LAI also results in larger roughness length thus higher
evapotranspiration rate in forests (Betts et al. 1997), which influences the exchange of both latent and sensible heat fluxes. The increase of the latent heat flux through transpiration is the major contributor to the cooling of the surface. The process is called evaporative cooling effect, which is the other basic biogeophysical feedback of forests on climate. It dominates primarily on the tropical regions leading to cooler and moister atmospheric boundary layer that may feed back to increased precipitation by affecting the larger-scale circulation (Brovkin 2002, Kleidon et al. 2007).
Vertical profile of leaf area in the forest canopy affects the distribution of radiation in the canopy. Larger leaf area increase the canopy shading, which leads to cooler air temperatures in the stem area, decrease of net radiation at the soil surface, therefore less bare soil evaporation in summer (Pitman 2003, Chang 2006).
Due to the higher evaporation rate, forests may increase the amount of precipitation. Chang (2006) summarizes the arguments and counterarguments to the possible precipitation- increasing role of forests. It is often assumed that forests enhance the precipitation formation increasing the effective height of mountains, which leads to an increase of the orographic precipitation. The higher transpiration rate of forests can lead to the increased vapour content of the air, which promotes the condensation and precipitation formation in the forested area.
The basic counterargument is that the horizontal distribution of precipitation is mainly affected by the general circulation and topographic characteristics rather than by forests. For the precipitation formation water vapour content is not enough (Chang 2006).
The amount of precipitation, which reaches the ground surface infiltrates into the soil.
Rooting depth and the soil texture determine the amount of water that can be stored in the soil, which is potentially available to the vegetation for transpiration (Kleidon and Heimann 1998). Available water holding capacity can be defined as the difference between field capacity (the amount of water after gravitational drainage) and wilting point (the amount of water in the soil when evapotranspiration ceases; Bonan 2004). Rooting depths have a large variability depending on plant species soil texture and soil water conditions.
Deep roots increase the water uptake and the amount of transpiration. It is an important characteristic in dry spells when moisture of advective origin diminishes. If there is enough moisture in the soil to continue evapotranspiration, local evapotranspiration can be an important contributor to precipitation. This is defined as precipitation recycling (Bisselink and Dolman 2009), which is a land-atmosphere feedback process from local evapotranspiration to local precipitation that acts as a mechanism in central-Europe to keep precipitation at stable level.
Vertical turbulent exchanges
Surface roughness affects the turbulence activity close to the ground surface. The intensity of the mixing is determined by the roughness of the surface and the strength of surface winds.
Taller vegetation like forests are rougher and have lower aerodynamic resistance than shorter vegetation. It creates more turbulence increasing the transfer of sensible and latent heat away from the surface (Bonan 2004, Betts 2007), enhance evapotranspiration, which promotes the cloud- and precipitation formation.
Vegetation height determines the thickness of the layer above the ground surface, in which the microclimatic effect of vegetation is sensible. On local scale it is an important parameter, especially for forests, which can be characterised by their own microclimate in the crown and
stem area. The energy and matter exchange between the atmosphere and the upper crown is often completely different than those between the lower crown and the trunk space and the soil (Foken 2008). So in forests, characteristic profiles for temperature, humidity and wind can develop, which influence the atmospheric boundary layer climate. In atmospheric models, vegetation has mostly no height but the sensitivity of the simulation results of this value on both global and regional scale is unknown.
2.3.2 Interception and its hydrologic role
Forests can greatly affect the hydrologic budget at the surface through the interception of precipitation (Brutsaert 2005). Forest catchments generally evaporate more water than those covered with shorter vegetation (Bosch and Hewlett 1982), mainly due to the greater rainfall interception loss from forest. The process of interception and the most important measurement methods and interception models are overviewed in Móricz et al. (2009).
Basic definitions
In the literature there are several definitions for interception (e.g. Hewlett 1982, Dingman 2002, Brutsaert 2005, Chang 2006), which are often inconsistent with each other. Here, definitions related to the process of interception are introduced, which are applied in this work. Interception occurs from rain and from snow. In this chapter only the rainfall interception is introduced.
In forests, only a fraction of the precipitation reaches the soil surface. The other part evaporates from the vegetation during and after the precipitation event, which is the interception loss. In a forest stand interception loss is the sum of the crown interception loss and the litter interception loss (Dingman 2002; figure 7).
Figure 7. Precipitation in forests (modified after Hewlett 1982)
In the process of interception are not only losses but also wins by condensation and sublimation processes as vapour, dew, rime and fog (Balázs and Führer 1990-91, Führer 1994, Brutsaert 2005).
Interception loss will be referred as interception in this work. It can be determined as the difference of the precipitation in the open air place (gross precipitation) and the stand precipitation in forest, which is the sum of throughfall, drip precipitation and stemflow.
Throughfall is the precipitation that falls directly to the forest floor without touching the canopy (figure 7). From the vegetation, precipitation drips to the ground (drip precipitation), or flows down along stems and major branches, which is the stemflow (figure 7).
Canopy storage capacity is the amount of water left on the canopy at the end of the storm, under conditions of zero evaporation. The maximal storage capacity is reached when surface elements are fully saturated (Brutsaert 2005). It is the one of the most crucial parameters that basically determines the potential amount of water, which is available for evaporation.
Storage capacity ranges from 0.5 to 4 mm in needleleaf evergreen forests and up to 2.6 mm in broadleaf deciduous forests (Hörmann et al. 1996). In modelling studies it is also called skin reservoir content. In the simulations, precipitation falls to the soil surface only after the skin reservoir is filled (when the amount of precipitation is larger than the maximal storage capacity).
Process of interception and the determining meteorological conditions and canopy factors In nature, during and after the rainfall event the processes related to interception can be divided into the following phases (Aston 1979):
• Wetting phase. At the beginning of the rainfall event canopy storage starts to fill and due to the intense evaporation the vapour content of the air strongly increases. Nearing to the reach of the saturation of the air, increase of the evaporation becomes slower and wetting of the canopy intensifies.
• Saturation phase. The crown is fully saturated, the maximal storage capacity of the canopy is reached.
• Drying phase. After precipitation has ceased the canopy surface gets dry. Evaporation is continuing depending on the meteorological conditions.
Amount of interception is influenced by the actual weather conditions and canopy characteristics.
Meteorological conditions are
• Duration, intensity and frequency of the precipitation event. In case of a brief, intense storm, the canopy wets once and interception is limited primarily by the canopy storage capacity. For a low intensity storm with longer duration, the canopy stays wet and the interception loss (limited primarily by the actual weather conditions) can be larger (Horton 1919, Zeng et al. 2000). Evaporation is the largest at the beginning in the wetting phase so higher frequency of the rainfall events (higher wetting frequency) leads to the larger amount of the stored and intercepted precipitation. These emphasise the role of the small precipitations with low intensity in the total interception amount (Kucsara 1996). Consequently, changes of the frequency and intensity of the precipitation events under future climate conditions may affect the interception.
• Energy balance (radiation energy, air temperature). Warmer temperature results in more intense evaporation thus larger interception (Hewlett 1982).
• Vapour content of the air. Higher water vapour content in the air leads to the decrease of the saturation deficit therefore weakens evaporation.
• Wind. Higher wind velocity enhances evaporation, which results in larger interception rate. On the other side precipitation is shaked from the canopy by wind and the amount of the drip precipitation increases (Hörmann et al. 1996).
Canopy characteristics are
• Leaf area index (LAI). Larger leaf area enables larger amount of precipitation stored on the canopy surface, which is available for evaporation.
• Type of vegetation. Coniferous forests have larger leaf area index and have foliage year-round, therefore intercept more precipitation annually than deciduous forests.
The difference between them can be 5-10% (Járó 1980, Führer 1984, Kucsara 1996).
Amount of interception also varies among tree species: annual mean of interception amount is 37% for spruce, 28% for beech and 25% for sessile oak under Hungarian conditions (Führer 1994). The smaller interception of beech can be explained by its smaller storage capacity and larger stemflow compared to spruce.
• Canopy density and closure. The denser the foliage the greater amount of water can be stored.
• Age and vitality of the canopy. The older canopies have larger leaf area but also larger crown closure, which leads to smaller throughfall rates (Balázs and Führer 1990- 1991).
• Bark characteristics. Smooth barks have greater stemflow than rough barks (figure 8).
For Hungary, beeches can be characterised by the largest stemflow rate (> 8%) turkey oak and poplars have 4-8%, whereas spruces have < 4% (Führer 1984; Kucsara 1996).
• Stem area index (SAI). In the case of smooth trunks, larger stem area enhances the amount of stemflow. But for rough trunks, the larger storage capacity enables larger amount of evaporation.
Figure 8. The smooth trunk of beech (left) and the rough trunk of alder (right)
• Branching patterns. Upright branches support stemflow compared to horizontal branches.
• Leaf shape and orientation. Leaves which are concave and elevated horizontally above the pare are able to contribute to stemflow (Crockford-Richardson 2000).
In Hungary, interception measurements in forest ecosystems have been carried out since the 1970th (Führer 1984, Járó 1980, Koloszár 1981, Kucsara 1996, Simonffy 1978-79; Sitkey 1996). The same methods are also applied in this study (Sect. 5.4).
Interception amount varies from 10 to 40% of gross precipitation depending on numerous parameters like tree species, forest density, canopy structure, vegetation physiology and site
conditions. The variability of interception within the tree species (depending on age or location) can be larger than its variability between the tree species. Sufficient measurements for the canopy properties are seldom available, therefore in the models these properties are mainly adopted based on local experiences.
Since interception is site-specific and its spatial variability is large, the spatial extrapolation of results of interception functions for other sites and the comparison between different forest ecosystems is quite difficult. It can be only achieved if not only the effects of the climatic and precipitation conditions but also the morphological properties of the investigated canopy are known (Führer 1984). For adequate description of interception in large areas it is necessary to include both the effects of spatial variability of canopy storage and rainfall.
Modelling of interception
In climate- and forest hydrology models the process of interception is described quite simplified because of the large spatial and temporal variability of the process. There are functions and models developed for interception only, which will be overviewed in this section, but it is impossible to include all of these parameters and processes in models designed for simulation of complex atmospheric processes over larger areas.
Modelling via regression analysis. Early studies assumed a linear function between the amount of precipitation and interception loss. Interception loss was described as a function of the storage capacity of the plant surface, the duration of the precipitation and the evaporation rate during the precipitation (Horton 1919). But this approach does not give any correct result for small precipitations and in the early wetting phase.
Amount of available water for evaporation from the vegetation surface strongly depends on canopy storage capacity, which cannot be measured directly. Führer (1984) applied saturation functions to determine this variable. Based on his assumption, interception is the function of precipitation and storage capacity, if evaporation during the rainfall is neglected. For this approach, weakly measurement of stand precipitation in the forest is sufficient.
According to Kucsara (1996) stand precipitation should be measured and interception should be calculated for each precipitation event rather than averaged over longer time period. After classification of precipitation events by their amount it was concluded that the role of small- precipitations in the total interception amount is quite important. He determined canopy storage capacities for different forest ecosystems applying exponential precipitation- interception functions (allowing evaporation during the whole process), which describe the process and amount of interception more realistic in the investigated canopies (Kucsara 1996). In the development of these functions was an important criteria that they should based on data, which are available from measurements.
Physically-based models requires the measurement of gross- and stand precipitation on larger temporal resolution (mostly in hourly time step). The first conceptual, physically-based model for interception was developed by Rutter et al. (1971). Evaporation is calculated based on a potential evapotranspiration rate for wet canopy using the Penman-Monteith equation with a canopy resistance zero. If actual canopy storage exceeds the storage capacity, evaporation takes place at the potential rate, else evaporation is reduced in proportion to actual canopy storage and the storage capacity. This approach is simplified by Gash and Morton (1978) and modified by Valente (1997) for the application to sparse canopy. In the later the area of interest is partitioned into the fraction covered by a forest canopy and the open fraction. The canopy storage is filled by rainfall and emptied by drainage and evaporation. Drainage from the canopy occurs when the canopy storage capacity is exceeded.