Brain MRI Diffusion Encoding Direction Number Affects Tract-Based Spatial Statistics Results in Multiple Sclerosis
B ´alint Kincses , Tam ´as Spis ´ak, P ´eter Farag ´o, Andr ´as Kir ´aly, Nikoletta Szab ´o, D ´aniel Ver ´eb, Kriszti ´an Kocsis, Bence Bozsik, Eszter T ´oth, L ´aszl ´o V ´ecsei, Zsigmond Tam ´as Kincses
From the Department of Neurology, University of Szeged, Szeged, Hungary (BK, PF, AK, NS, DV, KK, BB, ET, LV, ZTK); Department of Radiology, University of Szeged, Szeged, Hungary (ZTK); MTA-SZTE Neuroscience Research Group, Szeged, Hungary (LV); Bingel Laboratory, University of Essen, Essen, Germany (TS); and Department of Psychiatry, University of Szeged, Szeged, Hungary (BK).
A B S T R A C T
BACKGROUND AND PURPOSE: Diffusion tensor imaging (DTI) is a promising approach to detect the underlying brain pathology. These alterations can be seen in several diseases such as multiple sclerosis. Tract-based spatial statistics (TBSS) is an easy to use and robust way for analyzing diffusion data. The effect of acquisition parameters of DTI on TBSS has not been evaluated, especially the number of diffusion encoding directions (NDED), which is directly proportional with scan time.
METHODS: We analyzed a large set of DTI data of healthy controls (N=126) and multiple sclerosis patients (N=78). The highest NDED (60 directions) was reduced and a tensor calculation was done separately for every subset. We calculated the mean and standard deviation of DTI parameters under the white matter mask. Moreover, the FMRIB Software Library TBSS pipeline was used on DTI images with 15, 30, 45, and 60 directions to compare differences between groups. Mean DTI parameters were compared between groups as a function of NDED.
RESULTS: The mean value of FA and AD decreased with increasing number of directions. This was more pronounced in areas with smaller FA values. RD and MD were constant. The skeleton size reduced with elevating NDED along with the number of significant voxels. The TBSS analysis showed significant differences between groups throughout the majority of the skeleton and the group difference was associated with NDED.
CONCLUSION: Our results suggested that results of TBSS depended on the NDED, which should be considered when comparing DTI data with varying protocols.
Keywords:Diffusion encoding directions, diffusion tensor imaging, multiple sclerosis, tract-based spatial statistics.
Acceptance:Received December 15, 2019, and in revised form March 6, 2020. Accepted for publication March 6, 2020.
Correspondence: Address correspondence to Zsigmond Tam ´as Kincses, Department of Radiology, Albert Szent-Gy ¨orgyi Clinical Center, University of Szeged, Semmelweis u. 6, 6725-Szeged, Hungary. E-mail: kincses.zsigmond.tamas@med.u-szeged.hu.
Acknowledgements and Disclosure: This paper was supported by an EFOP grant (EFOP-3.6.1-16-2016-00008), and a Horizon 2020 Framework Programme grant (H2020-MSCA-RISE-2016 734718). B ´alint Kincses was supported by the UNKP-19-3 New National Excellence Program of the Ministry of Human Capacities. Kriszti ´an Kocsis was supported by the UNKP-19-3-SZTE-149 New National Excellence Program of the Ministry of Human Capacities.
The copyright line for this article was changed on May 27, 2020 after original online publication.
J Neuroimaging 2020;00:1-11.
DOI: 10.1111/jon.12705
Introduction
Diffusion tensor imaging (DTI) is a widely used technique to analyze tissue pathology in vivo. Several studies demonstrated structural alterations in various diseases.1-3 From the tensor model, several derived parameters are available to characterize white matter changes qualitatively. Fractional anisotropy (FA) describes how strongly the diffusion is directional in the mea- sured volume. Mean diffusivity (MD) and the main eigenvec- tors represent the average diffusivity within the voxel and the diffusion along the main diffusion directions. A correct estima- tion of the diffusion tensor requires at least six noncollinear diffusion directions and an extra nondiffusion-weighted im- age. Because diffusion-weighted measurement is typically char- acterized by relatively small signal-to-noise ratio (SNR), one could attain higher SNR with increasing the number of dif- fusion encoding directions (NDED). To achieve tensor ori- entation and anisotropy-independent SNR, one should use a
This is an open access article under the terms of the Creative Commons Attribution-NonCommercial-NoDerivs License, which permits use and distribution in any medium, provided the original work is properly cited, the use is non-commercial and no modifications or adaptations are made.
uniform distribution of the encoding directions.4 Moreover, the optimal NDED is critical for SNR and scan time. More directions increase SNR5but prolong the measurement. Sev- eral theoretical and practical studies demonstrated the NDED dependency of the obtained diffusion tensor values and propose an optimum NDED which, depending on the optimization met- ric, ranges between 6 and 62.5-12
Although there is a considerable body of research in this topic, there are still outstanding issues to be investi- gated. Most of these studies evaluated data from healthy controls (HC) or used simulated data.5-12 In vivo studies in- clude the physiological effects (movements, cardiorespiratory effects, etc) and patient-related special features (eg, different in-scanner motion). In addition, special analytical methods could be sensitive to the bias of the tensor value. The widely used tract-based spatial statistics (TBSS) is an easy to use and robust method to analyze DTI images.13 The approach
◦
Table 1. Clinical and Demographical Data of Participants
Number of participants
(female) Age (year) EDSS
Disease duration (year) MS 78 (55) 38.6 (±9.9) 1 (0-6.5) 8.7 (±6.8)
HC 126 (57) 31 (±10.2) – –
Note. Age and disease duration are mean±standard deviation. Median expanded disability status scale and the range are shown. EDSS=expanded disability status scale.
Table 2. The Mean of DTI Parameters in the Individual White Matter Mask for Different Subset of Encoding Directions for Healthy Controls
NDED AD FA MD RD
10 1.20×10⁻³ 4.86×10⁻¹ 7.58×10⁻⁴ 5.39×10⁻⁴ 15 1.18×10⁻³ 4.69×10⁻¹ 7.60×10⁻⁴ 5.48×10⁻⁴ 20 1.18×10⁻³ 4.64×10⁻¹ 7.62×10⁻⁴ 5.52×10⁻⁴ 25 1.18×10⁻³ 4.61×10⁻¹ 7.61×10⁻⁴ 5.52×10⁻⁴ 30 1.18×10⁻³ 4.59×10⁻¹ 7.61×10⁻⁴ 5.53×10⁻⁴ 35 1.17×10⁻³ 4.58×10⁻¹ 7.59×10⁻⁴ 5.53×10⁻⁴ 40 1.17×10⁻³ 4.58×10⁻¹ 7.58×10⁻⁴ 5.52×10⁻⁴ 45 1.17×10⁻³ 4.57×10⁻¹ 7.58×10⁻⁴ 5.52×10⁻⁴ 50 1.17×10⁻³ 4.57×10⁻¹ 7.58×10⁻⁴ 5.52×10⁻⁴ 55 1.17×10⁻³ 4.56×10⁻¹ 7.58×10⁻⁴ 5.53×10⁻⁴ 60 1.17×10⁻³ 4.56×10⁻¹ 7.57×10⁻⁴ 5.52×10⁻⁴ AD=axial diffusivity; FA=fractional anisotropy; MD=mean diffusivity; RD
=radial diffusivity; NDED=number of diffusion encoding directions.
resolves several problems of the voxelwise analysis of the DTI data, mainly arising from the misalignment of the multisubject data. The method utilizes a fine-tuned nonlinear registration and projection onto an alignment-invariant tract representa- tion (the mean FA skeleton) that improves the sensitivity and interpretability of the multisubject DTI studies. Since the pub- lication of the original study, an enormous number of studies used this approach (1,737 article cited it according to PubMed in 07/2019). As the method concentrates on the center of the tracks (local maxima of the FA), where the white matter is most uniformly organized, NDED might have specific implications for this analysis technique. However, no previous study inves- tigated the effect of NDED on the TBSS analysis according to our knowledge.
In the current investigation, our aim was to evaluate the effect of the NDED on the performance of TBSS in a real- world patient population. We chose multiple sclerosis (MS) as a target disease, because demyelination is a key feature of the pathology, which is on a scale that is detectable with DTI.14,15 The effect of NDED on TBSS’ performance between healthy and MS group is questionable.
Methods Subjects
One hundred and twenty-six HC and seventy-eight MS patients were recruited between 2009 and 2017 and a total of 204 scans were used in our analysis. We used the HC group to evaluate the effect of diffusion encoding directions on areas with differ- ent FA values. The age of the participants was between 21 and 60 at the time of the magnetic resonance imaging (MRI) scan.
Exclusion criteria for the HC subjects were the presence of any psychiatric or neurological disease, as well as any chronic
Table 3. The Mean Bias of DTI Parameters from the Reference, 60 Directions Image in White Matter Mask in Healthy Controls
NDED AD FA MD RD
10 2.84×10⁻⁵ 2.95×10⁻² 9.37×10⁻⁷ –1.28×10⁻⁵ 15 1.62×10⁻⁵ 1.29×10⁻² 2.46×10⁻⁶ –4.27×10⁻⁶ 20 1.47×10⁻⁵ 7.80×10⁻³ 4.67×10⁻⁶ –2.14×10⁻⁷ 25 1.02×10⁻⁵ 4.78×10⁻³ 3.61×10⁻⁶ 3.89×10⁻⁷ 30 8.09×10⁻⁶ 3.10×10⁻³ 3.24×10⁻⁶ 9.60×10⁻⁷ 35 5.04×10⁻⁶ 1.92×10⁻³ 2.02×10⁻⁶ 5.48×10⁻⁷ 40 2.67×10⁻⁶ 1.60×10⁻³ 7.06×10⁻⁷ –1.59×10⁻⁷ 45 2.35×10⁻⁶ 8.34×10⁻⁴ 9.68×10⁻⁷ 3.33×10⁻⁷ 50 1.63×10⁻⁶ 7.11×10⁻⁴ 5.32×10⁻⁷ 1.03×10⁻⁷ 55 1.06×10⁻⁶ –2.94×10⁻⁵ 6.67×10⁻⁷ 5.48×10⁻⁷ AD=axial diffusivity; FA=fractional anisotropy; MD=mean diffusivity; RD
=radial diffusivity; NDED=number of diffusion encoding directions.
conditions. An experienced neuroradiologist (8 years of expe- rience) reviewed all images and in case of any abnormality the subject was excluded from further analysis. The MS subjects were enrolled from our outpatient clinic. We excluded patients who did not take disease-modifying therapy on a regular ba- sis, who experienced relapse 6 months prior to the MRI scan and who had significant brain atrophy, which affected image registration. The local ethics committee approved the study (au- thority number: 56/2011), and all the subjects provided written consent. Data and code are available upon request through personal correspondence after the approval of the local ethics committee.
Imaging Protocol
MRI was performed on a 1.5 T GE Signa Excite HDxt MR Scanner (GE Healthcare, Chalfont St. Giles, UK). T1- weighted images (3D IR-FSPGR: repetition time(TR)/echo time (TE)/inversion time (TI): 10.3/4.2/450 ms, flip angle: 15°, Array coil Spatial Sensitivity Encoding (ASSET): 2, field of view (FOV): 25 cm×25 cm, matrix: 256×256, slice thick- ness: 1 mm) and 60 direction diffusion-weighted images with six nondiffusion-weighted reference volumes were recorded (TE:
93.8 ms, TR: 13,500 ms, matrix: 96×96, FOV: 23 cm×23 cm, flip angle: 90°, in-plane resolution: 2.4 mm×2.4 mm, which was resampled to a .89 mm×.89 mm by the scanner, slice thickness: 2.4 mm, b: 1,000s/m2, number of excitation (NEX):
2, ASSET): 2).
Data Processing
The analyses of MR images were carried out with the tools from the FMRIB Software Library (FSL, version 5.0; Ox- ford Centre for Functional MRI of the Brain [FMRIB], UK;www.fmrib.ox.ac.uk/fsl) and in-house built MATLAB scripts. The following preprocessing methods were used in the diffusion image pipeline: eddy current correction and brain ex- traction. The FSL eddy correct function was used to correct for subject movement and eddy currents and the FSL bet function in the nondiffusion-weighted image to eliminate nonbrain part of the image.
From the original data (60 diffusion encoding directions), the diffusion encoding directions were reduced ton=10, 15, 20, 25, 30, 35, 40, 45, 50, and 55 as follows. We used a reduc- tion procedure to keep the uniform distribution via maximizing the total angular distribution energy.5The angular distribution
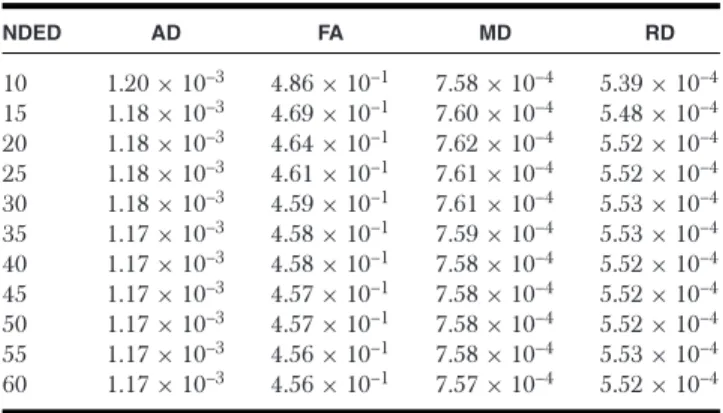
Fig 1. Bias of DTI parameters in white matter. The mean of DTI parameters’ bias values under the white matter at different number of diffusion encoding directions in the HC group. The red dotted line shows the mean difference between the MS and HC group. Asterisks represent significant differences between groups with different directions.
energy of a pair of points on the unit sphere surface could be determined as the inverse of the sum of the squares of the least spherical distance between point a and point b, and the least spherical distance between point a and point b’s antipodally symmetric point B (Eq 1).
Ea,b = 1
(mina,b dista,b)2+
mina,B dista,B
2 (1)
Angular Distribution Energy of A Pair of Points
The total angular distribution energy for a certain set of gra- dients can be calculated as the sum of the angular distribution energy of all pairs of gradients. The subset of gradient directions was chosen in a sequential order.5The initial subset was one gradient and other gradients were chosen in a sequential order to maximize the total angular distribution of the set (Eq 2). The generated subset of diffusion encoding directions was selected and fed into the DTI analysis.
EL(N)= N
a
N
b
Ea,b (2)
The Total Angular Distribution Energy of A set of Gradients We used the epi reg function in FSL FLIRT16 to calculate the transformation matrix between the T1 image and diffusion space. A diffusion tensor model was fitted in each voxel with the diffusion toolbox of FSL.17The FA maps were calculated in each group. We used FSL FAST18on the T1-weighted images to segment the white matter from the high-resolution anatom- ical image. Next, the white matter tissue probability map was thresholded (.7), binarized, and transformed to the diffusion space (trilinear interpolation) with the inverse transformation matrix from epi reg and a final threshold of 1 was used. All the individual white matter masks were visually inspected and in case of gross error the mask was recalculated and/or corrected manually. These individual white matter masks were used as re- gion of interests (ROIs) to evaluate parameters under the white matter area. The mean and standard deviation of FA, MD, axial diffusivity (first eigenvalue, AD), and radial diffusivity (mean of the second and third eigenvalue, RD) within the white matter (WM)-mask were calculated for each subject, that is, one value was determined in every subsampled data set (10, 15, 20, 25, 30, 35, 40, 45, 50, 55, and 60 directions) for each subject. For every subject, we calculated the bias from its original 60-direction im- age for each subsampled dataset, that is, the 60 directions image
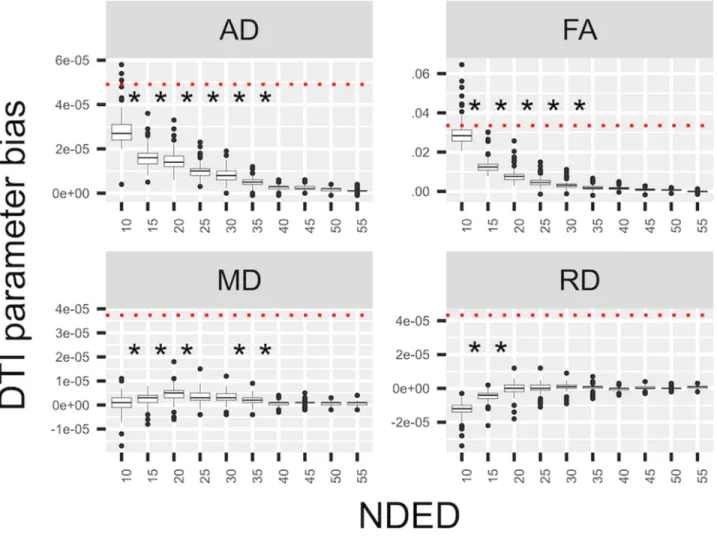
Fig 2. Bias of DTI parameters in different FA bins. The mean DTI parameter’s bias from the “60 directions” image under areas of different FA values in the HC group. The four investigated DTI parameter are shown. Data points, which are out from the 95% interval, are not visualized.
was considered as a reference. We also tested for the statistical significance of the effect of directions on the mean and standard deviation for each derived parameters. Repeated measures of analysis of variance with the random effect of subjects were used within R studio19as implemented in the lme4, emmeans, and car packages.20-22The FA, MD, RD, and AD bias was also calculated within different white matter regions, by dividing the white matter mask into separate bins, namely, areas with .2-.4, .4-.6, .6-.8, and .8-1 FA values in the reference (60-direction) image.
To evaluate the effects of the number of diffusion directions on TBSS results, we performed a TBSS analysis separately on each DTI parameter as proposed in the FSL guideline.13Briefly, subjects’ FA images were aligned into a common space, using the nonlinear registration tool (FNIRT). A mean FA image was created and the threshold set at FA=.3, deriving a mean FA skeleton that represented the centers of all tracts common to the group. Each subject’s aligned FA data were then projected onto this skeleton and the resulting data fed into voxel-wise statistics. We performed statistical analysis with the use of a general linear model with nonparametric permutation test for inference (5,000 permutations) with age and sex as covariates in our model. Thresholding was performed by threshold-free cluster-enhancement approach and results were corrected for multiple comparisons by controlling for the family-wise error
rate. The analysis was performed in the following four sub- groups of reduced directions: FA images of 15, 30, 45, and 60 directions comparing the two groups (126 HC and 78 MS). In a second analysis, the threshold in the last step of the TBSS pipeline was chosen to keep skeleton size similar (voxel count difference within .1%), therefore FA thresholds of .3225, .307, .3028, and .3 were used for the 15, 30, 45, and 60 directions, respectively. The number of voxels in the skeleton and the num- ber of significant voxels were calculated. Also, the mean and standard deviation of the FA, MD, RD, and AD values in the significant voxels were investigated. Mean group differences were calculated in the significant voxels.
Results
The participants’ demographical and clinical data are in Table 1. We considered the value of the “60 directions” group as the reference value. The mean DTI parameters and the NDED- related bias are listed in Tables 2 and 3 and bias is depicted in Figure 1. A decreasing trend of AD and FA could be observed with increasing NDED (Tables 2 and 3). The RD had an in- creasing trend and the MD was constant (Table 3 and Fig 1).
Statistical analysis revealed significant main effect of directions in FA (F(10,1250) = 2,191.8,P< .0001), MD (F(10,1250)= 114.4,P<.0001), AD (F(10,1250)=1,472.6,P<.0001), and RD (F(10,1250) = 602.1, P< .0001). Moreover, the 40, 35,
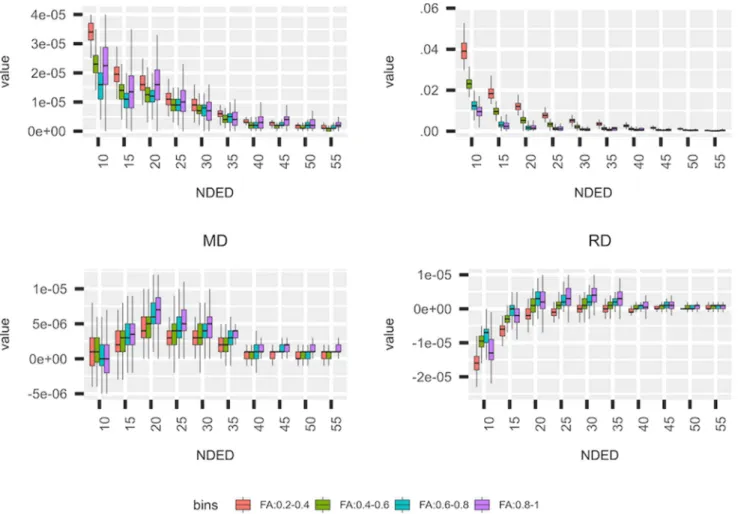
Fig 3. Standard deviation of DTI parameters. The standard deviation of the DTI parameters in separate bins of the white matter (WM) in healthy controls.
35, and 20 directions did not significantly differ from the 60 directions based on post hoc analysis (Tukey method) in AD, FA, MD, and RD, respectively (Fig 1). The asterisk in Figure 1 depicts NDED groups that differ significantly from the 60 di- rections group (Fig 1). Mean values of DTI parameters under different bins of the white matter were evaluated (Fig 2). Lower FA bins had a greater overestimation with decreasing directions but other parameters did not differ substantially.
The standard deviation of DTI parameters in the white mat- ter mask increased slightly with decreasing directions, which was more visible for FA and AD parameters (Fig 3). For the different intensity bins, the FA value had the lowest standard deviation in the highest bin compared to other bins. In RD and MD parameters, the three upper bins had similar but lower standard deviation compared to the lowest bin. In contrary, the highest bin had the highest standard deviation compared to other bins in AD (Fig 3). As a function of NDED, the standard deviation of the whole white matter did not change significantly from the 60 directions at 55, 20, 35, and 20 directions in AD, FA, MD, and RD respectively as revealed with post hoc analysis (Tukey method).
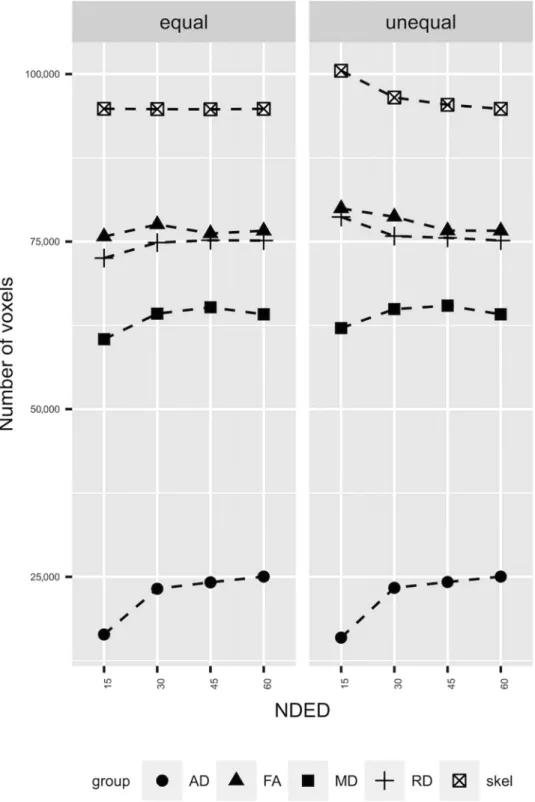
The TBSS analysis between 78 MS patients and 126 HCs revealed slightly different results as a function of NDED when threshold values were kept constant. The qualitative analysis revealed minimal differences in the skeleton size and the num- ber of significant voxels (Fig 4, right side). The total size of the skeleton was reduced with increasing number of diffusion di-
rections. Similarly, the number of significantly different voxels was reduced. However, when the FA threshold was changed to keep the skeleton size constant, the number of significant voxels was similar in FA and RD but there was a drop at 15 directions in MD and AD (Fig 4, left side). Regarding the group differences, the mean FA value within the significant voxels of the skeleton showed a decreasing trend with the elevation of the encoding directions. This was more pronounced in AD but absent in MD and RD (Figs 5-7). In addition, the MS group had smaller values in any number of diffusion directions for FA and higher values for AD, MD, and RD on a group level (Fig 5). There was a statistical significant interaction between the effect of disease group and NDED in the equal skeleton size condition for all parameters (AD:F(3,606)=10.2,P<.0001;
FA:F(3,606)= 8.4,P<.001; MD:F(3,606)= 2.9,P<.05);
and RD:F(3,606)=4.2,P<.01). In the unequal skeleton size condition, interaction could be observed for AD, FA, MD, and RD as well (AD: F(3,606) = 10.2, P < .0001; FA: F(3,606)
= 8.8,P < .0001; MD: F(3,606) = 2.7, P < .05); and RD:
F(3,606)=4.8,P<.01). This means that the mean differences of the groups change differently as a function of directions (Fig 6) in both skeleton sizes. The result of the TBSS analysis of the FA in unequal skeleton size condition is depicted in Figure 7.
Discussion
In the present study, we investigated the effect of the number of diffusion directions on the estimated diffusion parameters, with
Fig 4. The results of TBSS analysis. The left side of the plot (“equal”) shows the results of TBSS when skeleton size was held constant (see Methods). The right side of the plot (“unequal”) shows the results when skeleton size was varying with NDED. The different groups represent the significant voxel count in that diffusion parameter. Correcting for skeleton size the number of significant voxel count did not change in FA and RD as a function of NDED and the trend of AD and MD parameter were the same.
a special emphasis on detecting differences in a patient popu- lation with the commonly used TBSS approach. We found an overestimation of FA and AD with .01 and 10−5, respectively, if the NDED was below 30 directions. Areas with low FA values seemed to be more prone to the overestimation. For RD, under- estimation was found and MD was not affected by the NDED.
When considering the TBSS analysis, the overestimation of FA
leads to an enlarged skeleton and within that skeleton more significantly different voxels can be found at low NDED.
At least six noncollinear encoding directions are necessary to estimate the diffusion tensor.23Moreover, previous studies with real-life data5,8,9,24investigated the effects on NDED on accurate and precise FA estimation in ROI analysis. The decrease of the encoding directions leads to an overestimation of the FA and
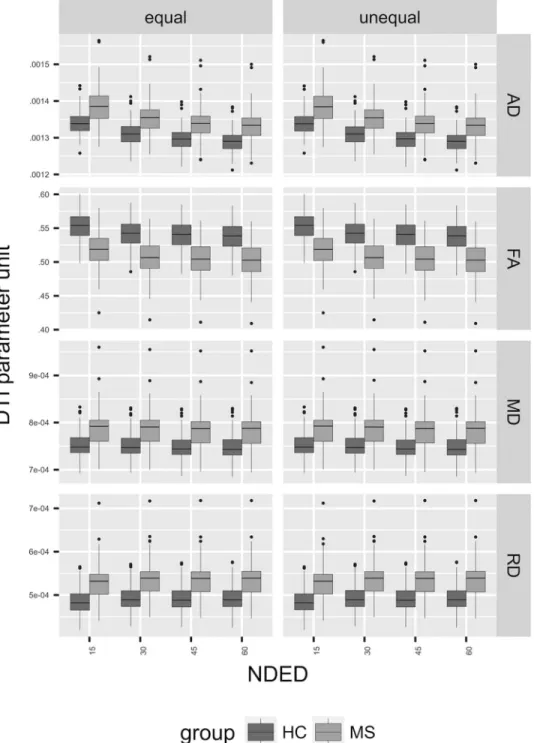
Fig 5. The mean FA under significant voxels. The left side of the plot (“equal”) shows the distribution of the mean of DTI parameters under significant voxels when skeleton size was held constant (see Methods). The right side of the plot (“unequal”) shows the same results when skeleton size was varying with NDED.
AD and an underestimation of RD but does not affect MD.
The overestimation seems to be more severe if the uniform spherical distribution of directions has not been kept.24 As it was emphasized, the relationship of the fiber orientation and the encoding direction has a major effect on the tensor, especially in low NDED. Simulation studies found that the relationship of diffusion scheme and the underlying fiber orientation has a profound effect on the accuracy and precision of the estimated anisotropy.7However, the investigation of the performance of different schemes on real-life data is more complicated because of the spatial and tissue-dependent SNR and other imaging-
related artifacts such as chemical shift, distortion, and eddy currents.
The optimal NDED has been investigated in previous studies.5,8,9,24In a ROI-based approach, no difference was found in FA and MD between 6 and 30 directions when scanning time was held constant at 1.5 T.9 Moreover, they found an over- estimation of the main eigenvalue (AD) in the six directions scheme in most of the ROIs. Another ROI approach found minimal but significant FA and MD changes between the 6 and 30 directions scheme at 1.5 T.8However, they concluded that the test-retest variability is higher than this difference. In
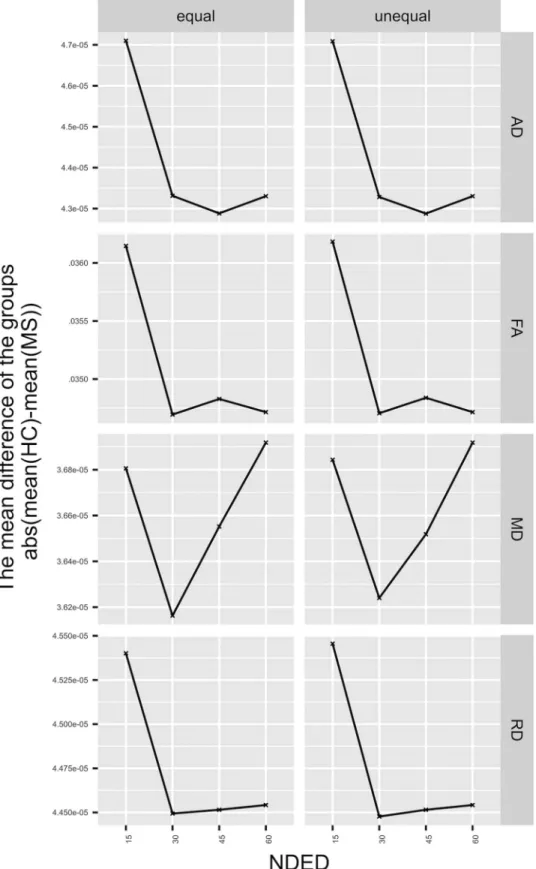
Fig 6. The mean difference of the groups. Left side represents the equal skeleton size and the right side represents the unequal skeleton size (see Methods). The parameters have various trends regarding the group difference. The skeleton size has no effect on the trends of the investigated parameters.
addition, an upward bias of FA could be detected in the gray matter as SNR decreased but no change was found in white matter ROIs.25 Therefore, the total number of scans was held constant for these studies, which resulted in a comparable SNR
for the different schemes. Moreover, an increment in NDED was reported to lead to an elevation in SNR and to reach its plateau at 53 directions for FA and 51 directions for MD in the white matter.5Random rejection of directions leads to an
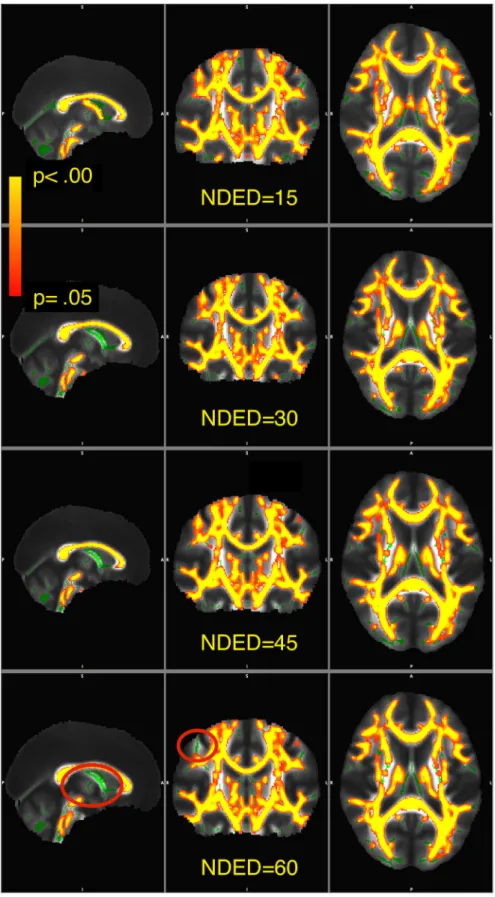
Fig 7. Visualization of significant voxels within the skeleton. The skeleton is showed in green. The statistical images are overlaid in yellow-to- red and thickened with the tbss_fill function for visualization as recommended in FSL. The yellow-to-red colors representP-values thresholded atP<.05 corrected. Red ovals show areas where significant voxels differ as a function of NDED.
overestimation of FA and AD and an underestimation of RD but does not affect MD; these effects are more apparent in areas with low FA.24 The uniform rejection has the same ef- fects on low FA areas, but the overestimation is much lower.
Lower SNR could be in the background of the overestima- tion with lower NDED. Moreover, FA and AD seem to be affected more profoundly by NDED in general than “isotropic indices” (MD and RD), which averages information from more directions. The previously investigated ROIs mostly contain main tracts in which axons run in one direction. Neverthe- less, the relative orientation of tracts and diffusion directions has an impact on the parameter estimation at low number of directions.7,8However, the analyses of DTI data mostly use the full brain and TBSS is one popular method to do this.13There- fore, to understand the effects of NDED on TBSS, analysis is crucial.
Diffusion parameters have a high spatial variability (eg, FA in the middle of the fiber bundle is much higher than at the periphery or, eg, over the anteroposterior aspect of the corpus callosum,26FA changes together with the underlying histolog- ical features). This high spatial variability warrants voxel-wise statistics. However, registration in the white matter is not trivial.
One possible solution is applied in the TBSS approach, namely, only the most structured parts of the white matter are investi- gated in the white matter skeleton. The skeleton is defined by the relatively high FA values (usually higher than .2-.3), which by itself reduces the bias, because areas with low FA values are more prone to the overestimation of FA.
MS is an inflammatory and neurodegenerative disease with various clinical symptoms in which white and gray matter are affected diffusely.15,27,28The disease causes local lesions in the brain and alterations in the normal appearing white matter.29,30 Many studies found wide-spread changes in DTI parameters in MS.31-36 Here, we found extensive alteration of DTI parame- ters in the white matter in MS patients compared to HCs. The reason of this broad difference could be the high number of participants in the study, which may lead to the detection of smaller differences. Furthermore, the higher number of MS pa- tients may also contribute because their inclusion leads to an increased percent of focal demyelinating lesions in the skele- ton, which have reduced FA and increased MD.36 However, only a small proportion of the skeleton contains lesions (7.5%
of the total volume of the skeleton in a subpopulation of 40 MS patients from the current sample of whom manually seg- mented lesion mask were available). The mean difference in the significant voxels of FA and AD decreased with the NDED, that is, the two groups mean values depended on NDED in different way. In the lowest NDED, the group difference was the highest. One possible explanation could be the underly- ing pathology in MS. The white matter FA value is decreased throughout the brain, which is in turn, more prone to over- estimation. Moreover, voxels included in the skeleton in the TBSS approach are more ambiguous. However, the significant change of group differences between the directions is still very low. Regarding the two skeleton sizes, the group differences of the parameters followed a similar trend. Moreover, the number of significant voxels and the skeleton size was different between different schemes and decreased with the NDED as well. The overestimation of skeleton size could be the consequence of the overestimation of FA within the small FA areas. In addition, the elevated number of significant voxels of FA simply resulted
from the higher number of voxels. This effect could be reversed because correcting for skeleton size, the number of significant voxels of FA was equal as well. Conversely, the number of significant voxels of MD and AD was smaller at 15 directions compared to higher directions.
As we worked with fixed encoding directions and their sub- sets, the distribution of directions could differ from the optimal distribution. According to Zhan et al, this difference was in the range of 5-6% in terms of distribution energy in 10 and 15 directions5and as Zhan et al acknowledged that this “subop- timal sampling may play a minor role in the SNR gains.” We repeated their calculation and the ratio of distribution energy in our study was less than 1%, which is a negligible difference (Fig. S1). The difference between the two studies stems from the different number of encoding direction used in the original dataset, that is, 94 compared to 60 in our case.
One of the limitations of our study is that the results are only applicable to differences between MS and healthy patients;
other diseases might show different pattern of TBSS’ change as the function of NDED. Other parameters that have an effect on signal-to-noise should also be considered such as voxel size and field strength.
In conclusion, the bias caused by directions is more pro- nounced for areas with small FA values and seems to be con- stant above 30 directions. Moreover, NDED has a slight effect on TBSS, which makes it reasonable to cautiously compare results from different TBSS studies with different NDED. Re- garding all the derived DTI parameters, 30 directions might be enough to compare healthy and MS patients with TBSS anal- ysis. Importantly, our results indicate that higher FA threshold of the skeleton should be used with lower NDED to avoid false positive result.
References
1. Guo AC, MacFall JR, Provenzale JM. Multiple sclerosis: Diffusion tensor MR imaging for evaluation of normal-appearing white mat- ter. Radiology 2002;222:729-36.
2. Szab ´o N, Kincses ZT, P´ardutz ´A, et al. White matter microstructural alterations in migraine: a diffusion-weighted MRI study. Pain 2012;
153:651-6.
3. Soares JM, Marques P, Alves V, et al. A hitchhiker’s guide to diffusion tensor imaging. Front Neurosci 2013;7:31.
4. Jones DK, Horsfield MA, Simmons A. Optimal strategies for mea- suring diffusion in anisotropic systems by magnetic resonance imaging. Magn Reson Med 1999;42:515-25.
5. Zhan L, Leow AD, Jahanshad N, et al. How does angular resolution affect diffusion imaging measures? Neuroimage 2010;49:1357–71.
6. Hasan KM, Parker DL, Alexander AL. Comparison of gradient encoding schemes for diffusion-tensor MRI. J Magn Reson Imaging 2001;13:769-80.
7. Jones DK. The effect of gradient sampling schemes on measures derived from diffusion tensor MRI: a monte carlo study. Magn Reson Med 2004;51:807-15.
8. Landman BA, Farrell JAD, Jones CK, et al. Effects of diffusion weighting schemes on the reproducibility of DTI-derived fractional anisotropy, mean diffusivity, and principal eigenvector measure- ments at 1.5T. Neuroimage 2007;36:1123-38.
9. Ni H, Kavcic V, Zhu T, et al. Effects of number of diffusion gradient directions on derived diffusion tensor imaging indices in human brain. Am J Neuroradiol 2006;27:1776-81.
10. Papadakis NG, Murrills CD, Hall LD, et al. Minimal gradient en- coding for robust estimation of diffusion anisotropy. Magn Reson Imaging 2000;18:671-9.
11. Batchelor PG, Atkinson D, Hill DLG, et al. Anisotropic noise prop- agation in diffusion tensor MRI sampling schemes. Magn Reson Med 2003;49:1143-51.
12. Skare S, Hedehus M, Moseley ME, et al. Condition number as a measure of noise performance of diffusion tensor data acquisition schemes with MRI. J Magn Reson 2000;147:340-52.
13. Smith SM, Jenkinson M, Johansen-Berg H, et al. Tract-based spatial statistics: voxelwise analysis of multi-subject diffusion data. Neu- roimage 2006;31:1487-505.
14. T ´oth E, Farag ´o P, Kir´aly A, et al. The contribution of various MRI parameters to clinical and cognitive disability in multiple sclerosis.
Front Neurol 2019;9:1172.
15. T ´oth E, Szab ´o N, Csete G, et al. Gray matter atrophy is primarily related to demyelination of lesions in multiple sclerosis: a diffusion tensor imaging MRI study. Front Neuroanat 2017;11:23.
16. Jenkinson M, Bannister P, Brady M, et al. Improved optimization for the robust and accurate linear registration and motion correction of brain images. Neuroimage 2002;17:825-41.
17. Smith SM, Jenkinson M, Woolrich MW, et al. Advances in func- tional and structural MR image analysis and implementation as FSL. Neuroimage 2004(Suppl. 1):208-19.
18. Zhang Y, Brady M, Smith S. Segmentation of brain MR images through a hidden Markov random field model and the expectation- maximization algorithm. IEEE Trans Med Imaging 2001;20:45-57.
19. R Core Team.R: A Language and Environment for Statistical Com- puting. Vienna, Austria: R Foundation for Statistical Computing;
2018.
20. Bates D, Machler M, Bolker B, et al. Fitting linear mixed-effects models using lme4. J Stat Softw Artic 2015;67:1-48.
21. Searle SR, Speed FM, Milliken GA. Population marginal means in the linear model: an alternative to least squares means. Am Stat 1980;34:216-21.
22. Fox J, Weisberg S.An R Companion to Applied Regression. 2nd ed.
Thousand Oaks CA: Sage; 2014.
23. Basser PJ, Mattiello J, Lebihan D. Estimation of the effective self-diffusion tensor from the NMR spin echo. J Magn Reson B 1994;103:247-54.
24. Chen Y, Tymofiyeva O, Hess CP, et al. Effects of rejecting diffusion directions on tensor-derived parameters. Neuroimage 2015;109:160-70.
25. Farrell JAD, Landman BA, Jones CK, et al. Effects of signal-to- noise ratio on the accuracy and reproducibility of diffusion ten- sor imaging-derived fractional anisotropy, mean diffusivity, and
principal eigenvector measurements at 1.5T. J Magn Reson Imag- ing 2007;26:756–67.
26. Pfefferbaum A, Sullivan EV. Increased brain white matter diffu- sivity in normal adult aging: relationship to anisotropy and partial voluming. Magn Reson Med 2003;49:953-61.
27. Calabrese M, Filippi M, Gallo P. Cortical lesions in multiple scle- rosis. Nat Rev Neurol 2010;6:438-44.
28. Popescu V, Agosta F, Hulst HE, et al. Brain atrophy and lesion load predict long term disability in multiple sclerosis. J Neurol Neurosurg Psychiatry 2013;84:1082-91.
29. Lagan `a M, Rovaris M, Ceccarelli A, et al. DTI parameter optimisa- tion for acquisition at 1.5T: SNR analysis and clinical application.
Comput Intell Neurosci 2010;2010:23.
30. Werring DJ, Clark CA, Barker GJ, et al. Diffusion tensor imaging of lesions and normal-appearing white matter in multiple sclerosis.
Neurology 1999;52:1626-32.
31. Huang J, Liu Y, Zhao T, et al. White matter microstructural alter- ations in clinically isolated syndrome and multiple sclerosis. J Clin Neurosci 2018;53:27-33.
32. Preziosa P, Rocca MA, Mesaros S, et al. Intrinsic damage to the major white matter tracts in patients with different clinical pheno- types of multiple sclerosis: a voxelwise diffusion-tensor MR study.
Radiology 2011;260:541-50.
33. Roosendaal SD, Geurts JJG, Vrenken H, et al. Regional DTI differ- ences in multiple sclerosis patients. Neuroimage 2009;44:1397-403.
34. Bodini B, Khaleeli Z, Cercignani M, et al. Exploring the relation- ship between white matter and gray matter damage in early pri- mary progressive multiple sclerosis: an in vivo study with TBSS and VBM. Hum Brain Mapp 2009;30:2852-61.
35. Schoonheim MM, Vigeveno RM, Rueda Lopes FC, et al. Sex- specific extent and severity of white matter damage in multiple sclerosis: implications for cognitive decline. Hum Brain Mapp 2014;35:2348-58.
36. Rovaris M, Gass A, Bammer R, et al. Diffusion MRI in multiple sclerosis. Neurology 2005;65:1526-32.
Supporting Information
Additional supporting information may be found online in the Supporting Information section at the end of the article.
Supplementary Material