agronomy
Article
Extension of Aquaponic Water Use for NFT Baby-Leaf Production: Mizuna and Rocket Salad
Carlo Nicoletto1,*ID, Carmelo Maucieri1, Alex Mathis2, Zala Schmautz2ID, Tamas Komives3,4, Paolo Sambo1ID and Ranka Junge2ID
1 Department of Agriculture, Food, Natural Resources, Animals and Environment—University of Padova, Campus of Agripolis, 35122 Legnaro (PD), Italy; carmelo.maucieri@unipd.it (C.M.);
paolo.sambo@unipd.it (P.S.)
2 Institute of Natural Resource Sciences, Campus Grüental, Zurich University of Applied Sciences, 8400 Wädenswil, Switzerland; alex.mathis@zhaw.ch (A.M.); zala.schmautz@zhaw.ch (Z.S.);
ranka.junge@zhaw.ch (R.J.)
3 Plant Protection Institute, Hungarian Academy of Sciences, Centre for Agricultural Research, Herman Otto 15, 1022 Budapest, Hungary; komives.tamas@agrar.mta.hu
4 Faculty of Agricultural Science, Esterhazy Karoly University, Matrai ut 36, 3200 Gyongyos, Hungary
* Correspondence: carlo.nicoletto@unipd.it; Tel.: +39-049-827-2826
Received: 16 April 2018; Accepted: 14 May 2018; Published: 17 May 2018
Abstract: Aquaponics is a recirculating technology that combines aquaculture with hydroponics.
It allows nutrients from fish waste to feed plants and thus saves water and nutrients. However, there is a mismatch between the nutrients provided by the fish waste and plant needs. Because of this, some nutrients, notably N, tend to accumulate in the aquaponic water (APW or AP water).
The aim of this study was to investigate how APW, which is depleted of P and K but still rich in N, could be further utilized. APW was used in a mesocosm and compared with APW from the same source that had been supplemented with macro-nutrients (complemented AP water or CAPW) and a hydroponic control (HC). Mizuna (M) and rocket salad (R) were used as short-cycle vegetable crops in a NFT system. The results revealed that the low production potential of APW was mainly caused by the lack of P and K. If these were supplemented, the yields were comparable to those in the HC.
M yield in CAPW was significantly higher than that of HC, probably due to biostimulant effects connected to the organic components in the water as a result of fish farming. Water type, cultivation density, and intercropping significantly influenced the qualitative characteristics of the crop in terms of antioxidant compounds and minerals. Nitrate content in vegetables was lower than European regulation limits. The extended use of APW is viable if the missing nutrients are supplemented;
this could be a strategy to increase the efficiency of water and nitrogen use, while further reducing environmental impact.
Keywords: biomass yield; nutritional quality; sustainability; vegetables intercropping; secondary metabolites; nutrient film technique
1. Introduction
Aquaculture is perceived to have the greatest potential for meeting the growing demand for aquatic food [1]. It is estimated that a minimum of an additional 40 million tons of aquatic food will be required by 2030 to maintain current per capita consumption. Traditional, non-recirculating aquaculture systems require large amounts of high quality water and emit huge amounts of wastewater that is rich in nutrients. Aquaponics (AP), the combined culture of fish and plants in closed recirculating systems [2], is one of the solutions to both of these problems [3,4]. AP has received considerable
Agronomy2018,8, 75; doi:10.3390/agronomy8050075 www.mdpi.com/journal/agronomy
Agronomy2018,8, 75 2 of 18
attention due to its potential to sustain water quality, minimize water exchange, reduce the use of water, and increase the productivity by yielding fresh healthy fish, vegetables, fruits, and herbs [5–7].
In aquaponics, the cultivation of plants is performed in different soilless systems that use and recirculate the water from the fish farming [4,8,9]. In a closed loop aquaponics system, all of the water recirculates between the aquaculture and hydroponic parts of the system. In an open-loop (or uncoupled) system, only a portion of the aquaculture water is used for aquaponics and is not recycled back to the fish compartment [10]. The main challenge in closed loop aquaponics is to maintain optimal conditions for fish and plants, since the requirements of both compartments are different.
If the optimum ratio between daily feed input and plant growing area is maintained, the aquaculture effluent provides most of the nutrients required by the plants [11]. However, this ratio depends on many factors and changes over time. Even if there is a mismatch between the water composition requirements of the plants and the fish from the very beginning of cultivation [12], this will not become obvious if there are only a few plants or the cultivation periods are very short. Because there is a mismatch between the nutrients provided by the effluent from the fish compartment and the requirements of the plants, the system will limit plant growth over time (usually as a result of deficiencies in P and/or K) [13]. This causes the remaining N, and other ions, to accumulate in the system water [12], increasing total salinity levels. In this case, it is necessary to either reduce the fish load, which is undesirable, or partially replace the system water. Another option for maintaining a suitable equilibrium in the system would be to introduce a desalination step [14], but this prospect has not yet been tested in practice. The option of removing and replacing some of the recirculation water entails discharging water with high levels of potentially valuable N. Information on further use of this water for growing vegetables is very limited and this could represent the missing opportunity that further increases the efficiency of water and nutrient use.
While different vegetable species, mainly lettuce, water spinach, basil, tomato, and chicory, have been investigated in AP [4,5,15] very few studies have been carried out to evaluate microgreens and baby-leaf production. Consumption of microgreens and baby-leaf is increasing worldwide [16–18], and they can provide a substantial proportion of the recommended dietary allowance of a number of healthy compounds (ascorbic acid, thiamin, riboflavin, and a range of minerals) [19]. These products, which are characterized by a very short growth cycle might, therefore, be able to adapt very well to the use of water derived from AP systems. Furthermore, shortly after germination, the young plants can still use some of the nutrients provided in the seed and thus there is a delay before their growth becomes limited.
The aim of this study was to investigate the further utilization of AP system water that is depleted of P and K, but still rich in N. This system water (AP water or APW) was used in an AP mesocosm and compared with water from the same source that was supplemented with macro-nutrients (complemented AP water or CAPW), and a hydroponic control (HC). Mizuna (M) and rocket salad (R) were used as short-cycle vegetables crops in a Nutrient Film Technique (NFT) system.
2. Materials and Methods
2.1. Experiment Set-Up
Experiments were conducted in a foliar-tunnel greenhouse at the Zurich University of Applied Sciences (ZHAW) in 2017. Temperature and light intensity data during the two cultivation cycles are shown in Figure1. Nine mesocosm systems consisting of one tank each (275 L) and 4 NFT channels for vegetable cultivation (Figure2) were used for this experiment.
Agronomy2018,8, 75 3 of 18
Agronomy 2018, 8, x FOR PEER REVIEW 3 of 19
Figure 1. Meteorological conditions recorded during two growth cycles: temperature (A) and irradiance values (B) obtained from Zurich University of Applied Sciences (ZHAW) meteorological station.
Figure 2. Overview of the experimental design (a) and a single cultivation mesocosms (b).
The water (1.65 m3) from an already existing recirculating AP system (150 pangasius fish with an average weight of 300 g each in a tank of 3 m3 and 7.6 m2 planted area with a complete AP water volume of 7 m3) was diverted to operate the mesocosm AP systems. The AP water (APW), which contained almost exclusively nitrate nitrogen, was compared with the following: the same water supplemented with P and K plus meso- and micro-nutrients (CAPW); and a hydroponic control characterized by the same content of nitric nitrogen present in fish water with the same nutrients added as the supplemented fish water (HC). The three nutrient solutions (APW, CAPW, and HC) were compared using a randomized complete block design with three replicates; the nutrient solutions characteristics are summarized in Table 1.
Table 1. Chemical composition of the nutrient solutions in the experiment (target values). CAPW:
complemented aquaponic water; APW: aquaponic water; HC: hydroponic control; EC: electric conductivity.
Nutrient Solution
N-NH4 N-NO2 N-NO3 K P-PO43 Ca S-SO42− Mg pH EC
(mg L−1) (µS cm−1)
HC 0 0 65 120 25 66 23.4 20 7.87 1718
APW 0.075 0.023 63.5 0.078 1.55 66 27.6 21 7.79 824
CAPW 0.075 0.023 63.5 120 25 66 23.4 20 7.13 1680
0 1000 2000 3000 4000 5000 6000
24-feb 01-mar 06-mar 11-mar 16-mar 21-mar 26-mar 31-mar 05-apr 10-apr 15-apr 20-apr 25-apr 30-apr
Irradiance (W m-2)
0 5 10 15 20 25 30 35
24-feb 01-mar 06-mar 11-mar 16-mar 21-mar 26-mar 31-mar 05-apr 10-apr 15-apr 20-apr 25-apr 30-apr
Temperature (°C)
Tmin Tmax
A B
1stcycle 2ndcycle
1stcycle 2ndcycle
(a) (b)
rocket salad
mizuna
Water tank (275 L) HC = hydroponic control APW = aquaponic water CAPW = corrected aquaponic water
intercropping
HC APW CAPW
HC APW CAPW HC APW CAPW
R1 R2 R3 R1 R2 R3 R1 R2 R3
Figure 1.Meteorological conditions recorded during two growth cycles: temperature (A) and irradiance values (B) obtained from Zurich University of Applied Sciences (ZHAW) meteorological station.
Agronomy 2018, 8, x FOR PEER REVIEW 3 of 19
Figure 1. Meteorological conditions recorded during two growth cycles: temperature (A) and irradiance values (B) obtained from Zurich University of Applied Sciences (ZHAW) meteorological station.
Figure 2. Overview of the experimental design (a) and a single cultivation mesocosms (b).
The water (1.65 m3) from an already existing recirculating AP system (150 pangasius fish with an average weight of 300 g each in a tank of 3 m3 and 7.6 m2 planted area with a complete AP water volume of 7 m3) was diverted to operate the mesocosm AP systems. The AP water (APW), which contained almost exclusively nitrate nitrogen, was compared with the following: the same water supplemented with P and K plus meso- and micro-nutrients (CAPW); and a hydroponic control characterized by the same content of nitric nitrogen present in fish water with the same nutrients added as the supplemented fish water (HC). The three nutrient solutions (APW, CAPW, and HC) were compared using a randomized complete block design with three replicates; the nutrient solutions characteristics are summarized in Table 1.
Table 1. Chemical composition of the nutrient solutions in the experiment (target values). CAPW:
complemented aquaponic water; APW: aquaponic water; HC: hydroponic control; EC: electric conductivity.
Nutrient Solution
N-NH4 N-NO2 N-NO3 K P-PO43 Ca S-SO42− Mg pH EC
(mg L−1) (µS cm−1)
HC 0 0 65 120 25 66 23.4 20 7.87 1718
APW 0.075 0.023 63.5 0.078 1.55 66 27.6 21 7.79 824
CAPW 0.075 0.023 63.5 120 25 66 23.4 20 7.13 1680
0 1000 2000 3000 4000 5000 6000
24-feb 01-mar 06-mar 11-mar 16-mar 21-mar 26-mar 31-mar 05-apr 10-apr 15-apr 20-apr 25-apr 30-apr
Irradiance (W m-2)
0 5 10 15 20 25 30 35
24-feb 01-mar 06-mar 11-mar 16-mar 21-mar 26-mar 31-mar 05-apr 10-apr 15-apr 20-apr 25-apr 30-apr
Temperature (°C)
Tmin Tmax
A B
1stcycle 2ndcycle
1stcycle 2ndcycle
(a) (b)
rocket salad
mizuna
Water tank (275 L) HC = hydroponic control APW = aquaponic water CAPW = corrected aquaponic water
intercropping
HC APW CAPW
HC APW CAPW HC APW CAPW
R1 R2 R3 R1 R2 R3 R1 R2 R3
Figure 2.Overview of the experimental design (a) and a single cultivation mesocosms (b).
The water (1.65 m3) from an already existing recirculating AP system (150 pangasius fish with an average weight of 300 g each in a tank of 3 m3and 7.6 m2planted area with a complete AP water volume of 7 m3) was diverted to operate the mesocosm AP systems. The AP water (APW), which contained almost exclusively nitrate nitrogen, was compared with the following: the same water supplemented with P and K plus meso- and micro-nutrients (CAPW); and a hydroponic control characterized by the same content of nitric nitrogen present in fish water with the same nutrients added as the supplemented fish water (HC). The three nutrient solutions (APW, CAPW, and HC) were compared using a randomized complete block design with three replicates; the nutrient solutions characteristics are summarized in Table1.
Table 1. Chemical composition of the nutrient solutions in the experiment (target values).
CAPW: complemented aquaponic water; APW: aquaponic water; HC: hydroponic control; EC:
electric conductivity.
Nutrient Solution
N-NH4 N-NO2 N-NO3 K P-PO43 Ca S-SO42− Mg pH EC
(mg L−1) (µS cm−1)
HC 0 0 65 120 25 66 23.4 20 7.87 1718
APW 0.075 0.023 63.5 0.078 1.55 66 27.6 21 7.79 824
CAPW 0.075 0.023 63.5 120 25 66 23.4 20 7.13 1680
Agronomy2018,8, 75 4 of 18
The nutrient solutions were prepared according to the Resh (2012) method for leafy vegetables and the composition was calculated using free HydroBuddy software [20]. The amount of nutrient supplementation needed to reach target values was obtained using Iron DTPA and Multi Micro Mix (Ökohum GmbH, Herrenhof, Switzerland), Krista SOP, and Krista MKP (Yara UK Limited, Grimsby, UK), potassium nitrate (Haifa Chemicals, Ltd., Haifa, Israel), and magnesium sulphates (K + S Kali GmbH, Kassel, Germany). The three nutrient solutions allowed for the evaluation of the effect of nutrient supply in mineral form and/or organic form.
2.2. Plant Material and Samplings
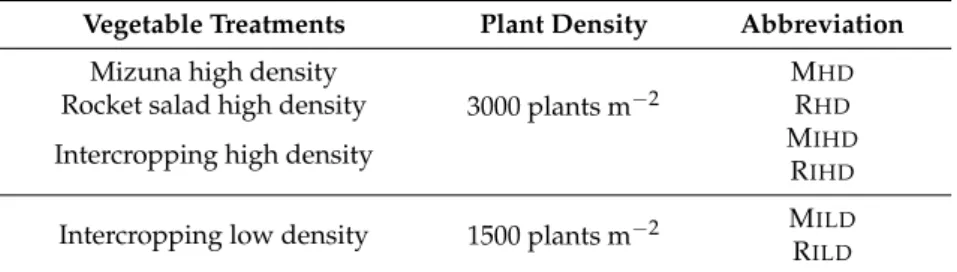
Rocket salad (Eruca vesicaria: R) and mizuna (Brassica rapaL. spp.Nipposinica: M) were grown for two consecutive growth cycles (2 February–3 March 2017; 3 March–30 April 2017). In order to evaluate the suitability of these species for the aquaponics cultivation, different seed densities and intercropping of both plants were tested. The four NFT channels in each system were prepared as follows: high density sowing (3000 plants m−2) for rocket salad (RHD) and mizuna (MHD); high density mizuna and rocket salad intercropping (MIHDand RIHD); low density mizuna and rocket salad intercropping (MILDand RILD) resulting in a total of 1500 plants m−2(Table2) and obtaining six vegetable treatments.
Table 2.Vegetable treatments and their abbreviations.
Vegetable Treatments Plant Density Abbreviation Mizuna high density
3000 plants m−2
MHD
Rocket salad high density RHD
Intercropping high density MIHD
RIHD
Intercropping low density 1500 plants m−2 MILD
RILD
The seeds were sown using a self-constructed sowing device on a synthetic carpet (80% viscose and 20% polyester—Growfelt, UK) placed in the bottom of the NFT channels and kept moist until germination. After this, the automatic irrigation system was activated for three daily periods of one hour each (9.00–10.00; 12.00–13.00; 16.00–17.00). During the crop cycle, the evapotranspired water was replaced every second day with fresh water and the amount of water added was recorded.
Non-destructive plant measurements such as plant height and chlorophyll content values (Chlorophyll meter SPAD-502 Konica Minolta) were performed three times a week. At the end of the baby-leaf growth cycle (plant height equal to 100–120 mm), the total yield and dry matter (65 ◦C) were determined. In addition, plant samples were taken in order to perform qualitative analyses in triplicate at the laboratories of the University of Padua (Italy).
2.3. Water Quality Monitoring
The nutrient solution was monitored three times a week by measuring pH and electric conductivity (EC) with a portable multi-parameter meter (HQ40d Portable Multi-Parameter Meter, Hach Lange GmbH, Düsseldorf, Germany). Three times a week, the levels of nitrate nitrogen (N-NO3−) were determined photometrically (cuvette test LTK339, Hach Lange GmbH, Germany). Samples were taken three times a week during the entire experiment for quantitative determination of Na+, Mg2+, K+, Ca2+, Cl−, NO3−, PO43−, and SO42−using ion chromatography (930 Compact IC flex).
2.4. Extraction of Phenols for Analysis
Freeze-dried samples of baby-leaf salads (0.2 g) were homogenized in methanol (20 mL) using an Ultra Turrax T25 at 13.500 rpm until a uniform consistency was achieved. Samples were filtered (filter
Agronomy2018,8, 75 5 of 18
paper, 589 Schleicher) and appropriate aliquots of the extracts were analyzed using the Folin–Ciocalteu (FC) assay for total phenol (TP) content, and ferric reducing antioxidant power (FRAP) assay was used for measuring total antioxidant activity. For each sample, extractions and analyses were performed in triplicate.
2.5. Determining Total Phenols Using the Folin–Ciocalteu Assay
The TP content was determined using the FC assay with gallic acid as a calibration standard in a Shimadzu UV-1800 spectrophotometer (Shimadzu Scientific Instruments Inc., Columbia, MD, USA). The FC assay was carried out by pipetting 200µL of extract into a 10 mL polypropylene tube.
This was followed by the addition of 1 mL of FC reagent. The mixture was vortexed for 30 s, and then 800µL of filtered 20% sodium carbonate solution was added 1 min later. After a further 8 min, the FC reagent was added. This was recorded as time zero; sodium carbonate was then added and the mixture was vortexed for 30 s. After 2 h at room temperature, the absorbance of the colored reaction product was measured at 765 nm. The content of TP in the extracts was calculated from a standard calibration curve, calculated for different concentrations of gallic acid, ranging from 0 to 600µg mL−1 (correlation coefficient:R2: 0.9982). The results were expressed as mg of gallic acid equivalent per kg (mg GAE kg−1) of dry matter [21].
2.6. Determining Total Antioxidant Activity Using Ferric Reducing Antioxidant Power
The Ferric Reducing Antioxidant Power (FRAP) reagent was prepared freshly, so that it contained 1 mM 2,4,6-tripyridyl-2-triazine and 2 mM ferric chloride in 0.25 M sodium acetate at pH 3.6 [22].
A 100µL aliquot of the methanol extract, prepared as described above, was added to 1900µL of FRAP reagent and thoroughly mixed. After leaving the mixture at 20◦C for 4 min, the absorbance at 593 nm was determined. Calibration was made against a standard curve (0–1200µg mL−1ferrous ion) produced by the addition of freshly prepared ammonium ferrous sulfate. FRAP values were calculated in triplicate as mg mL−1ferrous ion (ferric reducing power) and are presented as mg of Fe2+E (ferrous ion equivalent) kg−1dw.
2.7. Quantitative Determination of Anions and Cations Using Ion Chromatography (IC)
IC was performed using an ICS-900 ion chromatography system (Dionex Corp., Milan, Italy) equipped with a dual piston pump, a model AS-DV autosampler, an isocratic column at room temperature, a DS5 conductivity detector, an AMMS 300 anion suppressor (4 mm), and a CMMS 300 cation suppressor (4 mm). Chromeleon 6.5 Chromatography Management Software (Dionex Corp., Milan, Italy) was used to control the system and process the data. A Dionex Ion-Pac AS23 (Dionex Corp., Milan, Italy) analytical column (4 mm×250 mm) and a guard column (4 mm×50 mm) were used for anion separation, whereas a Dionex IonPac CS12A 23 (Dionex Corp., Milan, Italy) analytical column (4 mm×250 mm) and a guard column (4 mm×50 mm) were used for cation separations.
The eluent consisted of 4.5 mM sodium carbonate and 0.8 mM sodium bicarbonate at a flow rate of 1 mL min−1for anions and 20 mM methanesulfonic acid at the same flow rate for cations. Anions and cations were quantified after calibration. Different concentrations of Dionex solutions containing seven anions and five cations were used as standards, and the calibration curves were generated for concentrations ranging from 0.4 mg L−1to 20 mg L−1(anions) and from 0.5 mg L−1to 50 mg L−1 (cations). Cations and anions (UNI EN12014-2) were quantified.
2.8. Statistical Analysis
The data were analyzed using analysis of variance (ANOVA) and in the case of a significant F-value, the means were compared using Tukey’s Honest Significant Difference (HSD) test.
Agronomy2018,8, 75 6 of 18
3. Results
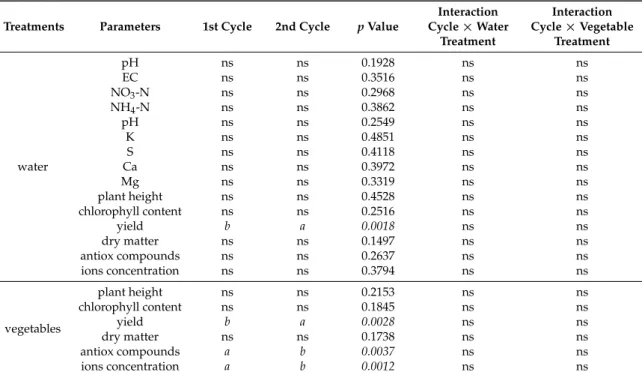
From a preliminary ANOVA statistical analysis, it was established that there were no significant differences between the two crop cycles that were carried out in each of the tested systems in terms of almost all of the evaluated parameters (Table3). The pattern for each examined trait was not affected by growth cycle, therefore, it was considered appropriate to report data from both crop cycles to highlight the effect of the crop cycle on the absolute values for each parameter and not on the individual patterns.
Table 3. Statistical analysis (ANOVA) overview of the two growth cycles, comparing water and vegetables traits.
Treatments Parameters 1st Cycle 2nd Cycle pValue
Interaction Cycle×Water
Treatment
Interaction Cycle×Vegetable
Treatment
water
pH ns ns 0.1928 ns ns
EC ns ns 0.3516 ns ns
NO3-N ns ns 0.2968 ns ns
NH4-N ns ns 0.3862 ns ns
pH ns ns 0.2549 ns ns
K ns ns 0.4851 ns ns
S ns ns 0.4118 ns ns
Ca ns ns 0.3972 ns ns
Mg ns ns 0.3319 ns ns
plant height ns ns 0.4528 ns ns
chlorophyll content ns ns 0.2516 ns ns
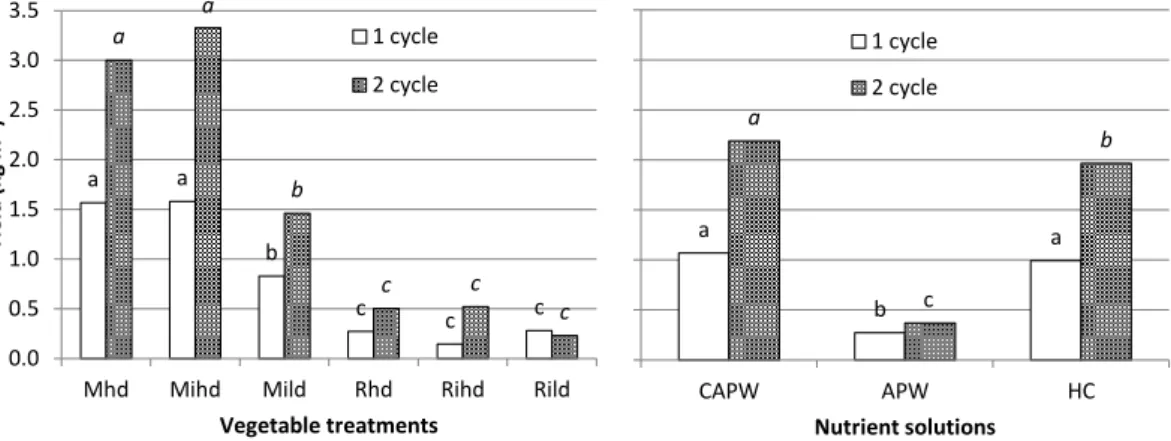
yield b a 0.0018 ns ns
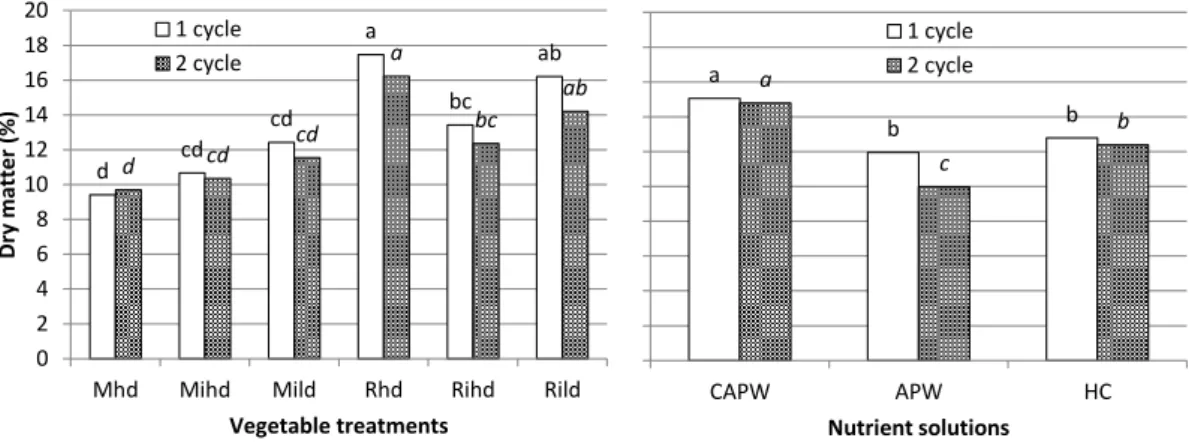
dry matter ns ns 0.1497 ns ns
antiox compounds ns ns 0.2637 ns ns
ions concentration ns ns 0.3794 ns ns
vegetables
plant height ns ns 0.2153 ns ns
chlorophyll content ns ns 0.1845 ns ns
yield b a 0.0028 ns ns
dry matter ns ns 0.1738 ns ns
antiox compounds a b 0.0037 ns ns
ions concentration a b 0.0012 ns ns
Values with different letters are significantly different withp< 0.05 based on a Tukey Honest Significant Difference (HSD) test. ns: not significant.
3.1. Nutrient Solutions
Water consumption during both of the crop cycles was higher for HC and CAPW than that of APW. In the HC and CAPW systems, 213 and 218 L water, respectively, had to be replaced during the first cycle, while in the APW system, only 182 L were replaced; the same pattern was recorded during the second cycle, albeit with generally lower values: 182, 177, and 161 L, respectively, for the HC, CAPW, and APW systems.
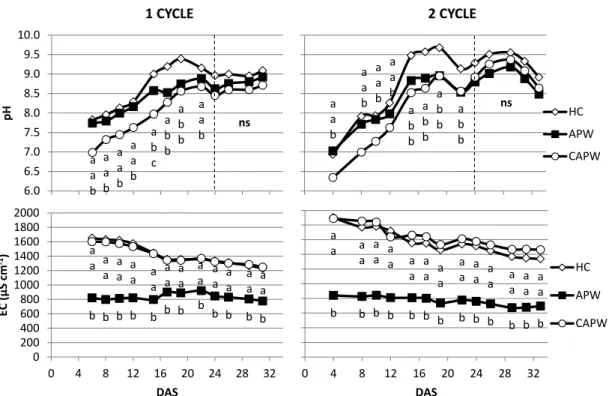
The pH values during both cycles increased from near neutral values to basic (~9.0) in the final stages of the experiment (Figure3). There were statistically significant differences between the nutrient solutions, especially in the first phase of the crop cycle. The breakdown threshold was recorded 24 days after seeding (DAS), after which there were no differences in pH values. The pH was consistently the highest in the HC system. The levels of electrical conductivity (EC) decreased in the HC and CAPW systems, in contrast to the APW system, where the EC remained fairly stable during both crop cycles (Figure3). The APW system had the lowest EC values, close to 800µS cm−1in both crop cycles. The HC and CAPW system values exhibited an average EC decrease equal to 22% and 25.5%, respectively, in the 1st and 2nd cycles.
Agronomy2018,8, 75 7 of 18
Agronomy 2018, 8, x FOR PEER REVIEW 7 of 19
Figure 3. Effect of water treatment on pH and electric conductivity (EC) in both growth cycles.
Values with different letters on the same day after sowing (DAS) are significantly different with p <
0.05, based on Tukey HSD Test. HC: hydroponic control; APW: aquaponic water; CAPW:
complemented aquaponic water.
The concentrations of macronutrients changed during the crop cycle, and the data obtained reveal well defined patterns (Figure 4). In the initial phase of the crop cycle, nitrate-nitrogen concentrations were high: 67.8 mg L−1 and 100.1 mg L−1 for the 1st and 2nd cycles, respectively, whereas ammonium-nitrogen concentrations were low, 2.5 mg L−1 and 0.56 mg L−1 for the 1st and 2nd cycles, respectively. NO3-N values gradually decreased during the entire crop cycle, whereas NH4-N fluctuated at a low level, especially in the second half of the first crop cycle. The different nutrient solutions differed statistically after 18 and 15 DAS, respectively, in the 1st and 2nd cycles for NO3-N. The APW system had the highest NO3-N concentrations. The ammonium-nitrogen values were predominantly different in the first phase of the crop cycle, with a breakdown threshold identified after 20 and 15 DAS, respectively, for the 1st and 2nd cycles. Phosphorous concentration was extremely low in the APW nutrient solution, with values lower than 3.26 mg L−1 (Figure 4). It was higher in the HC and CAPW systems, but only in the first phase of both crop cycles (until 22 DAS and 14 DAS for the 1st and 2nd cycles, respectively), then, the values dropped and were comparable to those of the APW system. Finally, K concentration was found to be more or less constant throughout both crop cycles (Figure 4). A slight decrease in K concentration was recorded in the HC and CAPW systems in the final phase of cultivation, and it was very low in the APW system, with values lower than 20 mg L−1, 83.3% lower than target values.
a a b
a a b
a a b
a a b
a b c
a b b
a b b
a a b
6.0 6.5 7.0 7.5 8.0 8.5 9.0 9.5 10.0
0 4 8 12 16 20 24 28 32
pH
DAS
1 CYCLE
HC APW CAPW
b b b b b b b b b b b b a
a aa a a a
a a a
a a
a a
a a a
a a a
a a
a a
0 200 400 600 800 1000 1200 1400 1600 1800 2000
0 4 8 12 16 20 24 28 32
EC (µS cm-1)
DAS
HC APW CAPW
a a b
a a b
a a b
a a b
a b b
a b b
a b b
a b b
2 CYCLE
HC APW CAPW
a
a a
a a a a
a a a
a a a
a a a a
a a a a
a a a
a a b b b b b b b b b b b b b
0 4 8 12 16 20 24 28 32
DAS
HC APW CAPW ns
ns
Figure 3.Effect of water treatment on pH and electric conductivity (EC) in both growth cycles. Values with different letters on the same day after sowing (DAS) are significantly different withp< 0.05, based on Tukey HSD Test. HC: hydroponic control; APW: aquaponic water; CAPW: complemented aquaponic water.
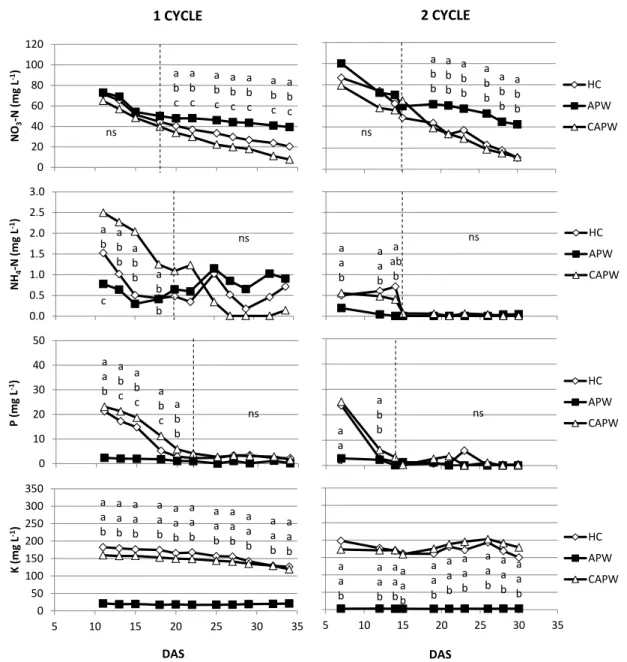
The concentrations of macronutrients changed during the crop cycle, and the data obtained reveal well defined patterns (Figure 4). In the initial phase of the crop cycle, nitrate-nitrogen concentrations were high: 67.8 mg L−1 and 100.1 mg L−1for the 1st and 2nd cycles, respectively, whereas ammonium-nitrogen concentrations were low, 2.5 mg L−1and 0.56 mg L−1for the 1st and 2nd cycles, respectively. NO3-N values gradually decreased during the entire crop cycle, whereas NH4-N fluctuated at a low level, especially in the second half of the first crop cycle. The different nutrient solutions differed statistically after 18 and 15 DAS, respectively, in the 1st and 2nd cycles for NO3-N. The APW system had the highest NO3-N concentrations. The ammonium-nitrogen values were predominantly different in the first phase of the crop cycle, with a breakdown threshold identified after 20 and 15 DAS, respectively, for the 1st and 2nd cycles. Phosphorous concentration was extremely low in the APW nutrient solution, with values lower than 3.26 mg L−1(Figure4). It was higher in the HC and CAPW systems, but only in the first phase of both crop cycles (until 22 DAS and 14 DAS for the 1st and 2nd cycles, respectively), then, the values dropped and were comparable to those of the APW system. Finally, K concentration was found to be more or less constant throughout both crop cycles (Figure4). A slight decrease in K concentration was recorded in the HC and CAPW systems in the final phase of cultivation, and it was very low in the APW system, with values lower than 20 mg L−1, 83.3% lower than target values.
Agronomy2018,8, 75 8 of 18
Agronomy 2018, 8, x FOR PEER REVIEW 8 of 19
Figure 4. Effect of water treatment on nitrogen, phosphorus, and potassium concentrations during both growth cycles. Different letters on the same DAS indicate significant differences with p < 0.05, based on Tukey HSD Test. HC: hydroponic control; APW: aquaponic water; CAPW: complemented fish water.
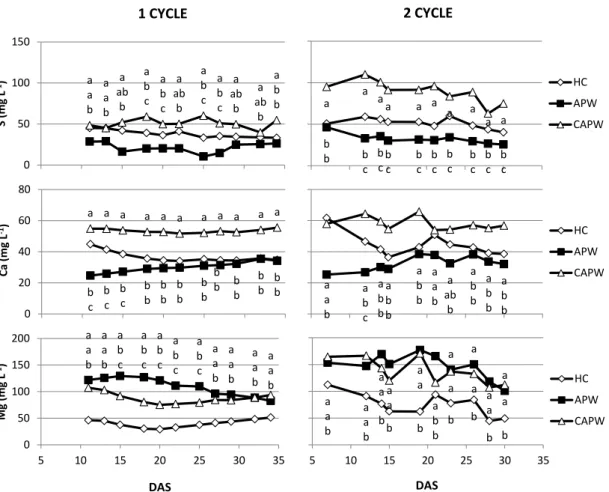
The concentrations of sulphur (S), calcium (Ca), and magnesium (Mg) were influenced by the water treatment and also differed between the crop cycles (Figure 5). In general, the concentration of S, Ca, and Mg fluctuated less in the first cycle than in the second one. The S content ranged from 10.3 to 59.7 mg L−1 in the first cycle, whereas in the second one, especially for CAPW, the values were higher and ranged between 25.4 and 109.8 mg L−1. The Ca content, comparable in both crop cycles, was higher in CAPW, whereas HC differed from APW only during the first part of the crop cycle.
Finally, the magnesium content was higher in HC and was statistically different from the other treatments during the middle phases of the first crop cycle; in the second cycle, APW never differentiated from CAPW.
a b c
a b c
a b c
a b c
a b c
a b c
a b c
0 20 40 60 80 100 120
NO3-N (mg L-1) a
b b
a b b
a b b
a b b
a b b
a b b
HC APW CAPW
1 CYCLE 2 CYCLE
ns ns
c b
a b a
b b
a b b a
b 0.0
0.5 1.0 1.5 2.0 2.5 3.0
NH4-N (mg L-1)
a a b
a a b
a ab
b
HC APW CAPW
ns ns
a a b
a b c
a b c a
b c
a b b 0
10 20 30 40 50
P (mg L-1)
a a b
a b b
HC APW ns CAPW
ns
a a b
a a b
a a b
a a b
a a b
a a b
a a b
a a b
a a b
a a b
a a b
0 50 100 150 200 250 300 350
5 10 15 20 25 30 35
K (mg L-1)
a a b
a a b
a a b a a b
a a b
a a b
a a b
a a b
a a b
a a b
5 10 15 20 25 30 35
HC APW CAPW
DAS DAS
Figure 4. Effect of water treatment on nitrogen, phosphorus, and potassium concentrations during both growth cycles. Different letters on the same DAS indicate significant differences withp< 0.05, based on Tukey HSD Test. HC: hydroponic control; APW: aquaponic water; CAPW: complemented fish water.
The concentrations of sulphur (S), calcium (Ca), and magnesium (Mg) were influenced by the water treatment and also differed between the crop cycles (Figure5). In general, the concentration of S, Ca, and Mg fluctuated less in the first cycle than in the second one. The S content ranged from 10.3 to 59.7 mg L−1in the first cycle, whereas in the second one, especially for CAPW, the values were higher and ranged between 25.4 and 109.8 mg L−1. The Ca content, comparable in both crop cycles, was higher in CAPW, whereas HC differed from APW only during the first part of the crop cycle. Finally, the magnesium content was higher in HC and was statistically different from the other treatments during the middle phases of the first crop cycle; in the second cycle, APW never differentiated from CAPW.
Agronomy2018,8, 75 9 of 18
Agronomy 2018, 8, x FOR PEER REVIEW 9 of 19
Figure 5. Effect of water treatment on sulphur, calcium, and magnesium concentrations during the growth cycles. Different letters on the same DAS indicate significant differences, with p < 0.05, based on Tukey HSD Test. HC: hydroponic control; APW: aquaponic water; CAPW: complemented aquaponic water.
3.2. Vegetables Species
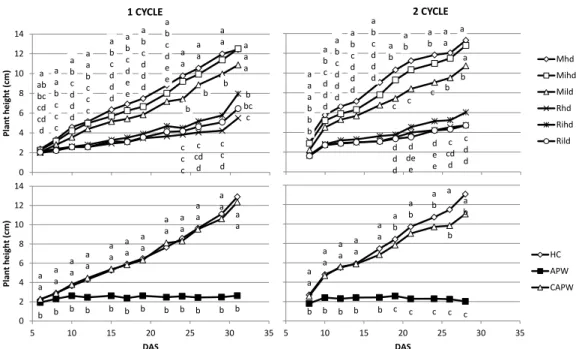
Mizuna (M) and rocket salad (R) are widely produced ready-to-eat baby leaves. When cultivated in soilless production systems, either in monocultures or intercropped, they differ in terms of several productive and qualitative aspects. Mizuna (M) plants were generally higher (Figure 6) and reached heights close to 12 cm in the final phase of both crop cycles; rocket salads reached heights of between 5.5 and 8.0 cm in the first crop cycle, but did not exceed 6 cm in the second cycle. Height was influenced by crop density and intercropping in both cultivation cycles;
however, plant density was the most significant parameter in determining the plant height. The type of nutrient solution also affected the plant height, which was higher in the HC and CAPW systems than the APW system. A slight deviation was observed between the two cultivation cycles, represented by the presence of significant differences in plant height in the 2nd cycle between the HC and CAPW systems after 18 DAS, which were not recorded in the 1st cycle. In the APW system, the height of the rocket salads did not exceed 3 cm.
Intercropping of M and R did not markedly affect the chlorophyll content (Figure 7). However, the effect of the nutritional solution was significant. Plants in the HC and CAPW systems always exhibited higher values than those grown in APW.
a a b
a a b
a ab
b a b c
a b c
a ab
b a b c
a b c
a ab b
a ab
b a b b
0 50 100 150
S (mg L-1)
b
b b
c b c b c
b c
b c
b c
b c
b c
b c a
a a
a a a a a
a a
HC APW CAPW
b c
b c
b c
b b
b b
b b
b b
b b b
b b b
b b a a a a a a a a a a a
0 20 40 60 80
Ca (mg L-1)
a a b
a b c
a b b a b b
a b b
a a b
a ab
b a b b
a b b
a b b
HC APW CAPW
a a b
a a b
a b c
a b c
a b c
a b c
a b c
a a b
a a b
a a b
a a b
0 50 100 150 200
5 10 15 20 25 30 35
Mg (mg L-1)
a a b
a a b
bb b a b b
b b b b a a a a
a a a
a
a a a
a a a
5 10 15 20 25 30 35
HC APW CAPW
DAS DAS
1 CYCLE 2 CYCLE
Figure 5. Effect of water treatment on sulphur, calcium, and magnesium concentrations during the growth cycles. Different letters on the same DAS indicate significant differences, withp< 0.05, based on Tukey HSD Test. HC: hydroponic control; APW: aquaponic water; CAPW: complemented aquaponic water.
3.2. Vegetables Species
Mizuna (M) and rocket salad (R) are widely produced ready-to-eat baby leaves. When cultivated in soilless production systems, either in monocultures or intercropped, they differ in terms of several productive and qualitative aspects. Mizuna (M) plants were generally higher (Figure6) and reached heights close to 12 cm in the final phase of both crop cycles; rocket salads reached heights of between 5.5 and 8.0 cm in the first crop cycle, but did not exceed 6 cm in the second cycle. Height was influenced by crop density and intercropping in both cultivation cycles; however, plant density was the most significant parameter in determining the plant height. The type of nutrient solution also affected the plant height, which was higher in the HC and CAPW systems than the APW system. A slight deviation was observed between the two cultivation cycles, represented by the presence of significant differences in plant height in the 2nd cycle between the HC and CAPW systems after 18 DAS, which were not recorded in the 1st cycle. In the APW system, the height of the rocket salads did not exceed 3 cm.
Intercropping of M and R did not markedly affect the chlorophyll content (Figure7). However, the effect of the nutritional solution was significant. Plants in the HC and CAPW systems always exhibited higher values than those grown in APW.