UNIVERSITY OF WEST HUNGARY
FACULTY OF AGRICULTURAL AND FOOD SCIENCES MOSONMAGYARÓVÁR
INSTITUTE OF AGRICULTURAL, FOOD AND ENVIRONMENTAL ENGINEERING
Director of the Doctoral School : Prof. Dr. Kuroli Géza
Univ. Professor, Doctor of MTA
Scientific Supervisor : Prof. Dr. Neményi Miklós
Univ. Professor, Doctor of MTA
HYDROLOGICAL BASICS OF THE SITE SPECIFIC PLANT PRODUKTION WITH SPECIAL REGARDS TO CSALLÓKÖZ
AND SZIGETKÖZ REGIONS
Prepared By
NAGY VILMOS
Mosonmagyaróvár
2004
1. The object of dissertation
1.1 Comparison of the measuring methods of the soil moisture
The University of West Hungary,Agr. and Food Science Faculty choose the location to compare and synchronize the values measured by the Inteligens sensor and Neutron sond in such way that they should be usable on both sides of Danube.
To check and evaulate the measured data of the Inteligens senzor as a new method.and to evaluate :
• accuracy
• usefullness
• economicallyfeasable
• speed etc.
1.2 Evaluation of the soilmoisture development
Similar locations of Csallokoz and Szigetkoz `s soil moisture household and its development be compared.Furthermore,in the four chosen locations of Szigetkoz the results of soil moisture measured data be evaulated to find usable way for the benefit of agriculture.
0 20 40 60 80 100 saturation, %
0
40
80
120
160
200
240
depth under soil surface, cm
19.7.2002 neutron probe kapacity method senzor i
2. The methods of research.
2.1 Comparison of the three soil moisture measuring methods.
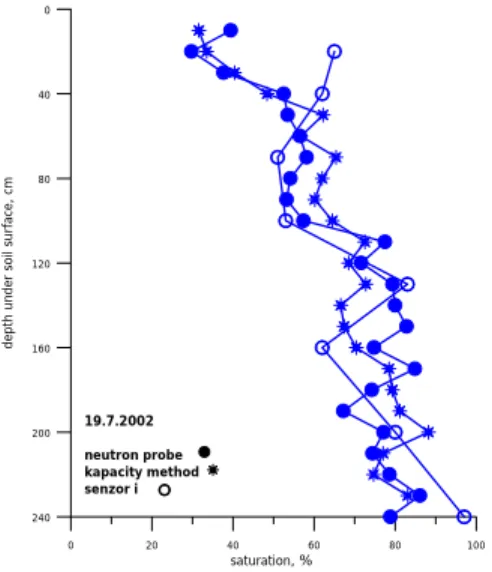
It was performed in the location chosen on the property of the University.The grafikons were compared based on 2002 data of soil moisture measured by the
instrument.By evaluating the data we obtained the correlation between them.
It was necessary to have the soil moisture in % of the volume to be comparable with the measured data of Agr. Techn., Food industry and Env.tech. Institute.It became essential to calibrate the Neutronsond.We took at locations in 10 cm layers undisturbed samples which was evaluated in detail by the Hydrologic Institute Soil Laboratory.The figure shows the curve and with its help we established the coeficients which make possible on measured inpulses, to calculate in % of volume.
Neutronsond capacity measure and I sensor measuring methods- comparison.
1. Fig.: Grafical comparison of the Neutronsond,Capacity measuring method and the I senzor method 2002.07.19.
(Moisture content in arable land water capacity %)
The correlation of the measurings is as follows :
Time of measuring Neutronsond I Senzor
Neutronsond Capacity measur. method Correlation coefficient r Correlation coefficient r 24. 05. 2002
06. 06. 2002 20. 06. 2002 19. 07. 2002 03. 08. 2002 16. 08. 2002 11. 10. 2002 15. 11. 2002
0. 943988 0. 935980 0. 864987 0. 897347 0. 850189 faulty
0. 926600 0. 937290
0, 826594 0. 850506 0. 859911 0. 909511 0. 909127 0. 906805 0. 892831 0.837918
1.table:The correlation and conection between three measuring met.
The values between the measuring with capacity measuring and neutronsond have a close connection and the ratio of correlation is also acceptable in acccordance with international tech. Literature. The values of correlation are 0,85 to 0,90.Our measurement, 0,82 to0,91 are corresponding to the mentioned literature.
The previous table shows the correlation between the data of soil measure of the I senzor and Neutronsond after its repair of the instrument and undisturbed samples evaluated in the laboratory.The values of arable lands water capacity according the single layers were established in Slovak Academy of Sc Hydrological Institute, Pedological Laboratory for the location of the University propejtty.These data were analysed.
After eliminating incorrect data,the corrected correlation coefficients are 0,85 to0,94 which indicates a very close connection.
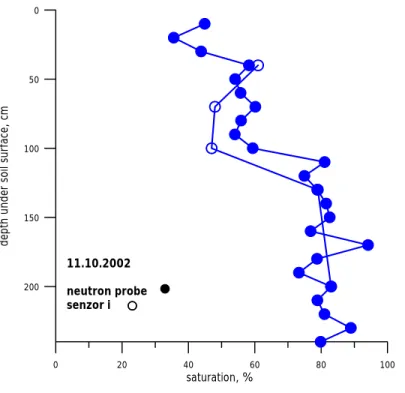
The Neutrosond and the I senzor method comparison after repeated measuring hydrofizical factors and correcting the I senzor,the folloiwing Fig. 2 shows the results.
0 20 40 60 80 100 saturation, %
0
50
100
150
200
depth under soil surface, cm
11.10.2002 neutron probe senzor i
2. Fig.: Neutronsond and I senzor measuring methods graphical comparison 2002.10.11.
(Moisture content in arable lands water capacity %)
The three measuring methods comparison shows that the hydromolecular polarization measuring method satisfies the required accuracy. The messuring device can store the results in this memory bank for the whole year and does not need a transportation or personel, can be transferred to computer processing.The time of measurment can be established in advance, by radiowave transmitted anywere. This circumstance is advantageous to the two other methods in our technical requirements. The measuring method is connected with computer.Soil moisture regulating program with this can direct whole complex in the desired direction.
.
The disadvantages of hydromolecular polarisation measuring method (I senzor) are as follows (1 ) one time installation is extremely expensive. (2) it is necessary to establisch the whole lads water capacity which is additional work.(3) the measuring device must be left in place which is a security risk (steeling,demaging).(4) special pipe systém has to be installed which has to be protected against machines and tools used during cultivation and harvest..
2.2 Evaluation of soil moisture development(change)
The second aim of the dissertation is to compare similar location in Csallokoz and Szigetkoz concerning seasonal development of soil moisture household.In the four chosen Szigetkoz location,the soil moisture measuring should be conducted and the result should be utilised for the agriculture.
For these is neccesary to evaluate the seasonal soil moisture developments influencing factors as :
The root region depth and width which is changing during development-at standard condition gradually increasing.In general can reach 180 cm depth and 120cm width.
The root growing speed is depending on the plant species.
The roots layout in space.The roots do not spread evenly in the soil.It grows in the direction of greater moisture and in the direction of plant ax.At corn, after 2 months there are no more wet spots neither close or far from plant.This shows that at densely seeded plant a homogenity develops very soon. Off course, this does not apply for irrigation and when the soil physical characteristic substantially changes.For instance compacted, watertide insulated soil etc.
The roots vretical distribution.Several authors established that the roots in an exponential way are diminishing by depth.This applies mainly to culture plants.
Important factor is the plants adaptability potential.The plants at ideal conditions develop at the begining of vegetation period and their conditionalis weeker in dry period.
The soil mechanical quality in case below the arable layer soil density, the roots develop 80% in the upper layer.
The soil temperature is directly related to roots depth and intensity for water and food absorption intensity.
Comparison of Nagybodak and Dunasziget locations water household in the vegetation period
Both locations are in the floodprone forested area on left and right side of the Danube in Slovakia (Csallokoz) and Hungary (Szigetkoz).
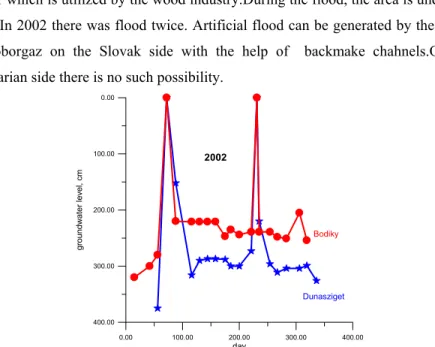
The characteristic soil of the floodprone forested area is clay-sandy forested soil which can be found allover in the alluvial plain. Characteristic wood is the Canadian poplar which is utilized by the wood industry.During the flood, the area is under 2m flood.In 2002 there was flood twice. Artificial flood can be generated by the sluice at Doborgaz on the Slovak side with the help of backmake chahnels.On the Hungarian side there is no such possibility.
0.00 100.00 200.00 300.00 400.00
day 0.00
100.00
200.00
300.00
400.00
groundwater level, cm
Bodiky
Dunasziget 2002
3. Fig.: Of soil water elevation movment at the two locations.
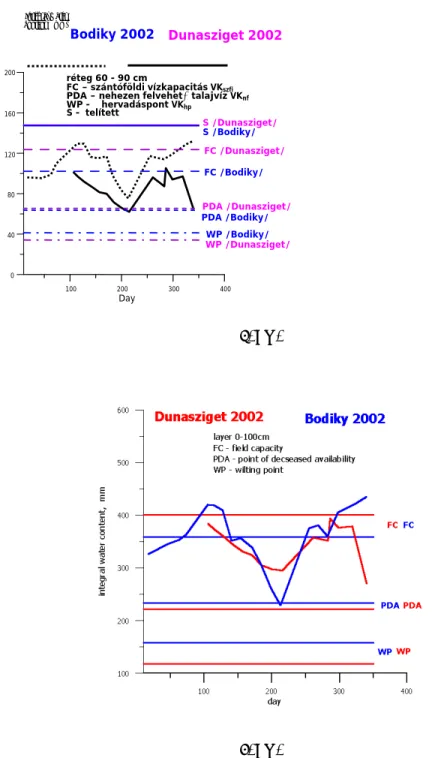
The folowing 4 figures show the soil moisture by soil layers in both locations during the vegetation period and their change.The three hydrolimits are also indicated.
4. Fig
5. Fig.
100 200 300 400
Day.
0 40 80 120 160 200 Integral water content
(mm)
FC /Dunasziget/
PDA /Dunasziget/
réteg 30-60cm
FC – szántóföldi vízkapacitás VKszfi
PDA – nehezen felvehető talajvíz VKnf
WP – hervadáspont VKhp
S - telített
WP /Dunasziget/
FC /Bodiky/
PDA /Bodiky/
WP /Bodiky/
S /Dunasziget/S /Bodiky/
100 200 300 400
Day 40
80 120 160 200
FC /Dunasziget/
PDA /Dunasziget/
Dunasziget 2002
réteg 0-30cm
FC – szántóföldi vízkapacitás VKszfi
PDA - nehezen felvehető víz VKnf
WP – hervadáspont VKhp
S - telített
WP /Dunasziget/
FC /Bodiky/
PDA /Bodiky/
WP /Bodiky/
Bodiky 2002
S /Dunasziget/
S /Bodiky/
Integral water content (mm)
Bodiky 2002 Dunasziget 2002
6. Fig.
7. Fig.
100 200 300 400
Day
0 40 80 120 160 200
Integral water content (mm)
FC /Dunasziget/
PDA /Dunasziget/
réteg 60 - 90 cm
FC – szántóföldi vízkapacitás VKszfi
PDA – nehezen felvehető talajvíz VKnf
WP - hervadáspont VKhp
S - telített
WP /Dunasziget/
FC /Bodiky/
PDA /Bodiky/
WP /Bodiky/
S /Dunasziget/
S /Bodiky/
Bodiky 2002 Dunasziget 2002
In these figures the soil moisture is indicated in 0-30, 30-60, 60-90 cm layers including the hydrolimits and summarised water quantity for the whole year or for the vegetation period. In the whole year summary the content of moisture by the layers in vertical profile the gradual increase can be seen to late Fall, Winter and early Spring period.This is valid reversely for the vegetation period-that is the base of the next year water household (it is the proper previous saturation or future reserve).
On the four figures it is obvious that the soil noisture in 0-30 cm layer is substantially higher at Dunasziget than at Nagybodak.Explanation for this phenomenon is that at Nagybodak because of summer irrigation (flood from Doborgaz) the capillarity is working from the elevated soil moisture or an unknown compacted layer changes this layers water household.
These observations show that the data and evaluation can be used for the forest systems protection and also for increase yield in agriculture.
Comparison of Bacsfa and Halaszi locations water household in the vegetation period.
These locations are in an intensivly cultivated area .Therefore,a comparison of arable land will be treated about seasonal movement dynamic of soil moisture.
Fig. 8 . The movement of soil moisture level in locations Bacsfa and Halaszi.
The folowing three figures (Fig 9-11),the summary of soil moisture according the various depth soil layers for both locations are compared at vegetation period and changing.In the figures the three hydrolimits are also indicated.
100 200 300 400
day 0
40 80 120 160 200
integral water content, mm
FC PDA
Halaszi 2002
layer 0-30cm FC - field capacity
PDA - point of decseased availability WP - wilting point
S - saturated
WP FC PDA
WP
Báč 2002
SS
Fig . 9.
100 200 300 400 day
0 40 80 120 160 200
integral water content, mm
FC
PDA
Halaszi 2002
layer 30-60cm FC - field capacity
PDA - point of decseased availability WP - wilting point
S - saturated
WP FC PDA WP
Báč 2002
S S
Fig. 10.
100 200 300 400
day 0
40 80 120 160 200
integral water content, mm
FC
PDA
Halaszi 2002
layer 60 - 90 cm FC - field capacity
PDA - point of decseased availability WP - wilting point
S - saturated
WP FC
PDA WP
Báč 2002
S S
Fig . 11.
Since in Halaszi the 70-120 cm there is a compacted clay layer of various colors this prevents the vertical movement of soil moisture to a greater extent than in Bacsfa s sandy clay where the filtration speed is substantially greater.This results that in 60-90 cm layer more moisture is retained and in these parts the soil moisture reaches a higher level because it can not seep through into lover layers.At the figures we compared and evaulated the soil moisture development in both areas especially the root region development, max. water intake period for the various plant species.
We choose various alternatives the worst combination (tiny layer,greatest uptake of water) and seasonal similarity is striking from the view point of the moisture development.
From these comparisons we can establish retroactive the moisture development- This can be found exactly and-we can establish in which period what was the deficit in moisture,how much aditional water is needed for sufficient or ideal quantity of water for the specific plant. On the other hand, we can compute how much water is needed, respectively, how much water we hawe in reserve and how long the moisture will be sufficient for the plant in question. It can be found that which plant species can be cultivated in the area or additional irrigation when and in what quantity will be needed.
Comparison of the four Szigetkoz locations during 2002 vegetation period for evaluation of water household and vertical distribution of soil moisture development.
Comparison of thickness of soil layers are evaluated based on meteorological and climatological aspects and boundary of the layers are the breaking points of the Neutronsond measuring and the reduced volume and soil formation.
The calibration of the Neutronsonds were carried out by the co-workers of the Slovak Academy of Sc.,Hydrological Institute (taken undisturbed samples ) and in its pedological laboratorys methodology developed evaluation.Each location and measurement was evaluated to establish the necessary calibration curve and coefficient.
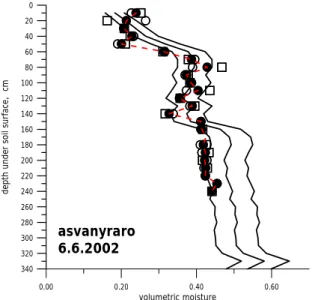
0.00 0.20 0.40 0.60
volumetric moisture 0
20 40 60 80 100 120 140 160 180 200 220 240 260 280 300 320 340
depth under soil surface, cm
asvanyraro 6.6.2002
Fig. 12 Neutronsond calibration of the Asvanyraro station The connecting line is the calibration curve.The curve was established from the undisturbed gravymetric
values. (Empty signs are the measurement and the filled-in signs are the average results)
The calibration curves given data served for evaluation of 2002 vegetation periods Neutronsond measurement.Furthermore the soil moisture vertical distibution were appraised with the help of calibration curves .
The soil moisture level change in the four Szigetkoz lokation in vegetation period 2002 is given as follows.
0.00 100.00 200.00 300.00 day
0.00
100.00
200.00
300.00
400.00
groundwater level, cm
Halászi Dunasziget
Dunaremete Ásványráró
Fig. 13 A The movement of the soil moisture level in Asvanyraro,
Dunaremete, Dunasziget and Halaszi location in the vegetation period of 2002.
The evaluation of the integrated water volume from the wiepoint of some hydrodinamic bordervalue in 2002 vegetacion period of the four Szigetkoz stacion.
The change of the chosen soil layers integrated water volume in 2002 vegetation period the hydrodinamic bordervalues (FC,PDA,WP) namely of the consumed water quantity of the plant. The graphical evaluation for the four Szigetkoz location in the uppermost layer is given.
The following four figures have the soil layers integrated water volume evaluation influenced by meteorologic and climatic coefficient with the hydrodinamic bordervalue (FC,PDA,WP) in the 2002 vegetation period at given four Szigetkoz location.
100 150 200 250 300 350 day
0 200 400 600
integral water content, mm
FC PDA
WP
Asvanyraro
layer 0-100cm FC - field capacity
PDA - point of decseased availability WP - wilting point
Fig. 14.
100 150 200 250 300 350
day 0
100 200 300 400 500
integral water content, mm
FC
PDA WP
Dunaremete
layer 0-60cm FC - field capacity
PDA - point of decseased availability WP - wilting point
Fig. 15.
100 150 200 250 300 350 day
0 200 400 600
integral water content, mm
FC
PDA
Dunasziget
layer 0-100cm FC - field capacity
PDA - point of decseased availability WP - wilting point
WP
Fig. 16.
100 150 200 250 300 350
day 0
100 200 300 400 500
integral water content, mm
FC
PDA
Halaszi
layer 0-100cm FC - field capacity
PDA - point of decseased availability WP - wilting point
WP
Fig. 17.
Based on these evaluations and comparisons can be established
the soil moisture development either for the whole vegetation period
or retroactive with the help of data basis to make any necessary
correction.We can use even to find out any reserves or retroactive
when and how much was missing.In precision farming it is essential
that we know what moisture content is ideal to develop any plants.
3. Resulc and conclusion.
3. 1 Based on comparing the three soil moisture method we established : 1, Hydromolecular polarization measuring method by name I senzor method is suited for soil moisture measuring.
2, Neutronsond and gravymetric measurings correlation is 0,85 to 0,94 which means that hydromolecular polarization measuring method fullfills the acuraccy requirement.
3, The measured soil moisture data can be stored in the memory data bank for a whole year which allows retroactive search for data..
4, The I senzor measures continuously which makes possible handling of data to any desired date.
5, The measured values can be transmitted to computer in modular form or by radio.
6, The soil moisture data measured by I senzor is expressed in % of arable lands water capacity.
7, The measuring method with a computer program can change directly the soil moisture by irigation device.
8, The measurment does not require neither transportation nor personel.
9, It is recomended to express the measured values in % of volumes because the data are in this way evaluated..
10, The disadvantages of the I senzor methods were described previously.
3.2 Measuring data for soil moisture
1, Used three hydrologic bordervalue (hydrolimit) which are:
2, Arable land water capacity (FC, VKszfi), difficult intake water (PDA, VKnf) and point of withering (WP, VKfp).
3, The result of measuring location in Csallokoz and Szigetkoz indicate similar seasonal soil moisture pattern.
4, Evaluated the integral water quantity change in vegetation period by all three hydrolimits.
5, Evaluated the usable integral water quantity in vegetation period on daily, decade,monthly max. water demand.
6, Compared the two areas (Csallokoz and Szigetkoz) for soil moisture household seasonal changes in intensive agricultural areas and in floodprone forested area.
7, Evaluated the change of soil moisture for affected soil layers from meteorological or climatological view point.Retroactiv the integreted usable soil moisture change for the whole vegetation period was investigated.
8, Based on given soil moisture (evaluated soil moisture measurement) establish how much was the excess or shortage in water.
9, Based on evaluation of measurements, it was determined retroactively when were the conditions of soil moisture ideal,limited or insufficient from the viewpoint of plant development..
10, Based on evaluation it can be establised in various cases that the vertical stratification from the view point of the pheno phase of the plant how far have usefull reserves of water or how much is the water shortage.
11, From the seasonal change of soil moisture can be established if it is suitable for various culture (the given soil) or which plant species can be cultivated with greatest advantage.
Finally, this evaluation put in data base gives a new perspective for the agriculture. Based on these data, a quick decision and adjustment is possible to create the most beneficial conditions for plant grow by achieving the greatest profit at the same time.
4. Further research possibilities.
The development of I semzor should be directed toward intensively cultivated land and eliminate the present difficulties in installing equipments and measuring in the field.
The soil moisture shold be expressed in volume % .
Further monitoring of soil moisture for chosen soil types and collecting data to enrich data basis which will create a wealth of information (character of soil type,seasonal change of soil moisture, local meteorological coefficient etc.) for improving crop yield, selecting appropriate plants, eliminating surplus or deficiency in water household.
, To use this potential for regional or state wide mapping
The tremendous amount of data must be organized into a GIS to be able of handling and using for the agricultural demand especially in precision farming.
Finally, the cooperation of the University of West-Hungary and the Slovak Academy of Sciensces, Hydrological Institute is an excellent example how we should jointly inprove the enviromental conditions including agricurtural problems for our common benefit in the European Unionon both sides of our common Hungarian-Slovak border.
5. Authors publications which are related to the theme of the dissertation.
1. ŠTEKAUEROVÁ V., NAGY V.: Influence of climate conditions on security necessary water for vegetation in various ecosystems. Pollution and water resource Columbia University Seminar Proceedings, The Hungarian Academy of Sciences, Department of Earth, Sciences and Agricultural Science, Budapest, Hungary, 2002, p. 324-337.
2. NAGY V., HOUŠKOVÁ B., SOBOCKÁ J., LICHNER L.: Sezónné variácie hydraulickej vodivosti vo vybraných druhoch pôd Žitného ostrova.
Acta Hydrologica Slovaca, A3, 2002, 2, s. 232-237.
3. LICHNER L., HOUSKOVÁ B., SOBOCKÁ J., NAGY V.:Priestorová a časová variabilita hydraulických vlastností pôdy. X. posterový deň ÚH SAV a GFÚ, ÚH S
4. ORFÁNUS T., NAGY V.: Priestorová organizovanosť vlhkosti v druhovo heterogénnych V Bratislava, 2002, s. 279-285. pôdach Záhorskej nížiny.
Prvé pôdoznalecké dni, Račková dolina, Výskumný ústav pôdoznalectva a ochrany pôdy, Bratislava, 2002
5. LICHNER L., HOUSKOKÁ B., NAGY V.: Variation of bypasing ratio in various field soils during a growing season. In: Gaál K. K., (ed.): CD Proc.
29 th Scientific Days in Mosonmagyaróvár, Mosonmagyaróvár, 2002, 5, s.
(CD).
6. ORFÁNUS T., NAGY V.: Variability of soil moisture in the field with heterogeneous soil cover. In: Gaál K. K. (ed.): CD Proc. 29th Scientific Days in Mosonmagyaróvár, Mosonmagyaróvár, 2002, s. 1CD.
7. ŠTEKAUEROVÁ V., NAGY V.: Influence of climate conditions on security necessary water for vegetation in various ecosystem. In: Gaál K.
K. (ed.): CD Proc. 29th Scientific Days in Mosonmagyaróvár, Mosonmagyaróvár, 2002, s. 10 CD.
8. LICHNER L., NAGY V., ŠTEKAUEROVÁ V.: Assessing the impact of land use change on solute transport in soil. Pollution and water resources Columbia University Seminar Proceedings, Vol. XXXII. Halasi-Kun. G. J.
et al. (eds). 2001, p. 187-199.
9. ŠTEKAUEROVÁ V., NAGY V.: Vplyv klimatických podmienok zabezpečenosť porastu vodou v lokalitách Báč a Bodíky. Acta Hydrologica Slovaca, ÚH SAV, Bratislava, 2001, 2/1, p. 58-63
10. ŠTEKAUEROVÁ V., NAGY V.: Dynamika zásob vody nenasýtenej oblasti pôdy v lokalitách Žitného ostrova v rokoch 1999-2000. IV. Vedecká konferencia v Michalovciach, ÚH SAV, Bratislava, VHZ ÚH SAV Michalovce, 2001, p. 243-247.
11. ŠTEKAUEROVÁ V., NAGY V.: Hodnotenie vodného režimu zóny aerácie pôdy v lokalitách Žitného ostrova. Acta Hydrologica Slovaca, ÚH SAV, 2003, 1, p. 65-73.
12. ŠTEKAUEROVÁ V., NAGY V.: Zabezpečenosť zóny aerácie pôdy vodou v lokalitách Bodíky (Žitný ostrov) a Dunasziget (Szigetköz ) 2002, Poster, ÚH SAV, 2003, x.
13. ŠTEKAUEROVÁ V., NAGY V.: Zabezpečenosť zóny aerácie pôdy vodou v lokalitách Bodíky (Žitný ostrov) a Dunasziget (Szigetköz ) 2002,
14. NAGY V., ŠTEKAUEROVÁ V.: Posterový Deň s medzinárodnou účasťou
“ Transport vody, chemikálií a energie v systéme pôda – rastlina – atmosféra” , CD ROM ,ÚH SAV- GFÚ SAV, 2003, p. 384-400.
15. ŠTEKAUEROVÁ V., NAGY V.: Hodnotenie vodného režimu zóny aerácie pôdy v lokalitách Žitného ostrova. Konferencia s medzinárodnou účasťou “ Hydrológia na prahu 21. Storočia – Vízie a realita“, CD-ROM, ÚH SAV, 2003,p. 233-242.
16. NAGY V., HOUŠKOVÁ B., LICHNER L.: Priestorová a časová variabilita hydraulických vlastností pôdy. In : Šír, M. et al.(eds.):Zborník z medzinárodnej konferencie „Hydrologie půdy v malém povodí.“, ÚH AVČR Praha, 2003, p. 21-27.
17. V. Nagy, Z. Kostka: Analyzis of coarse grained river sediments by photographic method. Pollution and water resources, Columbia University Seminar proceedings Volume XXX, Environmental protection of soil and water resources, 2000
18. V. Nagy, Z. Kostka: Granulometric investigation along the Belá river channel, Pollution and water resources, Columbia University Seminar proceedings Volume XXXI, DRAVA VALLEY, 2001
19. ŠTEKAUEROVÁ, NAGY, ŠEMBERA: Porovnanie hodnôt nasýtených hydraulických vodivostí nameraných rôznymi metódami. Acta Hydrologica Slovaca, 2000 no.1.
20. BABEJOVÁ, DLAPA, LICHNER, ŠTEKAUEROVÁ, NAGY: Vplyv zmeny obsahu humínových kyselín na vodivosť a nasýtenú hydraulickú vodivosť pôdy. Acta Hydrologica Slovaca, 2000 no.2.
21. ŠTEKAUEROVÁ, NAGY: Vplyv klimatických podmienok na zabezpečenosť porastu vodou v lokalitách Báč a Bodíky. Acta Hydrologica Slovaca, 2000 no.1.
22. ŠTEKAUEROVÁ, NAGY: Hydrofyzikálne charakteristiky pôd v lokalite Gabčíkovo. VII. Poster Day Bratislava, 2001.
23. ŠTEKAUEROVÁ, ŠÚTOR J., NAGY V., ORFÁNUS T., STEHLOVÁ K.:
Monitoring vlhkostných pomerov relevantného územia nad areálom SMÚ pre stanovenie zložiek vodnej bilancie s využitím matematického modelovania. Priebežná správa 1-3 za rok 2002, ÚH SAV, Bratislava.
2002, 53s.
24. ŠTEKAUEROVÁ V., ORFÁNUS T., NAGY V., ORFÁNUS T., STEHLOVÁ K. : Monitoring vlhkostných pomerov relevantného územia nad areálom SMÚ pre stanovenie zložiek vodnej bilancie s využitím matematického modelovania. Záverečná správa za rok 2001, ÚH SAV, Bratislava. 2002, 40s.