D
OCTORALT
HESISRisk-Based Statistical Process Control
Author:
Attila Imre KATONA
Supervisor:
Dr. habil. Zsolt Tibor KOSZTYÁN
A thesis submitted in fulfillment of the requirements for the degree of Doctor of Philosophy
in the
Doctoral School in Management Sciences and Business Administration Department of Quantitative Methods
March 19, 2019 DOI:10.18136/PE.2019.704
Business Administration of the University of Pannonia in the branch of Management Sciences
Written by Attila Imre Katona
Supervisor(s): Dr. habil. Zsolt Tibor Kosztyán
propose acceptance (yes / no) ……….
(supervisor/s)
As reviewer, I propose acceptance of the thesis:
Name of Reviewer: …... …... yes / no
……….
(reviewer) Name of Reviewer: …... …... yes / no
……….
(reviewer)
The PhD-candidate has achieved …...% at the public discussion.
Veszprém/Keszthely, ...……….
(Chairman of the Committee)
The grade of the PhD Diploma …... (…….. %) Veszprém/Keszthely,
……….
(Chairman of UDHC)
Publications
Most of the introduced methodologies and figures are previously appeared in the scientific articles listed below:
Thesis 1 (Sections3.1,4.1,5.1):
Kosztyán, Zsolt T., Csaba Heged ˝us, and Attila Katona (2017). Treating measure- ment uncertainty in industrial conformity control. In: Central European Journal of Operations Research, pp. 1-22. ISSN: 1613-9178. DOI:doi.org/10.1007/s10100- 017-0469-8
Thesis 2 (Sections3.2,4.2,5.2):
Kosztyán, Z. T., & Katona, A. I. (2016). Risk-based multivariate control chart. In:Ex- pert Systems with Applications, 62, 250-262. DOI:doi.org/10.1016/j.eswa .2016.06.
019
Thesis 3 (Sections3.3,4.3,5.3):
Kosztyán, Z. T., & Katona, A. I. (2018). Risk-Based X-bar chart with variable sample size and sampling interval. In:Computers & Industrial Engineering, 120, 308-319.
DOI:doi.org/10.1016/j.cie.2018.04.052
UNIVERSITY OF PANNONIA
Abstract
Doctoral School in Management Sciences and Business Administration Department of Quantitative Methods
Doctor of Philosophy
Risk-Based Statistical Process Control by Attila Imre KATONA
Control charts are powerful tools of statistical process control. In the scientific litera- ture, there is a large scale of control charts that can be used under different conditions (e.g., non-normality, autocorrelation etc...) however, most of them disregard the dis- tortion effect of measurement errors. Importance of measurement uncertainty was strongly emphasized by several scholars and in comparison to that, the number of papers dealing with control chart under the presence of measurement error is way below the expectations. Furthermore, these few studies analyzed the effect of the measurement uncertainty but give no detailed and comprehensive solution or pro- pose new control chart that is able to reduce the risk of incorrect decisions. On the other hand, measurement errors are characterized based on the expected value and standard deviation of the distribution function but effect of skewness and kurtosis on conformity / process control performance were not investigated.
In this dissertation, the author provides systematic literature review in order to explore the relevant studies and highlight the deficiencies of control chart design research field. Effect of 3rd and 4th moments (skewness, kurtosis) of measurement error distribution on total inspection and acceptance sampling is analyzed through simulations and several sensitivity analysis are provided. Applying the results of the aforementioned analysis, a new risk-based multivariate (RBT2) and adaptive (RB VSSI X) control chart design approaches are proposed with the consideration of measurement uncertainty. Simulations and sensitivity analyses were provided in order to demonstrate the performance of the proposed RBT2 and RB VSSI X chart under different conditions.
The developed risk-based control charts are able to decrease the amount of type II. errors (prestige loss) by the optimal adjustment of control lines taking measure- ment uncertainty into account. Process shifts can be detected more precisely in mul- tivariate (RBT2) or adaptive (RB VSSIX) cases as well. In addition, even sampling procedure can be rationalized with the RB VSSIXchart.
As limitation of the method, the process performance value were estimated where it is still beneficial to consider the effect of measurement errors.
Finally, real practical examples were provided and laboratory experiments were organized to validate the existence of skewed measurement error distribution and verify applicability of the proposed methodology at a company from automotive industry.
UNIVERSITY OF PANNONIA
Zusammenfassung
Doctoral School in Management Sciences and Business Administration Department of Quantitative Methods
Doktor der Philosophie
Risikobasierte Statistische Prozesskontrolle von Attila Imre KATONA
Regelkarten sind leistungsfähiges Mitteln von statistische Prozessregelung. Im Fachli- teratur, vielfältige Regelkarten wurden entwickelt die unter anderen Rahmenbe- dingungen (z.B. Nicht-Normalverteilung, Autokorrelation, usw...) verwendbar sind, aber diese Regelkarten berücksichtigen die Effekt von Mesffehler nicht.
Viele Forscher betonten das Wichtigkeit der Messunsicherheit, trotzdem gibt es nur wenige Studien die analisieren die Effekt des Mesffehlers an der Performance den Regelkarten. Zusätzlich diesen wenige Studien fokussieren sich auf die Perfor- mance den Regelkarten, aber geben keine Vorschlag zur Behandlung von Messun- sicherheit oder zur Reduktion den Entscheidungsrisiken. Messfehlers werden ande- rerseits gekennzeichnet durch Erwartungswert und Standardabweichung des Dis- tributions aber Auswirkungen von Schiefe und Kurtosis auf Prozesskontrolle wur- den nicht analisiert.
In dieser Dissertation, der Autor führtet eninen systematischen Literatur Durch- sicht um relevanten Artikeln zu erkunden und Mängel im Literatur zu markie- ren. Auswirkungen von Schiefe und Kurtosis des Messunsicherheitdistributions auf Konformitätskontrollstrategie wurden durch Simulationen und Sensitivitätsanaly- sen untersucht.
Ergebnisse den Simulationen wurden verwenden um neuen risikobasierte mul- tivariate (RBT2) und adaptive Regelkarten (RB VSSI X) zu entwickeln. Beide vor- schlägten Regelkarten konnten die Menge den Typ-II Fehlern reduzieren durch die Optimierung den Kontrollgrenzen. Die Veränderung von Prozess Erwartungswert kann effektiv identifizieren werden und auch Stichprobenverfahren kann rationali- siert werden mit die adaptive riskbasierte Regelkarte.
Als Beschränkung, das Wert dem Prozessleitungsfähigkeitsindex wurde geschätzt, womit die Berücksichtigung von Messunsicherheit noch sinvoll ist.
Praktische Beispiele und laboratorische Experimenten wurden schließlich bereit- gestellt um die eingeführten Methoden zu prüfen und die Anwendbarkeit zu de- monstrieren.
Contents
1 Introduction 1
1.1 Motivation of the Thesis . . . 1
2 Related Studies 5 2.1 Methodology of the literature research procedure . . . 5
2.1.1 Collection . . . 5
2.1.2 Classification . . . 6
2.1.3 Refinement . . . 8
2.2 Result of the literature research . . . 8
2.2.1 Measurement Error and Conformity Control . . . 8
2.2.2 Measurement Error and Control Charts . . . 11
2.2.3 Citations between the two networks . . . 16
2.2.4 Analysis of research trends . . . 17
2.3 Summary and contribution to literature . . . 23
3 Methods 25 3.1 Characterization of measurement error distribution . . . 25
3.1.1 Decision outcomes . . . 26
3.1.2 Structure of the simulation . . . 27
3.2 Risk-based multivariate control chart . . . 30
3.2.1 Data collection and construction of traditionalT2chart . . . 30
3.2.2 Construction of traditionalT2chart . . . 30
3.2.3 Decision outcomes and decision costs . . . 31
3.2.4 Construction of Risk-based T2control chart . . . 33
3.3 Risk-based adaptive control chart . . . 35
3.3.1 Data collection and simulation . . . 35
3.3.2 Construction of traditional VSSIXchart . . . 36
3.3.3 Decision outcomes and decision costs . . . 36
3.3.4 Construction of the RB VSSIXchart . . . 40
4 Simulation results 43 4.1 Characterization of measurement error distribution . . . 43
4.2 Risk-based multivariate control chart . . . 47
4.3 Risk-based adaptive control chart . . . 49
5 Sensitivity Analysis 52 5.1 Characterization of measurement error distribution . . . 52
5.1.1 Sensitivity analysis for decision costs . . . 52
5.1.2 Sensitivity analysis for process performance (Ppk) . . . 53
5.2 Risk-based multivariate control chart . . . 58
5.2.1 Cost of type II. error . . . 58
5.2.2 Sample size . . . 59
5.2.3 Skewness of the probability density function . . . 59
5.2.5 Number of the controlled product characteristics . . . 61
5.3 Risk-based adaptive control chart . . . 63
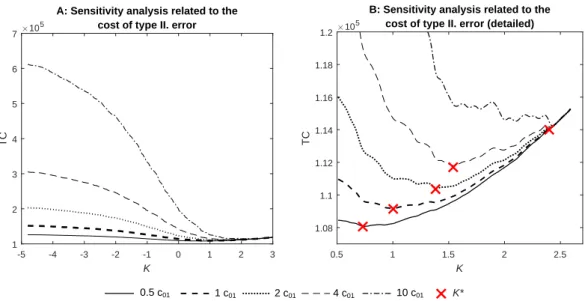
5.3.1 Cost of type II. error . . . 63
5.3.2 Standard deviation of measurement error . . . 65
5.3.3 Skewness of the measurement error . . . 65
6 Validation and verification through practical examples 67 6.1 Effect of measurement error skewness on optimal acceptance policy . . 69
6.1.1 Brief description of the process . . . 69
6.1.2 Measurement error characteristics . . . 69
6.1.3 Real process and Simulation . . . 70
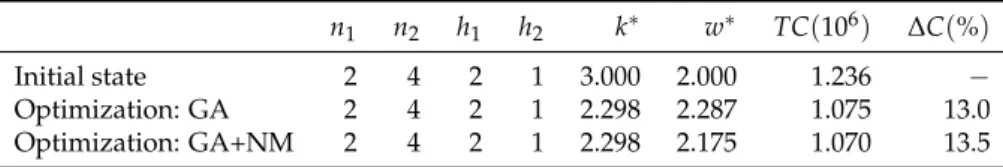
6.1.4 Optimization and comparison of results . . . 71
6.2 Effect of measurement error onT2control chart . . . 74
6.2.1 Brief description of the process . . . 74
6.2.2 Measurement error characteristics . . . 74
6.2.3 Real process and Simulation . . . 75
6.2.4 Optimization and comparison of results . . . 77
6.3 Effect of measurement error on adaptive control chart . . . 79
6.3.1 Brief description of the process . . . 79
6.3.2 Measurement error characteristics . . . 79
6.3.3 Real process and Simulation . . . 80
6.3.4 Optimization and comparison of results . . . 81
7 Summary and Conclusion 83 7.1 Summary . . . 83
7.2 Conclusion . . . 84
A Risk and uncertainty in production management 87
B Table of papers - control charts 89
C Table of papers - Measurement uncertainty 93
D Reviewed studies including the consideration of measurement errors 95 E Description of the adaptive control chart rules 96 F Examples for measurement process monitoring techniques 98 G The author’s publications related to the topic 101
Bibliography 103
List of Figures
1.1 Illustration of measurement errors on conformity assessment (source:
own edition based on AIAG,2010) . . . 2
1.2 Illustration of measurement errors on control charts . . . 3
2.1 Result of the literature research (measurement uncertainty area) . . . . 9
2.2 Result of the literature research (measurement uncertainty area-Sub- graph) . . . 11
2.3 Result of the literature research (Control chart design research area) . . 12
2.4 Result of the literature research (Control chart design research area - Univariate subgraph) . . . 14
2.5 Result of the literature research (Control chart design research area - Multivariate subgraph) . . . 15
2.6 Citations between the two networks . . . 17
2.7 Most important "milestones" in control chart and measurement uncer- tainty research . . . 19
2.8 Most frequent terms in control chart paper titles (from 1990 to 2018) . . 21
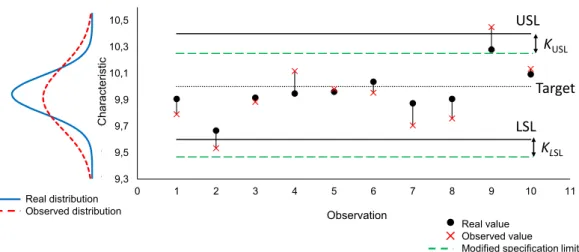
3.1 Illustration of specification limit modification (source: own edition based on Heged ˝us (2014)) . . . 28
3.2 Demonstration of the nine decision outcomes on a control chart . . . . 38
4.1 Optimal values of the correction component (K∗) as a function of skew- ness and kurtosis of the measurement error distribution (total inspec- tion) . . . 44
4.2 Optimal values of the correction component (K∗) as a function of skew- ness and kurtosis of the measurement error distribution (acceptance sampling) . . . 45
4.3 Convergence to the optimum solution . . . 48
4.4 Convergence to the optimal solution with Genetic Algorithm and Nelder- Mead direct search . . . 49
4.5 Comparison of traditional and RB VSSI control chart patterns . . . 50
5.1 Sensitivity analysis for cost of each decision outcome . . . 52
5.2 Sensitivity analysis for process performance (Ppk) . . . 54
5.3 Sensitivity analysis for process performance (Ppk) and standard devi- ation of measurement error . . . 56
5.4 Sensitivity analysis according to the cost of type II. error . . . 58
5.5 Sensitivity analysis according to the sample size . . . 59
5.6 Sensitivity analysis according to skewness of product characteristic 1 . 60 5.7 Sensitivity analysis according to the standard deviation of process and measurement uncertainty . . . 61
5.8 Sensitivity analysis according to the number of controlled product characteristics . . . 62
5.10 The width of warning interval as a function of sampling cost . . . 64 5.11 Sensitivity analysis regarding standard deviation of measurement error 65 5.12 Sensitivity analysis regarding skewness of measurement error . . . 66 6.1 Distribution of the measurement error (First practical example) . . . . 69 6.2 Density plot according to the real and detected product characteristic
values . . . 71 6.3 Density plot with original and optimized specification limits . . . 72 6.4 Distribution of measurement error related to cutting length and core
diameter . . . 74 6.5 Correlation and distribution of the two product characteristics . . . 76 6.6 Designed T2 charts (upper chart contains the known x and y and
lower chart was built under simulatedxandy) . . . 77 6.7 DesignedT2chart with optimized control limit . . . 77 6.8 Distribution of the measurement error (Third practical example) . . . . 79 6.9 VSSIXchart patterns for known data and simulation . . . 81 6.10 RB VSSIXchart with optimal warning and control lines . . . 82 7.1 Placement of the research outcomes into the main stream . . . 86
List of Tables
2.1 List of questions and possible responses according to the papers with
measurement uncertainty topic . . . 6
2.2 List of questions and possible responses according to the papers de- veloping control charts . . . 7
3.1 Cost of decision outcomes as a function of decision and actual confor- mity . . . 26
3.2 Decision outcomes when applying multivariate T2control chart . . . . 32
3.3 Decision outcomes when using VSSIXchart . . . 36
3.4 Elements of the cost of decision outcomes . . . 38
3.5 Structure of the decision costs (VSSI control chart) . . . 39
4.1 Cost structure and result of the simulation . . . 44
4.2 Input parameters of the simulation . . . 47
4.3 Performance ofRBT2chart . . . 48
4.4 Cost values during the simulation (RB VSSIXchart) . . . 49
4.5 Results of the simulation (RB VSSIXchart) . . . 50
6.1 Estimated parameters of measurement error distribution (First practi- cal example) . . . 70
6.2 Estimated parameters of the process distribution (First practical ex- ample) . . . 70
6.3 Optimization results (First practical example) . . . 73
6.4 Estimated parameters of measurement error distribution (Second prac- tical example) . . . 75
6.5 Estimated parameters of the process distribution (Second practical ex- ample) . . . 75
6.6 Optimization results (Second practical example) . . . 78
6.7 Estimated costs of the decision outcomes . . . 79
6.8 Estimated parameters of measurement error distribution (Third prac- tical example) . . . 80
6.9 Estimated parameters of the process distribution (Third practical ex- ample) . . . 80
6.10 Optimization results (Third practical example) . . . 81
B.1 Table of articles - Control Charts - 1 (U=univariate, M=multivatiate, P=parametric, NP=nonparametric, F=fixed, A=adaptive, T=traditional, R=risk-based) . . . 90
B.2 Table of articles - Control Charts - 2 (U=univariate, M=multivatiate, P=parametric, NP=nonparametric, F=fixed, A=adaptive, T=traditional, R=risk-based) . . . 91
P=parametric, NP=nonparametric, F=fixed, A=adaptive, T=traditional, R=risk-based) . . . 92 C.1 Table of articles - Measurement Uncertainty - 1 (E=evaluation, C=conformity,
S=symmetric, A=asymmetric ) . . . 93 C.2 Table of articles - Measurement Uncertainty - 2 (E=evaluation, C=conformity,
S=symmetric, A=asymmetric ) . . . 94 D.1 Elements of the cost of the decision outcomes . . . 95
List of Abbreviations
ANOVA AnalysisOfVariance
BIPM BureauInternational desPoids etMesures
CL ControlLimit
GA GeneticAlgorithm
GRR GageRepeatability andReproducibility
GUM Guide to the Expression ofUncertainty inMeasurement ILAC InternationalLaboratoryAccreditationCooperation JCGM JointCommittee forGuides inMetrology
MCS Monte-CarloSimulation MSA MeasurementSystemAnalysis
NIST NationalInstitute ofStandards andTechnology NM Nelder-Mead direct search algorithm
PRISMA PreferredReportingItems forSystematic Reviews andMeta-Analyses SPC StatisticalProcessControl
RB Risc-Based (aspect)
RBT2 Risk-Based T2control chart RB VSSIX Risk-BasedXcontrol chart
VSI control chart withVariableSamplingInterval VSS control chart withVariableSampleSize
VSSI control chart withVariableSampleSize and samplingInterval VP control chart withVariableParameters
WL WarningLimit
List of Symbols
Control charts and product characteristics a outcome based on real T2 b outcome based on detected T2 CL central line
E measurement error matrix
ε measurement error
h sampling interval k control limit coefficient KLSL correction component of LSL KUSL correction component of USL LCL Lower Control Limit
LSL Lower Specification Limit LW L Lower Warning Limit
µε expected value measurement error
µx expected value of real product characteristic µy expected value of detected product characteristic
n sample size
p number of controlled product characteristics Ppk process performance index
σε standard deviation of measurement error σx standard deviation of real product characteristic σy standard deviation of detected product characteristic T2 Hotelling’s T2statistics for real values
Tc2 Hotelling’s T2statistics for detected values UCL Upper Control Limit
UCLRBT2 control limit of RBT2chart
UCLT2 control limit of traditional T2chart USL Upper Specification Limit
UW L Upper Warning Limit w warning limit coefficient x real product characteristic
X matrix of real product characteristic values
x real sample mean
y detected product characteristic
Y matrix of detected product characteristic values y detected sample mean
Cost components
c00 cost of correct rejection c01 cost of incorrect acceptance c10 cost of incorrect rejection c11 cost of correct acceptance
cf cost of false alarm identification ci cost of intervention
cid cost of delayed intervention
Cij aggregated cost of decision outcome cma maintenance cost
cm f fixed cost of measurement cmi cost of missed intervention cmp proportional cost of measurement cp production cost
cq cost of qualification cr cost of restart
crc cost of root cause search cs cost of switching
d1 weight parameter for switching d2 weight parameter for intervention
∆C cost reduction rate
Nh produced quantity in the considered interval (h) qij count of each decision outcome
TC total decision cost Optimization - RBT2
α reflection parameter β expansion parameter γ contraction parameter δ shrinking parameter
KE expansion point (regardingK)
KIC inside contraction point (regardingK) KOC outside contraction point (regardingK) KR reflection point (regardingK)
Optimization - RB VSSI X CB best vertex CG good vertex CW worst vertex
vR vector of reflection point coordinates CR cost function value in reflection point vE vector of expansion point coordinates CE cost function value in expansion point
vIC vector of inside contraction point coordinates vOC vector of outside contraction point coordinates COC cost function value in outside contraction point CIC cost function value in inside contraction point v2s vector of shrinking point coordinates (nthvertex) v3s vector of shrinking point coordinates (n+1thvertex)
Chapter 1
Introduction
1.1 Motivation of the Thesis
Control charts are powerful tools of production management. In case of process shift, the chart gives signal and the production equipment can be maintained in or- der to avoid the increased number of defective products.(Montgomery,2012, Woodall and Montgomery,1999, Kemény et al.,1998). Furthermore, the process is "in-control"
when the value of the product characteristic falls within the statistically determined control limits (Shewhart,1931, Besterfield,1994).
The traditional control chart philosophy does not consider the risks of the deci- sions, however, every decision in the process control is distorted by different sources like sampling or measurement uncertainty (Heged ˝us et al.,2013a, Katona,2013) This thesis focuses on decision risks caused by the uncertainty of measurement, because measurement errors can be modeled well and the distribution of errors can be easily simulated.
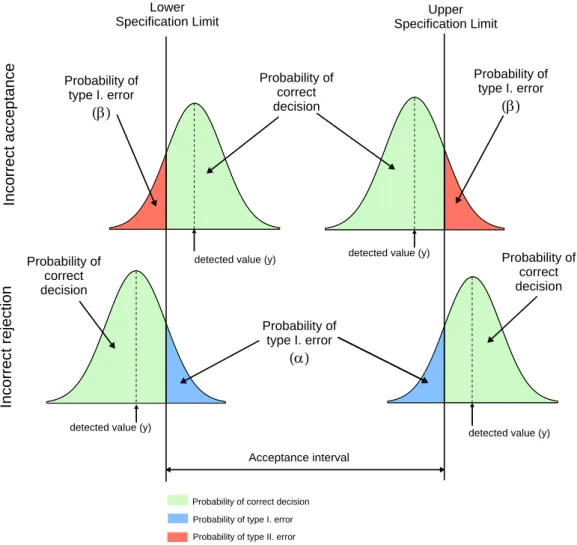
Although consideration of measurement uncertainty is not included in tradi- tional control chart design approach, producers’ and suppliers’ risks are frequently discussed topics in conformity or process control (Lira,1999). If the measuring de- vice or the measurement process is not accurate enough, incorrect decisions (e.g., unnecessary stoppage or missed maintenance) can be made. (Pendrill,2008). There- fore, the rate of producer’s and customer’s risk is strongly depending on the mea- surement uncertainty, leading to prestige loss for the manufacturer company. Mea- surement errors can occur in conformity control and statistical process control as well. Figure 1.1 illustrates the effect of measurement errors on conformity assess- ment.
Lower
Specification Limit Upper
Specification Limit
detected value (y) detected value (y)
detected value (y) detected value (y)
Acceptance interval Probability of
type I. error
(a)
Probability of type I. error
(b)
Probability of type I. error
(b)
Probability of correct decision
Probability of correct decision Probability of
correct decision
Incorrect acceptanceIncorrect rejection
Probability of correct decision Probability of type I. error Probability of type II. error
FIGURE1.1: Illustration of measurement errors on conformity assess- ment (source: own edition based on AIAG,2010)
On Figure1.1,ydenotes the observed value of the monitored product character- istic. Due to the existence of measurement error, the real value can be considered as a probabilistic variable which is assumed to follow normal distribution in this example. If the observed value is close to the specification limit, the probability of incorrect decision increases. Incorrect acceptance (type II. error denoted by β) is committed if the product is conforming based on the observed value however, the real value falls outside the acceptance interval. In the opposite case, incorrect rejec- tion (type I. error denoted byα) occurs, that is to say the observed value falls outside the acceptance interval but the product is conforming based on the real product characteristic.
As it was mentioned before, measurement errors not only affect the outcome of conformity testing but also can have significant impact on statistical process control.
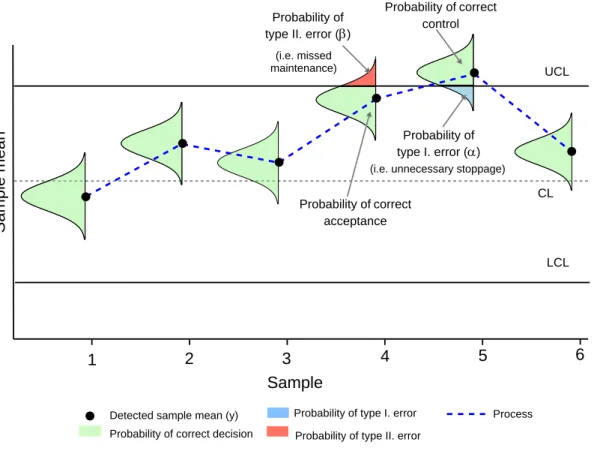
The effect represented by Figure1.1can be applied to statistical control charts as well (Figure1.2):
Probability of type I. error (a) type II. error (b) control
Probability of correct acceptance (i.e. missed
maintenance)
(i.e. unnecessary stoppage)
1 2 3 4 5 6
Sample mean
Detected sample mean (y) Probability of correct decision
Sample
Probability of type I. error Probability of type II. error
UCL
LCL CL
Process
FIGURE1.2: Illustration of measurement errors on control charts
Figure1.2shows anXchart where the observed sample mean is denoted by the black dot and real sample mean is represented as probabilistic variable (It is assumed that measurement errors follow normal distribution.). The fourth sampling event highlights the probability of incorrect acceptance of the process. If type II. error is committed, a necessary maintenance is skipped which can lead to delayed detection of process shift or even to serious machine failure. Fifth sampling event shows the probability of type I. error leading to unnecessary stoppage which can be extremely cost-intensive too.
In order to reduce the decision risks, traditional control charts needs to be im- proved and risk-based aspect (RB) needs to be considered, where control limits are optimized in order to minimize the risks of the decisions. Although there are recom- mendations by several measurement manuals (BIPM et al.,1995, Eurachem,2007b, they cannot handle the measurement uncertainty comprehensively, because these recommendations assume the normality of the measurement error distribution. The literature of statistical process control includes a wide scale of control charts operat- ing on reliability base, but a gap can be observed in the literature according to the field of the control charts based on risk-based philosophy. The aim of the thesis is to develop a family of risk-based control chart which is able to reduce the decision risks arising from the measurement uncertainty. In my thesis I determine the following research questions and research proposals:
Research Questions
Q1: Which moments of the measurement error distribution function (expected value, standard deviation, skewness, kurtosis) can describe the measurement uncer- tainty?
Q2: What is the cost reduction rate that can be achieved while using a risk-based multivariate control chart instead of a traditional multivariate chart?
Q3: What is the cost reduction rate that can be achieved while using a risk-based control chart with variable sample size and sampling interval compared to the traditional VSSI X-bar chart?
Research Proposals
P1: All four moments of the measurement error distribution function need to be considered by the characterization of the measurement uncertainty.
P2: 3-5% total decision cost reduction can be achieved with risk-based multivariate control chart compared to the "traditional" multivariate control chart.
P3: 3-5% total decision cost reduction can be achieved with risk-based adaptive control chart compared to the "traditional" adaptive control chart.
Rest of the dissertation is organized as follows:
In Chapter 2, I introduce the methodology and results of the systematic litera- ture review, Chapter3presents the proposed methods. Simulation results are pro- vided in Chapter4, sensitivity analyses are conducted in Chapter5, applicability is demonstrated through real practical examples by Chapter6. Finally, I summarize my research results and implications in Chapter7.
The next chapter reviews the scientific literature related to the research topic.
Chapter 2
Related Studies
2.1 Methodology of the literature research procedure
In order to explore the related studies and review the most relevant researches ac- cording to the field of statistical control charts/measurement uncertainty, I con- ducted a systematic review including classification of the related articles as well.
A survey-based content analysis was applied to classify the related researches (see Kolbe and Burnett (1991) for more detailed information about content analysis). Fol- lowing the structure used by Maleki et al. (2016) and Hachicha and Ghorbel (2012) - who conducted content analysis in the field of statistical process control - the litera- ture research included two steps: First, the set of appropriate scientific studies needs to be determined. Secondly, the identified set of papers needs to be classified using predefined categories.
In order to ensure that relevant studies were not missed, I also extended the aforementioned two steps with an additional one: Refinement. Within this step, citation data of the collected papers were also analyzed. With the help of this, I was able to find those papers that were not included by the current platform I used for the search. Based on that, the structure of systematic literature search can be described as follows:
1. Collection 2. Classification 3. Refinement
Since my research questions cover two main research fields (research question Q1 refers to measurement uncertainty researches and research questions Q2-Q3 apply to the research field of statistical control charts), the aforementioned literature search was provided twice: on one hand, I considered the set of researches dealing with measurement uncertainty, on the other hand the relevant literature of control charts was analyzed. In Subsection 2.1.1and 2.1.2, the two major steps of the literature search are discussed.
2.1.1 Collection
In order to determine the appropriate set of literature, scientific journal articles, industrial standards and conference papers were considered using computerized search with specific keywords like: "measurement uncertainty","measurement error",
"gauge error", "skewed distribution" to find the researches related to measurement un- certainty topic. Furthermore, "control chart", "statistical process control", "variable mon- itoring" terms were used to find the researches associated with control chart topic.
The main platforms and publishers I used for the literature search were Google Scholar, ScienceDirect, Web of Science, Taylor & Francis, Springer Link, Emerald Insight, IEEE Xplore, Scopus and IOPScience.
It is also important to define which papers are relevant according to the topic of my thesis. Since the research questions/proposals cover two main research fields, relevance of the papers needs to be defined from the perspective of the two research fields:
Control charts The paper is relevant and can be added to the collection if it de- velops a new methodology related to control charts. That is to say, studies that are focusing on existing control chart approach on a new field of application are not relevant from the point of view of the thesis.
Measurement uncertainty and conformity control The paper (or standard) is rel- evant if it either deals with the expression/interpretation of the measurement uncer- tainty under symmetric/asymmetric measurement error distribution or focuses on the effects/treatment of measurement uncertainty in conformity control.
2.1.2 Classification
As the next step, the collected papers were classified using a conceptual classifi- cation scheme. Similarly to Maleki et al. (2016) and Hachicha and Ghorbel (2012) I used predefined questions and possible answers to classify the selected papers.
Since the research questions cover two main research fields (measurement uncer- tainty and statistical process control charts), two versions of classification surveys were constructed. First, I introduce the survey used for the classification of litera- tures regarding measurement uncertainty.
Literature of measurement uncertainty
Table 2.1 shows the question-response set regarding the papers dealing with measurement uncertainty.
TABLE2.1: List of questions and possible responses according to the papers with measurement uncertainty topic
Nr. Questions/Responses
1 What is the main focus of the paper?
1.1 It deals with the expression of measurement uncertainty.
1.2 It deals with the consequences of measurement uncertainty in product conformity.
2 What kind of distribution the paper assumes for the measurement errors?
2.1 It assumes symmetric error distribution.
2.2 It assumes asymmetric error distribution.
My thesis focuses on statistical process control and conformity control, there- fore it is important to identify which studies develop/discuss different approaches for the expression of the measurement uncertainty under different conditions, and which studies aim to propose methods for handling of measurement uncertainty in conformity control. While the first set of studies provides different approaches to determine or describe measurement uncertainty (not just in conformity control), the second set of researches focuses more on the consequences of measurement uncer- tainty.
surement error distribution, it is also important to identify the related studies that considered asymmetric distribution types. In this thesis, the most relevant studies are the ones that:
• deal with the consequences of the measurement uncertainty in conformity con- trol and/or
• assume asymmetric distribution type(s) for the measurement error.
In the next part, I introduce the questions/responses related to the literature of con- trol charts.
Literature of control charts
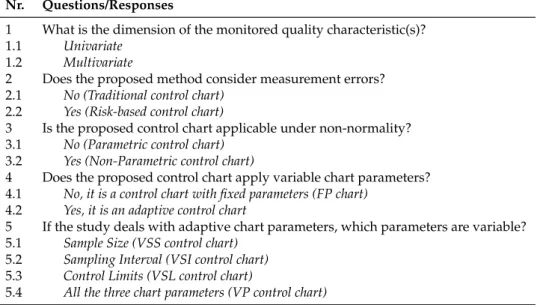
Table2.2shows the question-response set regarding the papers proposing control charts.
TABLE2.2: List of questions and possible responses according to the papers developing control charts
Nr. Questions/Responses
1 What is the dimension of the monitored quality characteristic(s)?
1.1 Univariate 1.2 Multivariate
2 Does the proposed method consider measurement errors?
2.1 No (Traditional control chart) 2.2 Yes (Risk-based control chart)
3 Is the proposed control chart applicable under non-normality?
3.1 No (Parametric control chart) 3.2 Yes (Non-Parametric control chart)
4 Does the proposed control chart apply variable chart parameters?
4.1 No, it is a control chart with fixed parameters (FP chart) 4.2 Yes, it is an adaptive control chart
5 If the study deals with adaptive chart parameters, which parameters are variable?
5.1 Sample Size (VSS control chart) 5.2 Sampling Interval (VSI control chart) 5.3 Control Limits (VSL control chart)
5.4 All the three chart parameters (VP control chart)
In this literature research, control charts for attributes and economic design- related papers were not considered. The first question identifies whether the given paper deals with univariate (e.g., Shewhart type, EWMA, MA, CUSUM) or multi- variate quality characteristics (e.g., T2, MCUSUM, MEWMA). Question 2 is intended to reveal the nature of the proposed approach from risk’s point of view. To be more specific, studies that consider measurement uncertainty as a risk factor during the control procedure were labeled as "Risk-based" approaches. Similarly, if the given paper proposes a new type of control chart however, it does not take the measure- ment uncertainty into account, it was labeled as "Traditional" approach. Question 3 makes difference between studies dealing with parametric and non-parametric con- trol charts, and question 4 distinguishes between adaptive control charts and control charts with fixed parameters. Question 5 only makes sense if response 4.2 is true. It is necessary to note, that responses 5.1, 5.2 and 5.3 are allowed to be true in the same time by one study, meaning that papers can be assigned to VSS, VSI and VSL cate- gories simultaneously. However, since VP charts are getting increased attendance, this set of researches/papers was considered as a separated group (Nenes,2011).
2.1.3 Refinement
There are situations when the currently used platform does not include a paper that would be relevant according to the selected topic. So that a relevant paper may not be missed, I analyzed the list of citing references for all the papers found by step 1 (collection). If further papers were found (through the citation list), they were added to the already collected researches.
Not only the selected articles but the information about citation was also gath- ered. The information were stored in a database with two tables where the first one contains the information about the scientific paper (authors, title, journal, keyword, topic) and the second one represents the citing relations between the collected arti- cles. This structure allows to build network-type visualizations in order to illustrate the structure of the studied research areas (and their sub-areas as well.).
It is important to note, that PRISMA Statement (Preferred Reporting Items for Systematic reviews and Meta-Analyses) was developed in order to support the pro- cedure of systematic literature review. PRISMA provides a checklist with 27 ele- ments and flow-diagram to help the researchers to improve the quality of literature review (Moher et al.,2009). The referred flow-diagram includes the following main steps:
1. Identification: Collection from databases and other external sources 2. Screening: Removal of duplicates
3. Eligibility checking
4. Removal of not relevant studies
The main difference between the applied literature research methodology and PRISMA approach is the following: While PRISMA provides a simple process flow, the proposed literature research method includes iterative elements. Even the clas- sification rules can be revised and refined if new research field can be identified through the exploration of the citation data.
In the following section I introduce the result of the literature research.
2.2 Result of the literature research
Networks were used to visualize the quantity of researches and citing relationship in the analyzed fields. In this section I introduce two main networks, the first repre- sents the result of the literature research in measurement uncertainty and conformity control area, while the second visualizes the structure of papers regarding control charts.
2.2.1 Measurement Error and Conformity Control
Figure2.1shows the result of the systematic literature search I conducted related to measurement uncertainty and conformity control.
A: Uncertainty evaluation with symmetric error distribution D: Conformity area with
asymmetric error distribution
with asymmetric error distribution
C: Conformity area with symmetric error distribution
Legend:
Articles
Articles (conformity with asymmetriy) Structure nodes
5 30 180 800 5000
FIGURE 2.1: Result of the literature research (measurement uncer- tainty area)
Since my first research question (Q1) is related to the distribution properties of measurement error, the main goal of this review was to identify the most relevant studies that deal with asymmetric measurement error distributions in the field of conformity control. After the search I classified the papers using the survey de- scribed by Table2.1.
Nodes represent the reviewed papers and edges represent the citing relationship between them. Blue nodes illustrates the responses related to each question from Ta- ble2.1so they illustrate the result of the classification (in other words, the blue nodes represent the structure of the aforementioned survey). The reviewed and classified papers were colored with red, however there is a group of papers highlighted with green. I highlighted those nodes, because that group includes papers considering asymmetric measurement error with the aspect of conformity control (group D). In addition the size of the nodes represents the citation numbers (How many times they were cited by others.) in logarithmic scale.
86 studies were selected and categorized and 6 papers out of the 86 were classi- fied into group "D" (colored with green). Although many researches focused on the evaluation of measurement uncertainty even assuming asymmetric measurement error distributions, only a few considered the effect of asymmetric measurement un- certainty and its consequences in conformity control. I summarize the most relevant contributions in two steps, starting with groups "A", "B" and "C".
Groups "A", "B" and "C":
As part of the Six Sigma approach, measurement system analysis (MSA) and
R&R tests (repeatability and reproducibility) are often used to evaluate measure- ment uncertainty of a measuring device. These methods are useful to get knowledge about the performance of measurement device or system, however their purpose is to support the decision making about the validation of the device/system and do not consider the further consequences of the measurement uncertainty (AIAG,2010).
In 1995, the attitudes were changed related to the measurement uncertainty with the construction of the Guide to the Expression of Uncertainty in Measurement (GUM)(BIPM et al.,1995). GUM proposes the expression of the measurement un- certainty in two ways. On one hand, the measurement uncertainty is expressed as a probability distribution derived from the measurement. On the other hand, this uncertainty can be described as an interval. In the first case, the standard devia- tion is used for the characterization of the distribution (standard uncertainty). If the result of the measurement is obtained by combining the standard deviation of sev- eral input estimates, the standard deviation is called combined standard uncertainty.
In the second case, the length of the interval can be determined by the multiplica- tion of the combined standard uncertainty and a coverage factor k and called as expanded uncertainty. There are several guidelines that proposes 2 as a value of the coverage factork(BIPM et al.,1995, Eurachem,2007a, Heping and Xiangqian,2009, Rabinovich,2006, Jones and Schoonover,2002), producing 95.45 % confidence level, however this statement is only true if the combined uncertainty follows normal dis- tribution, otherwise the estimation of the confidence level is not correct (Vilbaste et al.,2010, Synek,2006).
Asymmetry of the distribution can also lead to incorrect estimation and incorrect decisions as well. The JCGM Guide 101 (BIPM et al.,1995) introduces that exponen- tial and gamma distributions are observable as asymmetric examples, furthermore, researches have shown that asymmetry can appear in combined standard uncer- tainty as well (Herrador and Gonzalez,2004, D’Agostini,2004, Pendrill,2014). Not only skewness can be the root cause of the over- or underestimation of confidence level. Kurtosis can also vary by different measurement devices or systems. Lep- tocurtic and platykurtic distributions are also observable by several measurement systems (Martens,2002, Pavlovcic et al.,2009).
If the measurement error distribution follows non-normal distribution, the confi- dence level will be estimated incorrectly and using thek=2 proposal, decision errors can be made, since the principal assumption of the proposal is not valid. Further- more, the rules based on the assumption of normal distribution do not consider the consequences of the decision errors, however they can lead to considerable prob- lems.
Group "D":
Figure2.2shows the structure of the papers classified in group "D" in details.
Uncertainty in conformity Pendrill (2014)
Rossi & Crenna (2006)
Pendrill (2009)
Williams (2008)
Pendrill (2006)
Legend:
Articles
Articles (conformity with asymmetriy) Structure nodes
Conformity with asymmetric
uncertainty
2 4 15 20
50
FIGURE 2.2: Result of the literature research (measurement uncer- tainty area-Sub-graph)
There were also researches taking measurement uncertainty and the decision consequences into account. Rossi and Crenna showed that measurement uncertainty should not be treated as an interval or a simple standard deviation, but needs to be considered as a probability distribution in order to avoid incorrect decisions (Rossi and Crenna,2006). Williams (2008) pointed out that decision rules must be carefully defined when skewed measurement error distribution is assumed. Although, Forbes has proposed a method treating the conformance assessment as a Bayesian decision, he only considered the cost and revenue of the incorrect decisions (Forbes, 2006).
Later, Pendrill has developed a more comprehensive model considering measure- ment uncertainty in conformity sampling. The model included all the four decision outcomes (correct acceptance, false rejection, false acceptance and correct rejection) however, only correct decision-, and testing costs were considered during the calcu- lations (Pendrill,2008, Pendrill,2014).
The referenced papers made steps towards the risk-based aspect of the confor- mity control, they did not consider all the four decision outcomes in the calcula- tions and however, they also considered even asymmetric measurement error dis- tributions, the strength of the characteristics of the measurement error distribution (skewness, kurtosis) were not analyzed. Research Question Q1 is still valid after the literature review, since I did not find any paper that answered the question and in- vestigated how 3rd and 4th moments of measurement error distribution affects the decision outcomes during conformity control. In my thesis, I develop a risk-based model in the statistical process control including all the four decision outcomes and examine the impact of 3rdand 4thmoments of the measurement error distribution.
2.2.2 Measurement Error and Control Charts
The same literature search approach was conducted in order to explore the most relevant studies of control charts. The result of the systematic review is introduced by Figure2.3.
D: Traditional multivariate
E: Traditional Adaptive Multivariate
F: Traditional Non−parametric
Multivariate
C: Traditional Non−parametric
Univariate
B: Traditional Adaptive Univariate
A: Traditional Univariate
I: Risk−based Univariate
H: Risk−based Non−parametric
Univariate G: Risk−based
Multivariate
Articles (Risk−based aspect) Articles (Traditional aspect) Structure nodes
5 30 180 800 5000 Number of citations:
FIGURE 2.3: Result of the literature research (Control chart design research area)
On Figure 2.3, the logic of coloring remained the same: blue nodes represent the structure of the control charts defined by the predefined survey, red nodes de- note the reviewed articles regarding traditional control charts (without considering measurement errors). Papers that developed control charts considering the effect of measurement error were highlighted with green (risk-based aspect), and node size represents citation numbers.
First, I summarize the most relevant papers in the field of traditional control charts.
Traditional control charts (Group "A-F"):
The first statistical control chart was developed by W.A. Shewhart in 1924 (She- whart, 1924) to monitor the process expected value. The process is labeled to "in- control" if the sample mean falls within the Lower and Upper Control Limits (LCL and UCL) (Shewhart,1931). Although the X-bar chart was able to detect when the expected value of the process changes significantly, its main deficiency is the in- ability to detect small shifts. In order to rectify that, CUSUM (Cumulative Sum) and EWMA (Exponential Weighted Moving Average) control charts were proposed (Page,1954, Roberts,1959). However univariate control charts were powerful tools to detect process shift, they were not able to monitor more than one product charac- teristics simultaneously. Though Shewhart dealt with monitoring of more correlated characteristics, the multivariate control chart has its origins in the research of H.
1947). Subsequently, other multivariate control charts were developed like multi- variate sum (MCUSUM) control chart (Crosier,1988, Pignatiello and Runger,1990), and the exponentially weighted moving average chart (MEWMA), developed by Lowry and Woodall (Lowry et al.,1992). Several references give more detailed dis- cussion about the multivariate quality control reviewed by Jackson (1985).
Multivariate and univariate control charts were commonly used for process con- trol, however, their application condition is the preliminary knowledge of the distri- bution of the controlled product characteristic(s). Most control charts assume nor- mal distribution or a known form of a particular distribution for the monitored product characteristic (Yang et al.,2011). For the elimination of the problem, sev- eral researches developed nonparametric control chart approaches (see: Bakir and Reynolds,1979; Amin et al.,1995; Bakir,2004; Bakir,2006; Chakraborti and Graham, 2008for univariate charts and Chakraborti et al.,2001; Bakir,2006, Tuerhong et al., 2014; Chakraborti et al.,2004for multivariate control charts).
The evolution and complexity of production processes resulted in the develop- ment of more flexible control charts with adaptive control chart parameters (n,h,k).
If the monitored process is "in-control" state, smaller sample size, longer sampling interval and wider accepting interval are used. However, in "out-of-control" the adaptive charts apply stricter control policy (larger sample size, shorter sampling interval, and narrower accepting interval) (Lim et al.,2015).
Reynolds, Amin, Arnold and Nachlas were the first who developed an X-bar chart with variable sampling interval (VSI) (Reynolds et al., 1988), and their re- search inspired a number of researchers opening the research field of adaptive con- trol charts. (Runger and Pignatiello,1991, Chew et al.,2015, Naderkhani and Makis, 2016, Bai and Lee,1998, Chen,2004). Subsequently Prabhu, Runger and Keats devel- oped an X-bar chart with variable sample size (VSS) (Prabhu et al.,1993) followed by several improvements (Costa,1994, Tagaras,1998, Chen,2004). As a further con- tribution to the field, VSSI control charts were developed (variable sample size and sampling interval) where sample size and sampling interval are modified simulta- neously (Costa,1997, Costa,1998, Costa,1999, Chen et al.,2007, De Magalhães et al., 2009).
In order to determine the optimal parameter levels for the adaptive control charts, numerous studies aimed to apply economic design methodology minimizing the av- erage hourly cost during the process control (Lee et al.,2012, Lin et al., 2009, Chen et al.,2007, Chen,2004).
During the literature research, I also reviewed the domestic literature and it is observable that Hungarian control chart articles and studies are rather descriptive and just a few research focused on development.
Risk-based control charts (Group "G-I"):
Producers’ and suppliers’ risks are frequently discussed topics in the field of conformity or process control (see e.g.: Lira, 1999). Risks can arise from different sources, such as uncertainty in the real process parameters or imprecision of the measuring device. Lack of knowledge regarding the real value of the process pa- rameters or imprecision of the measuring device can be considered as uncertainty during the application of control charts. Several studies showed that parameter es- timation has a significant impact on the performance of control charts (Jensen et al., 2006, Zhou, 2017). On the other hand, measurement errors can lead to incorrect decisions and increases the number of type I. and type II. errors (Pendrill,2008).
RB
P NP
A A
FP
SS SI
FP SS
SI
CL
CL
Hegedus et al. (2013) Katona A. I. (2011)
Mittag & Stemann (1998)
Linna K. W and Woodall W. H. (2001) A. Haq et al. (2014)
X.L. Hu et al. (2015) X.L. Hu et al. (2016a)
X.L. Hu et al. (2016b)
P. Maravelakis et al. (2004)
Maravelakis P.E. (2012)
Rahlm M. (1985)
Abbasi S. A. (2016)
Kanazuka, T. (1986)
X−B. Cheng and F.−K. Wang. (2017)
Stemann and Weihs (2001)
Khrushid & Chakraborty (2014)
Riaz (2014) Abraham, B. (1977)
Abbasi, S. A. (2014) Abbasi, S. A. (2010) Cheng, X. & Wang, F. (2018)
Daryabari et al. (2017) Song & Vorburger (2007)
Abbreviations:
RB=Risk−Based P=Parametric NP=Non−Parametric A=Adaptive FP=Fixed Parameters SS=Sample Size SI=Sampling Interval CL=Control Limits
Legend:
Articles (Risk−Based aspect) Articles (Traditional aspect) Structure nodes Entire network
2 4 6 15 80
# of citations:
FIGURE 2.4: Result of the literature research (Control chart design research area - Univariate subgraph)
In 1977, Abraham studied the performance of Xchart by adding measurement error to the original process. His research inspired several scholars and opened the way for studies with the aim to analyze the effect of measurement error on control charts (Abraham,1977).
As a contribution to the topic, Kanazuka showed that relatively large measure- ment error reduces the power ofX-Rcharts and proposed increased sample size to improve the performance (Kanazuka,1986). Later Mittag and Stemann examined the impact of gauge imprecision on the performance of X-Scontrol charts (Mittag and Stemann,1998). Based on this study, Linna and Woodall further developed a measurement error model with covariates and investigated how measurement error (based on the referred model) influences the performance ofX andS2 charts. Sev- eral studies adopted this model and investigated the performance of different types of control charts under the presence of measurement error while assuming linearly increasing variance (Haq et al.,2015, Hu et al.,2015, Hu et al.,2016a, Maleki et al., 2016, Maravelakis et al.,2004, Maravelakis,2012).
There were economic design researches considering the effect of measurement errors as well, however they mainly focused on control charts with fixed parame- ters. Rahlm investigated how non-normality and measurement error influences the economic design regarding X-bar control chart (Rahlm,1985). This research was ex- tended to asymmetric X and S charts by Yang, 2002. Additional studies proposed economical design method for memory-based control charts as well, such as ex- ponentially weighted moving average (EWMA) chart based on measurement error (Saghaei et al.,2014, Abbasi,2016).
Although, several studies investigated the performance of Shewhart control charts under the presence of measurement error, only a few have dealt with the measure- ment uncertainty related to the adaptive control charts. Hu et al. (2016b) developed VSS X-bar chart considering the effect of measurement error using linear covariate model. The same scholars later extended their research with the design of VSI X-bar control chart (Hu et al.,2016a).
plication of the control chart and analyzed the effect of measurement error on pro- cess control effectiveness but they did not take the decision outcomes (consequences) into account. Although, I have dealt with risk-based control chart development min- imizing the overall cost of decision outcomes in my former researches and contribu- tions (Heged ˝us et al., 2013b, Katona et al., 2014), these articles focused on X, MA and EWMA charts. In my thesis, I develop multivariate and adaptive control charts with the consideration of measurement error and the consequences of decisions in order to further extend the family of the risk-based control charts.
Not only univariate but the field of multivariate control charts was also reviewed during the literature search. Figure2.5shows the sub-graph of the risk-based multi- variate control charts.
RB
P
NP
A A
FP
FP
SS
SI
CL SS
SI
Maleki et al. (2016)
CL Tran et al. (2016)
Linna et al. (2001)
Huwang & Hung (2007) Chattinnawat & Bilen (2017)
Amiri et al. (2018) Abbreviations:
RB=Risk−Based P=Parametric NP=Non−Parametric A=Adaptive FP=Fixed Parameters SS=Sample Size SI=Sampling Interval CL=Control Limits
Legend:
Articles (Risk−Based aspect) Articles (Traditional aspect) Structure nodes Entire network
2 4 6 20 70
# of citations:
FIGURE 2.5: Result of the literature research (Control chart design research area - Multivariate subgraph)
Measurement error can reduce the power of control charts even in multivari- ate process control. Linna et al. (2001) investigated the performance of χ2 chart under the presence of measurement error and their study has inspired several re- searchers. Huwang and Hung (2007) and Amiri et al. (2018) investigated the effect of measurement errors on the monitoring of multivariate measurement variability.
In 2016, Maleki et al. (2016) used extended multiple measurement approach in or- der to reduce the effect of measurement error on ELR control chart while monitor- ing process mean vector and covariance matrix simultaneously. Performance of the Shewhart-RZ chart was examined under the presence of measurement error by Tran et al. (2016). Furthermore, Chattinnawat and Bilen concluded that measurement er- ror leads to inferior performance of the Hotelling’sT2 chart. Their study helps the practitioners to predict howT2will behave with respect to the precision of the gauge (i.e. %GRR).
Similarly to the univariate area, the aforementioned studies focused on the ef- fect of measurement errors on control chart performance, however they did not consider the decision outcomes or the risk of incorrect decisions due to the mea- surement error. After the literature review, Research Questions Q2 and Q3 are still valid because no study was found that develops multivariate or adaptive control chart with the consideration of measurement uncertainty and consequences of the correct/incorrect decisions as well.
It is necessary to note that uncertainties can relate to the system parameters (parametric uncertainty) and they can arise due to the modeling of complex systems (nonparametric uncertainties) (Adhikari,2007, Pokorádi,2008, Pokorádi,2009). Al- though there are solutions for the modeling of nonparametric uncertainties in engi- neering science (Oberkampf et al.,2002, Adhikari et al.,2007, Helton et al.,2007), the research area of control charts considers the effect of measurement error as paramet- ric uncertainty.
The results of the systematic literature review were analyzed for both research areas separately, however it is also valuable to determine how strong is the "linkage"
between the research areas of control charts and measurement uncertainty. Subsec- tion2.2.3introduces the citation relationships between the two networks.
2.2.3 Citations between the two networks
In order to analyze the "linkage" between the two networks, I also examined all the citation data to find those papers that were cited by studies from the other research field (network). Assume that paper "A" as part of the measurement uncertainty area is cited by paper "B" that develops a new control chart. In this case, their relationship is highlighted by an additional edge between them, indicating that they establish connection between "control chart" and "measurement uncertainty" research areas.
Figure2.6illustrates the citations between the two networks.
Measurement Uncertainty and conformity
Chattinnawat &
Bilen (2017)
BIPM (1995)
Eurachem (2007)
Legend:
Articles
Articles having citation from the other network Structure nodes
Hegedus &
Kosztyán
(2013) Eurachem
(2002) Abbasi
(2010) (2016)
Forbes (2006) AIAG (2002)
5
# of citations:
30 150
1000 5000
FIGURE2.6: Citations between the two networks
The citations between the two research areas are denoted by blue edges, and newly connected nodes are highlighted with green. As Figure 2.6 shows, only 9 papers and 6 citations could be found between the networks based on the condi- tions described above. Although there are studies developing control chart under the presence of measurement error, only few of them utilize the results given by researches related to measurement uncertainty and conformity control area.
The findings also confirm the importance of my research from connection’s point of view. As an additional contribution, my work also aims to strengthen "linkage"
between the two research fields by developing the aforementioned risk-based meth- ods that can be used in control chart design and conformity control.
In the previous subsections, I showed the structure of control chart and measure- ment uncertainty research areas. Networks can illustrate the gaps and commonly studied sub-areas very well however, as a weak point, they cannot show the research trends according to time.
To overcome this issue, in Subsection2.2.4, I introduce the most important "mile- stones" or research results based on the year of their publication.
2.2.4 Analysis of research trends
On Figure2.7, most important "milestones" or research results were placed onto a time line. Parallel research sub-areas are presented by multiple horizontal lines. If a research or study develops a new concept, new sub-area is also created and it is represented by an additional path on Figure2.7. For example, in 1947, Hotelling
developed multivariate control chart and opened the way of multivariate quality control which is denoted by an additional horizontal line.
The circles are representing publications moreover, specific papers dealing with control chart performance under the presence of measurement error are highlighted with green. It is necessary to note that of course, more additional research direc- tions could be identified based on different aspects (or categorization rules) (e.g., economic design researches, parameter estimation, etc...). In the interest of trans- parency, in this analysis, I use the same logic for the categorization of papers as it was introduced by Subsection2.1.2. In other words, parallel horizontal lines rep- resent the evolution of multivariate and adaptive control charts or measurement uncertainty evaluation / conformity control researches, while other important areas (like nonparametric chart design or measurement uncertainty evaluation based on moments) are mentioned in the discussion below.