Slow charging/discharging processes of the electrochemical double layer
Tamás Pajkossy
Institute of Materials and Environmental Chemistry
Research Centre for Natural Sciences, Hungarian Academy of Sciences Magyar tudósok körútja 2, Budapest, Hungary, H-1117
e-mail: pajkossy.tamas@ttk.mta.hu
Dedicated to the memory of Zdravko Stoynov.
Abstract
It is demonstrated for two cases of apparently ideal, ideally polarizable electrochemical interfaces that charging-discharging following potential changes is not instantaneous hence the double layer is not (solely) of electrostatic nature – as assumed in „classical” double layer theories. That is, physico-chemical interactions must also be considered to account for the slow double layer rearrangement processes.
1. Introduction
In general, the electrochemical double layer, in the absence of Faradaic reactions, is capacitive – at least, according to the textbooks and common electrochemical knowledge. The term “capacitive”
implies two properties: ability of charge storage and inverse proportionality of the impedance, Z, on angular frequency, ω. In what follows, the latter property will be in the focus.
Disregarding the rare, exceptional cases, even in the complete absence of Faradaic reactions the interfacial impedance deviates from the inverse proportionality on frequency. Such an electric element is often approximated by a constant-phase element (CPE), which is defined through its admittance Y()(i) where i is the imaginary unit, σ>0 and 0≤α≤1 are the CPE coefficient and exponent, respectively. Accordingly, the capacitance defined as C()Y()/(i), is also a power-law function of frequency. However, we do not use this approximation for the frequency dependence of the interfacial capacitance, or in other words, for the “capacitance dispersion”. The subject of this paper are the reasons why we get C() rather than a frequency independent C.
In general, the frequency dependence can be attributed (a) either solely to the double layer or (b) to a coupling of the solution resistance and the ideal, frequency-independent interfacial capacitance. Obviously, both effects can appear simultaneously, yielding very complicated C() dependence. Case (b) is a result of a purely physical effect associated with the geometry of the cell or of the working electrode: current density is not uniform along the electrode surface and the
"effective electrolyte resistance" varies along the surface. There are two important archetypes of the “case (b)” models. First, those of porous electrodes are usually based on de Levie’s finite transmission line model [1]; for a modern, comprehensive version see [2]. Second, the embedded disk electrode (often used in as a rotating disk) exhibit edge effects, i.e. the local current density at the rim of the disk is higher than at the center. The related theories predict capacitance dispersion at high frequencies [3,4]. The present author has also developed “case (b)” theories on capacitive electrodes of fractal geometry [5,6,7]; however, he finished that theoretical work with a final conclusion: for microscopically rough electrodes the observed C()capacitance dispersion is not due to the coupling of solution resistance with the interfacial capacitance. Instead, it is an inherent property of the double layer [8]. That is, for rough electrodes case (a) prevails.
For case (a) two sub-cases can be distinguished: First, when the surface is energetically homogeneous (like for single crystal surfaces) and second, when energetic inhomogeneities of the surface exist, e.g. due to atomic scale roughness. If there are other-than-electrostatic processes (like adsorption) involved in double layer charging, then energetic inhomogeneities lead to a certain activation energy distribution which in turn causes a time constant distribution of that charging process. This is why by decreasing atomic scale roughness the extent of capacitance dispersion can be decreased [9]. However, capacitance dispersion may appear also when the surface is energetically homogeneous. This is the subject of the present paper: we demonstrate this effect with capacitance spectra measured on single crystal electrodes in aqueous and also in ionic liquid electrolytes.
2. Methods: impedance spectroscopy and calculations of capacitances
Electrochemical impedance spectroscopy (EIS) has an abundant literature, hence the basics of this technique is skipped; a couple of less-emphasized features is mentioned as follows:
1. Impedance and derived quantities consist of a magnitude and a phase angle; this is why they can be handled in terms of complex calculus, as it was recognized by Kennelly [10], and can be plotted on the complex plane to yield Argand-diagrams. These are named as Nyquist-diagrams in the context of impedances. The frequency dependence of the impedance spectra is better seen if the Bode representation is used. Note that this representation is also a plot of a complex quantity because log(Z)log(Zabsexp(i))log(Zabs)i, i.e. the logarithm of the magnitude and the phase angle are the real and imaginary components of log(Z), respectively.
The Nyquist and Bode plots are the „natural” representations of the impedance spectra and its derivatives. This is why the use of other than these plots (like log(Re(Z))vs.log(),
)) log(Re(
. ))
log(Im(Z vs Z etc) are to be avoided. In the similar vein, it is a bad practice to use real and imaginary axes with non-equal units, yielding anisotropy of the complex plane.
2. The „as measured”, or the pre-processed data often comprise contributions bearing no relevance to the phenomenon studied. After their removal it is worth to use a representation which shows the essence and contains little if any of the incidental factors. This is why in double layer studies the use of the interfacial capacitance, C() is preferred to the measured impedance spectrum, Z(). The latter is transformed to C() spectrum using the
( ( ) )
/ 1 ) /(
)
( Yint i i Z Rs
C equation, where the subscript int refers to the interface and )
s Z(
R .
Such a representation has two advantages: First, it refers solely to the interface rather than both the interface and the electrolyte bulk. Second, the impedance (and also admittance) of an almost purely capacitive interface considerably depends on frequency; it is difficult to visualize a spectrum taken in a broad range of frequency as a complex plane plot. Points of a capacitance spectrum appear on a complex plane plot much more evenly, than those of impedance spectra.
3. The information obtained from EIS is always a potential derivative of a structural or a kinetic parameter (we get differential capacitances and resistances which are d/dE potential derivatives of surface charge and of charge transfer rates, respectively). For the determination of these latter quantities other considerations or quantities are needed. For example, for the determination of surface charge an integration constant is required.
4. Analysis of a measured Z() spectra is usually carried out with a comparison with the network
of could be related to the system studied. In this case the ingenious method of Stoynov and coworkers [11,12] may help: their “structural” or “differential” analysis of impedances may reveal characteristic time constants or time constant distributions.
5. The definition of impedance implies that the system is in equilibrium or at least in a steady state.
Slowly changing systems can also be characterized by impedance spectroscopy; in these cases the low frequency limit of the spectra should be determined by the Kramers-Kronig transform [13,14]
or similar tests [15,16]; all points below this limit frequency should be discarded. There exists a simple method, elaborated by Stoynov [17] to correct for the system’s drift: Consider a number of subsequent spectra measured with the same set of frequencies, on a slowly changing system. The moment of the measurement is recorded together with the spectrum data points (frequency, Re(Z), Im(Z)) for each points. Afterwards, for the impedance points of identical frequencies, k frequency one fits an appropriate smooth curve (typically a spline) to yield the Z(k,t) function.
Having Z(k,t) , one can calculate the Z(k) data points for any moment. This way the spectra can be corrected as if all points of one spectrum would have been measured in the same moment.
Using such a procedure of interpolation (or extrapolation), the rates of slow processes could be evaluated [18,19].
6. It is very important to ensure homogeneous current density distribution along the electrode surface. Nowadays EIS setups are commercially available with fairly high upper frequency limit.
With these, it is tempting to measure, analyze and present impedance spectra also in the frequency range even higher than 10-100 kHz. Unfortunately in this frequency range various artefacts appear due to inhomogeneous current density distributions; these are more pronounced when the electrolyte conductivity is low. As a thumb’s rule we suggest the use of cells where all the current streamlines are uniform everywhere (this condition is fulfilled with thin layer cells where the counter and working electrodes are parallel to each other). In general, the reference electrode junction point – e.g. the “Luggin capillary tip”– should be located at a position where the current streamlines are not bending (an example for inappropriate location is when the reference electrode sensing point is just at the edge of an embedded disk electrode). Because of cleanliness point of view it is often advisable to keep the reference electrode in a separate compartment – then the use of a capacitively coupled auxiliary reference electrode placed close to the reference compartment’s junction point is suggested [20].
3. Double layer capacitance in aqueous solutions
Many of the double layer studies have been carried out in aqueous electrolytes with Hg; on its smooth, energetically homogeneous surface the double layer is indeed capacitive. In contrast, on solid electrodes, even on noble metals, the appearance of a capacitive interface is an exception rather than a rule. For example, on Au(111), in perchloric acid solution, at potentials at which neither hydrogen evolution nor hydroxide adsorption proceeds, the interface is almost ideally capacitive. As it is demonstrated with Fig. 2 of Ref. [21], were the interfacial impedance approximated by a single CPE in four orders of magnitude of frequency, then its exponent would be very close to the unity (>0.99). If this interface is regarded to be ideally capacitive, then its specific capacitance is around 20 μF/cm2. This value is generally accepted as that of an electrostatic double layer, i.e. of the Stern-layer.
Whenever adsorption of anions is possible, then the frequency dependence is much more pronounced. Two cases are to be clearly distinguished:
(a) Double layer charging and adsorption are independent of each other. This is the case when we have some adsorbing species of minority concentration in a base electrolyte. Then, the double layer capacitance and the impedance of adsorption are parallel to each other and can be clearly separated – the latter term is a usual adsorption impedance comprising of resistive, diffusional and capacitive elements. This case can be adequately analyzed by the theory of adsorption impedance whose two roots are the papers of Dolin and Ershler [22] and of Frumkin and Melik-Gaykazyan [23]. These two theories were compiled to one in Ref. 24, for an interpretation of the present author, see the Appendix of Ref.21. This case is irrelevant from the point of view of the present paper.
(b) Double layer charging and of adsorption are coupled processes (hence are not independent of each other). The simplest case is when the adsorbate species is the same as the one forming the double layer – as it is the case with binary electrolytes. The same ion takes part in the charging of the electrostatic double layer and in the adsorption process. In what follows, the examples refer to such a situation.
It is worth to start with the well-known system of polycrystalline platinum in aqueous sulphuric acid solution. It is known from radiotracer studies [25,26] that in the double layer region (between approximately 0.4 and 0.8 V vs RHE) the surface is covered with adsorbed sulfate ions (to be precise, by bisulphate ions). The impedance in this region is not ideally capacitive, some frequency dispersion can be observed [3]. The frequency dispersion practically diappears for well-defined single crystalline surfaces, like for Pt(111), see Fig.2. of Ref. [27] and for Pt(100), Fig.3 of Ref. [28].
The high value of the interfacial capacitance – 60-80 μF/cm2 rather than the 15-25 μF/cm2 prevailing for the electrostatic double layer – points to a thin double layer, i.e. sulphate on platinum is in an adsorbed state. The little if any frequency dispersion implies that movement of adsorbate across the double layer is fast.
Fig.1. (a) CV of 50 mV/s of Ir(100) in 0.1M HCl (solid line) and the metal’s charge as function of the potential (dashed line). (b) The equivalent circuit of the electrode. Rs is due to the electrolyte bulk, whereas the other elements represent properties of the interface. The W element is an empirical “pseudo-Warburg” element. (c) Capacitance spectra at potentials as indicated. Points at frequencies 1kHz, 100Hz, 10Hz and 1 Hz are marked by solid symbols; the frequency of the topmost spectrum points are labelled. Solid lines: fitted spectra; the equivalent circuit is shown in (b). The spectra are shifted along the abscissa due to visibility reasons.
In contrast, in hydrochloric acid the interfacial capacitance exhibits a remarkable frequency dispersion in the double layer region of various single crystalline platinum group metal electrodes [29]. Two of these systems, Ir(100) and Pt(100) in HCl deserve a closer look [28,30].
The cyclic voltammogram (CV) of Ir(100) in 0.1M HCl is shown in Fig. 1a. There is an approximately 0.4V broad featureless potential region, which might be called as double layer region. Since the potential of zero total charge, pztc, is just in the peak at -0.1 V; in the double layer region the electrode surface is covered by the anions, i.e. by chloride ions. The impedance spectra there can be well fitted with the impedance spectra of an empirical equivalent circuit of Fig.1b; the capacitance spectra (both the measured and fitted) are shown in Fig.1c. The fits are quite good; the high frequency limit of the capacitance is about 20 μF/cm2, ie. the same as that of the electrostatic double layers. In contrast, the low frequency limit is about 50-60 μF/cm2 implying a two-three times thinner double layer. This is in accord with a view that following a very fast positive potential change, the chloride ions can enter the outer Helmholtz plane (OHP) from the bulk of the solution;
whereas in a much longer time they can approach also the surface taking an adsorbed position in the inner Helmholtz plane (IHP). Note that the ion which gets adsorbed, first has to cross the OHP, so adsorption and double layer charging are sequential rather than parallel processes. The kinetics of the anion moving between the OHP and the IHP is expressed by the R and W (Warburg) terms of the equivalent circuit. We have no theory for the appearance of W – we regard it as an empirical element of the model. Nevertheless, even if a model is lacking, we still may claim that the ωmax
frequency (or its reciprocal, a time constant) of the topmost point of the arc characterizes the rate
of the process; and the shape of the arc gives a clue whether the time constant distribution of the adsorption is narrow or broad. As it is seen on the arcs of Fig. 1c, the arcs are semicircle-like at +0.1V and depressed semicircle at +0.3V, respectively – according to that the W term of the RW branch plays a more important role at more positive potential. The topmost frequency is also smaller for more positive potentials, i.e. more time is needed then for the adsorption-desorption processes. These properties of the RW branch can be tentatively connected to the “crowded”
nature of the chloride adlayer. In general, adsorption onto a zero-coverage, homogeneous surface is a single-time-constant process. In contrast, when coverage is close to unity, adsorption requires a concerted movement of many adsorbate species: The sequence of the steps are first the formation of an empty place, then the adsorption step, finally the rearrangement of the adlayer.
Such a collective movement requires more time; the many individual processes imply a certain time constant distribution.
The CV of the other system to be discussed: Pt(100) in 1M HCl solution is shown in Fig.2a, the capacitance spectrum at the positive potential end of the CV is displayed in Fig.2b. The capacitance spectra for HCl solutions on Ir(100) and Pt(100) are rather similar to each other. We note that similar spectra of arc shapes have been found by us using other Pt-group metal single crystals, also with Br- and I- containing electrolytes [29].
For comparison, Fig.2 consists also the CV and a capacitance spectrum of Pt(100) in 0.5M H2SO4, measured the just the same way as in the 1 M HCl solution. The voltammograms and the pztc values (as displayed in Fig.2a) just as the capacitance spectra are rather different. Since the H+ concentration of the two solutions is approximately the same, the difference – at least positive to the pztc – is evidently due to the different properties of the anion adlayer. The spectrum in H2SO4
solution is practically a single point, at about 80 μF/cm2. We note that similar single-point like spectra have been found by us using other Pt-group metal single crystals, also with phosphate (at the given pH, H2PO4-
) ion containing electrolytes [29].
This single-point behaviour can be interpreted in the following way: also for this system, the high frequency end of the capacitance arc is assumed to be at about 20 μF/cm2; this hypothetical arc is indicated by a dashed line in Fig.2b. The topmost frequency of this arc, ωmax is at very high frequencies, orders of magnitudes higher than the audio-frequency range of the capacitance (probably in the MHz range). In other words, adsorption-desorption of sulphate appears to be much (orders of magnitudes) faster than of chloride. This difference can be easily explained as follows: With impedance measurements we get information on the displacement of charges – without learning anything on their chemical nature. That is, in the case of (bi)sulphate adsorption- desorption we cannot distinguish between bisulphate adsorption and H+ release from an adsorbed bisulphate ion. Both processes lead to one electron removal from the metal surface. However, adding one bisulphate ion to an already crowded adlayer requires much more time than removing one H+ ion from a bisuphate anion – this dissociation process does not require the rearrangement of the neighbourhood within the adlayer. Hence we conclude that the “single-point” capacitance spectrum is due to the dissociation of the adsorbed bisulphate ions which process appears as H+ desorption/adsorption. We note that the H+-releasing nature of the bisulhate/sulphate adlayer has already been demonstrated by combined voltammetric and radiotracer measurements [31]
Fig.2 (a). CVs of 50 mV/s (solid lines) along with the metal’s charge vs potential curves (dashed lines) of Pt(100) in 0.5M H2SO4 (thick lines) and in 1M HCl (thin lines).
(b) Capacitance spectra at +0.3V (points: measured spectra), solid line: fitted spectrum (in HCl solution); dashed line: hypothetical high frequency spectrum in H2SO4 solution.
4. Double layer capacitance in ionic liquids
Ionic liquids (ILs) are salts whose melting point is below 100 oC; many of them are (more-or-less viscous) fluids at room temperature. Due to their properties like non-volatility, non-flammability and electric conductance these salts attracted much interest in various areas of chemistry [32]. For practical purposes they are regarded as promising electrolytes [33]. An important group of ILs comprises imidazolium cations [34].
As ILs are concentrated electrolytes, the C(E) function of the metal | IL interfaces is relevant from theoretical point of view. In the related models the charge density is limited everywhere (in contrast to theories with of dilute electrolytes, “lattice saturation” prevents accumulation of much charge anywhere). Since the start of the ionic liquid electrochemistry studies one of the important issues was whether or not the measured C(E) curves can be interpreted in terms of Kornyshev’s IL double layer model [35,36], predicting “bell-shaped” or “camel-shaped” C(E) curves. Up till now this question is open; the measurements are still not good enough to support or disprove related statements. There are two reasons for this. One is a cleanliness problem: the ionic liquids are usually much less pure than the aqueous electrolytes; the second is related to modelling problem as will be explained in the following paragraphs.
Various groups reported C(E) measurements (either performed at one frequency with scanned potential, or calculated from impedance spectra) made on poly- or single-crystalline gold [37,38,39,40,41] or other electrodes like polycrystalline Pt [42], on carbon [43,44], on Bi(111) [45,46,47,48,49,50]; in most studies the electrolytes were the commercially available imidazolium- based ILs. We have focused our attention to the behaviour of two single crystal faces of gold, Au(111) and Au(100), because we regarded gold to be just as inert as in aqueous solutions. In most cases we used 1-butyl-3-methyl-imidazolium (BMI) salts, with PF6 or bis(trifluoromethylsulfonyl) imide, Tf2N, anions. After a few years of laboratory work with these systems [51,52,53,54,55], we recognized that gold is far from being inert in BMIPF6 and other N-heterocycles-consisting ILs. Up till this recognition the low frequency impedance behaviour was attributed to the double layer
charging rather than to a dissolution + eventual re-deposition process. But in-situ scanning tunneling microscopy (STM) images, demonstrating the presence of etch-pits and corrugating step- edges provided direct evidence for the latter case [56]. Thus, even on the noble metal of gold, we face the problem of separation of charging and charge transfer processes.
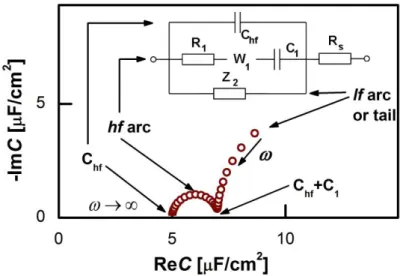
Fig. 3. Schematic capacitance spectrum of the metal-ionic liquid interface and its general equivalent circuit. Rs is due to the electrolyte bulk, whereas the other elements represent properties of the interface. The W1 element is an empirical “pseudo-Warburg” element. In some cases this W element was replaced by a CPE. The Z2 impedance (if any) is a serial R–CPE–C circuit, or a subset of it (CPE, R–W–C etc.).
Fig. 4. Capacitance spectra of various electrodes – unless otherwise noted – in BMIPF6. All spectra have been measured at, or the close vicinity of, –0.1 V. The characteristic frequency of the high
A couple of typical measured capacitance spectra are shown in Fig.4; they can be well interpreted in terms of the equivalent circuit of Fig.3. The corresponding theoretical spectra, as shown on the complex plane plot of Fig. 3 comprise a high frequency arc between Chf and Chf+C1 and a low frequency arc or tail. Accordingly, we have to analyze the measured spectra using the equivalent circuit of the inset, then draw conclusions regarding double layer charging from Chf, C1, R1 and W1
elements only – all elements related to the lf tail can be disregarded.
The hf arc was apparent in all but one systems studied by us. (The exception is our first IL measurement series [51], where cleanliness, reproducibility and measurement precision was not sufficient to resolve the hf arc.) First, Chf appeared to be independent of the metal (cf. Fig.4); its potential dependence is little if any (the potential dependences of the spectra are well documented in Refs. 53,54,55,56). Chf was found to depend on the cation rather than the anion:
the larger the cation the smaller Chf values were found. Second, for C1, the span of the lf arcs is in the range of 1–3 µF/cm2, we found neither trends of the values nor can we offer any explanation for the order of magnitude of these values. Third, the order of magnitude of the characteristic frequency of the hf arcs, ωmax, is in the range between 100 Hz and 1 kHz. This frequency increases with higher temperatures (see Fig.6a of Ref. 56). Whereas Chf and C1 do not depend on temperature, the temperature dependence of ωmax (the "Arrhenius plot" and the associated activation energy) is rather similar to that of the bulk conductivity of the ionic liquid (Ref. 56, Fig.
6b). This is why we suspect that the rearrangements of the double layer and the ionic movements require similar activation processes.
There exist reports on similar studies – for an overview on these see, e.g. Ref. 57. One group’s work deserves mentioning here: Roling and coworkers studied a number of similar electrochemical systems with Au(111) [38,39,40,41]. Though the representation of their impedance/capacitance spectra markedly differs from that of ours; – after all – their conclusions are similar to the above ones.
The main, phenomenological outcome of these studies is that the double layer capacitance, Cdl of a metal |ionic liquid interface at a given potential is not a single, frequency independent value, but is a function of frequency, involving (at least) three parameters. The high and low frequency limiting values of Cdl(ω) (Chf and Chf + C1 in this model) can be interpreted as they refer to the “frozen” and
“relaxed” states, respectively. The characteristic time (reciprocal of the angular frequency of the topmost point along the capacitance arc) represents the kinetics of the rearrangement of the double layer.
5. Summary and conclusions:
It is demonstrated for two cases of apparently ideal, ideally polarizable electrochemical interfaces that the interfacial capacitance does depend on frequency. In other words, charging-discharging following potential changes is not instantaneous. A double layer with non-zero characteristic time cannot be interpreted in terms of electrostatics – as the name of electrostatics implies, in that discipline there is no time involved as a variable. Electrostatic charging/discharging is infinitely fast;
hence, for the rationalization of the – not infinitely fast – charging/discharging we have to assume processes of physico-chemical origin.
The existing double layer theories (Helmholtz, Gouy-Chapman-Stern, Bockris-Devanathan-Müller, etc) are all based on electrostatic interactions and hence time/frequency is not a variable therein (this applies also to newer MC, MD, DFT calculations). Double layer theories are wanted which include kinetic processes based on physico-chemical interactions.
The frequency dependence of the double layer has a consequence on how we evaluate electrode kinetics data: These are calculated from transient or EIS measurements, the procedures require the
proper separation of the Faradaic and charging currents (provided that it is possible). Corrections of kinetics data by taking into account the double layer charging are typically approximations using Cdl or CPE, which in turn affect the accuracy of data on electrode kinetics.
Acknowledgements:
The research within project No. VEKOP-2.3.2-16-2017-00013 was supported by the European Union and the State of Hungary, co-financed by the European Regional Development Fund.
Additional support of the Hungarian Science Research Fund OTKA (No. K112034) is acknowledged.
References:
1 R. de Levie, On porous electrodes in electrolyte solutions—IV, Electrochim. Acta 9 (1964) 1231
2 J. Huang, J. Zhang, Theory of impedance response of porous electrodes: simplifications, inhomogeneities, non-stationarities and applications, J. Electrochem. Soc. 163 (2016) A1983 3 S.H. Glarum, J.H. Marshall, An A‐C Admittance Study of the Platinum/Sulfuric Acid
Interface, J. Electrochem. Soc., 126 (1979) 424
4 S-L Wu, M.E. Orazem, B. Tribollet, V. Vivier, The impedance response of rotating disk electrodes, J. Electroanal. Chem. 737 (2015) 11
5 L. Nyikos, T. Pajkossy, Fractal dimension and fractional power frequency dependent impedance of blocking electrodes, Electrochim. Acta 30 (1985) 1533
6 T. Pajkossy, L. Nyikos, Scaling-law analysis to describe the impedance behaviour of fractal electrodes, Phys. Rev. B 42 (1990) 709
7 T. Pajkossy, Generalization of Basic Laws of Electrochemistry for Fractal Surfaces, Heterogeneous Chemistry Reviews 2 (1995) 143
8 T. Pajkossy, Impedance of rough capacitive electrodes, J. Electroanal. Chem. 364 (1994) 111 9 Z. Kerner, T. Pajkossy, On the origin of capacitance dispersion of solid electrodes,
Electrochim. Acta 46 (2000) 207
10 A.E. Kennelly, Impedance, Transactions of the American Institute of Electrical Engineers X (1893) 172
11 Z Stoynov, Structural spectral analysis of electrochemical impedance, Electrochim. Acta 34 (1989) 1187
12 Z. Stoynov, D. Vladikova, Differential Impedance Analysis, Marin Drinov Publ. House, Sofia, 2005
13 D. D. Macdonald, M. Urquidi, Application of Kramers‐Kronig Transforms in the Analysis of Electrochemical Systems I. Polarization Resistance, J. Electrochem. Soc. 132 (1985) 2316 14 B.A.Boukamp, J.R. Macdonald, Alternatives to Kronig-Kramers transformation and testing,
and estimation of distributions, Solid State Ionics 74 (1994) 85
W. Ehm, H. Göhr, R. Kaus, B. Röseler, C.-A. Schiller, The evaluation of electrochemical
16 C.-A. Schiller, F. Richter, E. Gülzow, N. Wagner: Validation and evaluation of electrochemical impedance spectra of systems with states that change with time, Phys.Chem.
Chem. Phys. 3 (2001) 374
17 Z.Stoynov, Nonstationary impedance spectroscopy, Electrochim. Acta 38 (1993) 1919
18 M. Ujvari, D. Zalka, S. Vesztergom, S. Eliseeva, V. Kondratiev, G.G. Láng, Electrochemical impedance measurements in non-stationary systems - application of the 4-dimensional analysis method for the impedance analysis of overoxidized poly(3,4- ethylenedioxythiophene)-modified electrodes, Bulg. Chem. Comm. 49 (2017) 106
19 V. Horvat-Radosevic, K. Kvastek, K.M. Kosicek, Application of Stoynov's 4-D analysis for nonstationary impedance spectra corrections of thin poly(o-ethoxyaniline) modified Pt electrode, Bulg. Chem. Comm. 49 (2017) 119
20 C.C. Herrmann, G.P. Perrault, A.A. Pilla, Anal. Chem. 40 (1968) 1173
21 Z.Kerner, T.Pajkossy, Measurement of adsorption rates of anions on Au(111) electrodes by impedance spectroscopy, Electrochim. Acta 47 (2002) 2055
22 P. Dolin, B. Ershler, Kinetics of processes on the platinum electrode, Acta Physicochim.
URSS XIII. (1940) 747
23 A.N. Frumkin, V.I. Melik-Gaykazyan, Determination of the kinetics of organic substances by measuring the capacitance and conductivity at the electrode-solution boundary (in Russian), Dokl. Akad. Nauk. 5 (1951) 855.
24 W. Lorenz, F. Möckel, Adsorptionsisotherme und Adsorptionskinetik kapillaraktiver organischer Molekeln an der Quecksilberelektrode, Z. Elektrochem. 60 (1956) 507
25 G. Horányi, J. Solt, F. Nagy, Investigation of adsorption phenomena on platinized platinum electrodes by tracer methods, II. The potential dependence of anion adsorption, J.
Electroanal. Chem., 31 (1971) 95
26 Maria E. Gamboa-Aldeco, Enrique Herrero, Piotr S. Zelenay and Andrzej Wieckowski, Adsorption of bisulfate anion on a Pt(100) electrode: a comparison with Pt( 111) and Pt(poly), J. Electroanal. Chem., 348 (1993) 451
27 E. Siebert, R. Faure, R. Durand, Electrosorption impedance on Pt(111) in sulphuric media and nature of the “unusual” state, Electrochem. Comm. 3 (2001) 181
28 T. Pajkossy, Impedance Spectra of Pt(100) in Aqueous H2SO4 and HCl Solutions Around the Hydrogen Adsorption-Desorption Peak. Zeitschrift für Physikalische Chemie 226 (2012) 935 29 T. Pajkossy, D.M. Kolb, Anion-adsorption related frequency-dependent double layer
capacitance of the platinum group metals in the double layer region, Electrochim. Acta 53 (2008) 7403
30 T. Pajkossy, and D.M. Kolb, Double layer capacitance of the platinum group metals in the double layer region, Electrochem.Comm. 9 (2007) 1171
31 A. Kolics, A. Wieckowski, Adsorption of Bisulfate and Sulfate Anions on a Pt(111) Electrode, J. Phys. Chem. B 105 (2001) 2588
32 A. Kokorin (Ed.), Ionic Liquids: Applications and Perspectives, InTech, Rijeka, Croatia, 2011
33 M. Galiński, A. Lewandowski and I. Stępniak, Ionic liquids as electrolytes, Electrochim. Acta
51 (2006) 5567
34 J. S. Wilkes and M. J. Zaworotko, Air and water stable 1-ethyl-3-methylimidazolium based ionic liquids, J. Chem. Soc. Chem. Comm. 13 (1992) 965
35 A.A. Kornyshev, Double-layer in ionic liquids: paradigm change?, J.Phys.Chem.B 111 (2007) 5545
36 M. V. Fedorov, A. A. Kornyshev, Towards understanding the structure and capacitance of electrical double layer in ionic liquids, Electrochim.Acta 53 (2008) 6835
37 T. R. Gore, T. Bond, W. Zhang, R.W.J. Scott, I.J. Burgess, Hysteresis in the measurement of double-layer capacitance at the gold–ionic liquid interface, Electrochem. Comm. 12 (2010) 1340
38 M. Drueschler, B. Huber, B. Roling, On Capacitive Processes at the Interface between 1- Ethyl-3-methylimidazolium tris (pentafluoroethyl) trifluorophosphate and Au (111), J. Phys.
Chem.C 115 (2011) 6802
39 B. Roling, M. Drüschler, B. Huber, Slow and fast capacitive process taking place at the ionic liquid/electrode interface, Faraday Discuss. 154 (2012) 303
40 M. Drüschler, N. Borisenko, J. Wallauer, C. Winter, B. Huber, F. Endres, B. Roling, New insights into the interface between a single-crystalline metal electrode and an extremely pure ionic liquid: slow interfacial processes and the influence of temperature on interfacial dynamics, Phys. Chem. Chem. Phys. 14 (2012) 5090
41 R.Atkin, N. Borisenko, M. Drüschler, F. Endres, R. Hayes, B. Huber, B. Roling, Structure and dynamics of the interfacial layer between ionic liquids and electrode materials, J. Mol.
Liquids 192 (2014) 44
42 M. Drueschler, B. Huber, S. Passerini, B. Roling, On Capacitive Processes at the Interface between 1-Ethyl-3-methylimidazolium tris (pentafluoroethyl) trifluorophosphate and Au (111), J. Phys. Chem.C 114 (2011) 3614
43 V. Lockett, M. Horne, R. Sedev, T. Rodopoulos, J. Ralston, Differential capacitance of the double layer at the electrode/ionic liquids interface, Phys.Chem.Chem.Phys. 12 (2010) 12499 44 F. Silva, C. Gomes, M. Figueiredo, R. Costa, A. Martins, C. M. Pereira, The electrical double
layer at the [BMIM][PF6] ionic liquid/electrode interface–Effect of temperature on the differential capacitance, J. Electroanal. Chem. 622 (2008), 153
45 L.Siinor, K.Lust, E.Lust, Electrical Double Layer Structure at Bi (111) | 1-ethyl-3-methyl- imidazolium Tetrafluoroborate Interface, ECS Transactions, 16 (2009) 559
46 L. Siinor, K. Lust, E. Lust, Electrical Double Layer Capacitance at Bi (111) | 1-Ethyl-3- methylimidazolium Tetrafluoroborate Interface as a Function of the Electrode Potential, J.
Electrochem.Soc. 157 (2010) F83
47 L.Siinor, K.Lust, E.Lust, Influence of anion composition and size on the double layer capacitance for Bi (111)| room temperature ionic liquid interface, Electrochem. Comm. 12
48 L. Siinor, C. Siimenson, V. Ivaništšev, K. Lust and E. Lust, Influence of cation chemical composition and structure on the double layer capacitance for Bi (1 1 1)| room temperature ionic liquid interface, J. Electroanal. Chem. 668 (2012) 30
49 E. Anderson, V. Grozovski, L. Siinor, C. Siimenson, V. Ivaništšev, K. Lust, S. Kallip, E.
Lust, Comparative in situ STM, cyclic voltammetry and impedance spectroscopy study of Bi (111)| 1-ethyl-3-methylimidazolium tetrafluoroborate interface, J. Electroanal. Chem. 709 (2013) 46
50 E. Anderson, V. Grozovski, L. Siinor, C. Siimenson, E. Lust, J. Electroanal. Chem. 758 (2015) 201
51 M. Gnahm, T. Pajkossy, D.M. Kolb, The interface between Au(111) and an ionic liquid, Electrochim. Acta 55 (2010) 6212
52 T. Pajkossy, D.M. Kolb, The interfacial capacitance of Au(100) in an ionic liquid, 1-butyl- 3methyl-imidazolium hexafluorophosphate, Electrochem. Comm. 13 (2011) 284
53 M. Gnahm, C. Müller, R. Répánszki , T. Pajkossy, D.M. Kolb, The interface between Au(100) and 1-butyl-3-methyl-imidazolium-hexafluorophosphate, Phys.Chem. Chem. Phys.
13 (2011) 11627
54 C. Müller, S. Vesztergom, T. Pajkossy, T. Jacob, The interface between Au(100) and 1-butyl- 3methyl-imidazolium-bis(trifluoromethylsulfonyl)imide, J. Electroanal. Chem. 737 (2015) 218
55 C. Müller, S. Vesztergom, T. Pajkossy, T. Jacob, Immersion measurements of potential of zero total charge (pztc) of Au(100) in an ionic liquid, Electrochim. Acta 188 (2016) 512 56 C. Müller, K. Németh, S. Vesztergom, T. Pajkossy, T. Jacob, The interface between HOPG
and 1-butyl-3-methyl-imidazolium hexafluorophosphate, Phys.Chem.Chem.Phys. 18 (2016) 916.
57 T. Pajkossy, C. Müller and T. Jacob, Phys.Chem.Chem.Phys., submitted (2018)