T. Pajkossy et al, Phys.Chem.Chem.Phys., DOI: 10.1039/c8cp02074d
The metal – ionic liquid interface as characterized by impedance spectroscopy and in-situ scanning tunneling microscopy
Tamás Pajkossy*a, b, Claus Müllerb, and Timo Jacobb, c,d
Abstract
We summarize our results of electrochemical measurements carried out on inert or close-to-inert metals in ionic liquids, with the aim to explore the metal | ionic liquid interface structure. To this we used electrochemical methods: cyclic voltammetry, impedance spectroscopy, potential of zero total charge measurements and structure-sensitive techniques, such as in-situ scanning tunneling spectroscopy. The studied systems were mostly single crystals of noble metals in imidazolium-based ionic liquids. The two main findings are: (i) in the potential window where no Faradaic reactions occur, the interfacial capacitance exhibits a frequency dependence due to double-layer rearrangement processes and (ii) in certain cases ordered anion and cation structures exist at the interface.
Introduction
Ionic liquids (ILs) are salts of low melting points (< 100 oC); many of them are liquid even at room temperature. They have been attracting much interest recently in various fields of chemistry [1-41,2,3, 4], because of properties such as non-volatility, non-flammability and electric conductance [5]. Hence, they are promising electrolytes [6] to be used, e.g. in metal deposition processes [7]. The archetype of the water- and air-stable ILs is based on imidazolium cations [8].
The electrochemical behavior of metals in ionic liquids has triggered growing interest in the past two decades. One of the fundamental aspects of this set of problems is the understanding of the structure and the dynamics at the metal | electrolyte interface, that is at the electrochemical double layer (EDL). For this reason, several experimental approaches (spectroscopic and microscopic techniques) were applied and improved in the recent years to obtain deeper insights into the interface at a molecular level (for details see Ref. 9). For instance, infrared absorption spectroscopy turned out to be a suitable technique for the characterization of solid | liquid interfaces, as well as Raman scattering spectroscopy and sum frequency generation. UV-VIS spectroscopy and acoustic- related techniques were used to determine surface coverages. Spectroscopic studies by using X-rays and neutrons are applicable to obtain electronic and structural information of interfaces. Besides spectroscopic techniques, the use of microscopic methods has been established, e.g. in-situ scanning tunnelling microscopy (in-situ STM); images obtained with this method appear also in this overview.
It enables the visualization of interfaces in high resolution even during electrochemical measurements.
Based on this technique the ordering of organic molecules — long-chain alkanes, alcohols, acids — on substrates of well defined structure (graphite, gold single crystals) could be studied as well as the influence of guest molecules on the interfacial structure. In-situ STM gives also insights in the dynamics of interfacial processes such as adsorption and deposition processes of metals [10-1210,11,12].
a Corresponding author. Permanent address: Institute of Materials and Environmental Chemistry, Research Centre for Natural Sciences, Hungarian Academy of Sciences, Magyar tudósok körútja 2, Budapest, Hungary, H-1117; e-mail: pajkossy.tamas@ttk.mta.hu
b Institute of Electrochemistry, Ulm University, Albert-Einstein-Allee 47, 89081 Ulm, Germany
c Helmholtz-Institute-Ulm (HIU) Electrochemical Energy Storage, Helmholtzstr. 11, 89081 Ulm, Germany
d Karlsruhe Institute of Technology (KIT), P.O. Box 3640, 76021 Karlsruhe, Germany
Hereby in former studies, the main focus was on the adsorption of halides on single metal crystals and the influence of the potential on these adlayers [13]. Regarding ionic liquids, for instance, a formation of an ordered PF6 adlayer was observed on a polarized Au(111) electrode in 1-butyl-3- methyl-imidazolium hexafluorophosphate [14] (BMIPF6) and the electrodeposition of Ga islands from GaCl3 in 1-butyl-3-methyl-pyrrolidinium bis(trifluoromethylsulfonyl)imide (BMPTf2N) could be imaged [15]. In addition, reconstruction processes at the electrified Au(111) surface could be studied in these electrolytes [16,17].
A helpful addition to experimental studies are theoretical calculations and simulations. In the context of ionic liquids Kornyshev’s “paradigm change” paper [18] turned out to be an important step forward [19,20]. A lattice gas model for highly concentrated electrolytes was developed based on mean field theory (MFT). By using this model with some simplifications (identical ions, no interactions, equilibrium) an equation could be derived which describes the potential dependence of the interfacial capacitance. Additionally, the introduction of a so-called packing parameter (γ), which describes the degree of lattice saturation of ions enabled to also consider the concentration of these solvents. Higher γ values (> 1/3) are related to a higher ion density, causing “bell-shaped”
capacitance curves with multilayering at sufficiently polarized electrodes. In contrast, lower γ values (< 1/3) are linked with “camel-shaped” interfacial capacitance curves. This behavior was qualitatively attributed to the effects of so-called overscreening and lattice saturation [21]. Note that the lattice-model-related term “lattice saturation” means that in ionic liquids the ion density due to steric hindrance can nowhere exceed a certain limit. This leads to the differential capacitance decrease with increasing charge density – that is, to a “bell-shaped” capacitance curve – as it was shown also by Oldham’s IL double layer model [22].
Based on Kornyshev’s fundamental model further calculations and simulations were performed, which considered aliphatic chains [23,24]. Additionally a new approach for describing the EDL of ionic liquids as 3D entities was developed by Kornyshev et al. [25] In line with analysis from Kirchner et al.
[26], Merlet et al. [27] and Ivaništšev et al. [28], this approach is a fundamental step to understand the impact of the electrode’s applied potential (or charge density) on the electrolyte; namely from the structure in the innermost adlayer (and restructuring processes related to this adlayer) up to several multilayers of the electrolyte.
Density functional theory (DFT) calculations combined with molecular dynamics (MD) simulations were also used to examine the EDL thickness, especially the double layer of Au(111) in 1-ethyl-3- methylimidazolium tetrafluoroborate (EMIBF4) [29]. For this system the existence of multilayers could be confirmed.
Further studies from Rotenberg et al. linked DFT modelling with electrochemical methods. By this combination capacitive peaks, interfacial dynamics, reactivity and potential-dependent friction properties could be explained by transition processes at the interface [30]. But the authors also outlined difficulties in associating experimental and theoretical works. On the experimental side, exact structures and compositions are still unclear. On the theoretical side, limitations are caused by technical difficulties such as the use of constant applied potentials and particular bonding. The role of impurities, temperature, influence of solvents and the topography of the electrode’s surface are also aspects that should be considered in more detail.
In experimental electrochemical studies, a typical goal is the determination of the electronic charge of the electrode at a given electrode potential. Such a goal can be persued by measuring the interfacial capacitance, C, as a function of electrode potential, E; charge is obtained by integration of C(E), with the potential of zero total charge, pztc, being one integration limit. The latter quantity can be determined by immersion measurements.
The C(E) function is preferably determined under the condition that no Faradaic reactions proceed, using electrochemical impedance spectroscopy (EIS). As it is exemplified in the forthcoming chapter, correct determination of the C(E) function is often very difficult. In conjunction with impedance or
pztc measurements, general characterizations (e.g. the cleanliness tests) of the electrochemical system are done by taking cyclic voltammograms, CVs.
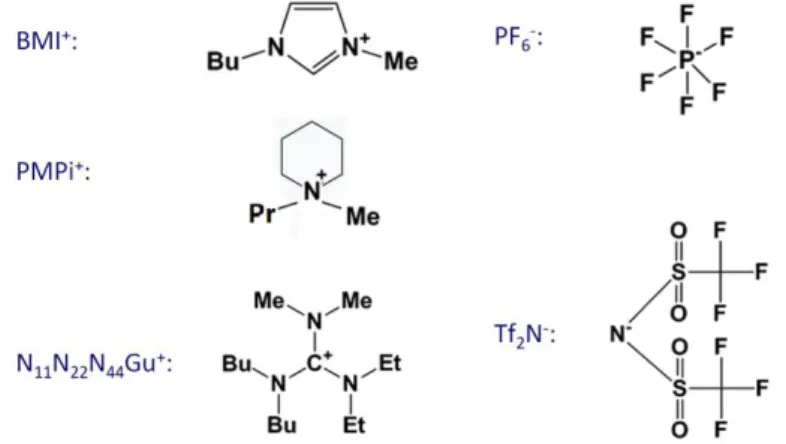
The growing interest on ionic liquid electrochemistry initiated related double-layer studies about a decade ago also in the Ulm laboratory of the late Professor Dieter Kolb. Since then, we have performed many measurements; the reports on these are given in Refs. [31-38].31,32,33,34,35,36,37,38The present overview is a summary of the obtained findings, extended with new measurements, in order to draw a more complete picture of these interesting systems. The experiments were done on single crystals of Au, Ag and Pt – mostly of (100) orientation – and on graphite (highly-oriented pyrolytic graphite, HOPG). The ionic liquid constituents of the experimentally studied systems are summarized in Fig. 1.
Fig. 1. Ions of ionic liquids used for the experiments.
The systematic names are as follows: BMI: 1-butyl-3-methyl-imidazolium; PMPi: N-propyl-N-methyl- piperidinium; N11N22N44Gu:N,N-dibutyl-N’,N’-diethyl-N’’,N’’-dimethyl-guanidinium; PF6: hexafluoro- phosphate; Tf2N: bis(trifluoromethylsulfonyl)imide.
Mentioned are in the text also the following cations: BMP: 1-butyl-3-methyl-pyrrolidium; EMI, PMI, HMI and OMI: 1-alkyl-3-methyl-imidazolium where “alkyl” stands for ethyl, propyl, hexyl and octyl, respectively.
Special emphasis is put on the present state of our understanding and also on those of our previous statements, which were proven to be in parts incomplete. This is why the results are overviewed in their logical rather than in chronological order of the experiments. Details of the experiments and the methods can be found in the corresponding original articles: in particular Ref. 36 for impedance measurements and capacitance analysis as well as Ref. 37 for immersion measurements and Ref. 34 for in-situ STM.
Results
The starting experiments
The starting point was the determination of the C(E) function of the Au(111) | BMIPF6 system. We chose this IL because at that time it was commercially available in high purity; the choice of Au(111) was due to the fact that gold is inert indeed, and the (111) surface is easy to be prepared reproducibly in sufficiently high quality. We initiated our studies with BMIPF6, which was a widely used ionic liquid being commercially available in high purity. With this metal | IL system, we attempted to reproduce the capacitance–potential C(E) curves published at that time [39-42],39,40,41,42, and to find out whether or not these C(E) curves can be interpreted in terms of Kornyshev’s mean-field double layer model [18,20,43], predicting “bell-shaped” or “camel-shaped” curves, or by Oldham’s related model [22]. We soon faced the problem that in the middle of the “potential window” – that
is, in the potential range where apparently no Faradaic processes appear – the interfacial capacitance, as calculated from the impedance spectra, is a function of frequency ω. Throughout our studies, this function C(ω) named as capacitance spectrum, has been calculated from the impedance spectra in two-steps. First, the appropriate equivalent circuit’s parameters were fitted to the Z(ω) impedance spectra, yielding – among others – the serial resistance, Rs. In the second step, the capacitance is calculated as C(ω)=1/[iω(Z(ω)-Rs)]. Note that C(ω) is a quantity characteristic for the interface – in contrast to Z(ω), which is a characteristic of both the interface and bulk electrolyte.
The measured spectra of the Au(111) | BMIPF6 system could be modelled by equivalent circuits comprising of a capacitance and a constant phase element (CPE, defined by the admittance YCPE =
CPE(i)α with 0 < α < 1). None of the two elements’ potential dependence could be interpreted in terms of Kornyshev’s theory.
Though the in-situ STM images taken for this system were of much lower resolution than the ones obtained in aqueous electrolytes, they showed a definite dependence on electrode potential (this dependence was over-interpreted by us as if it were connected to the pztc) and revealed etch-pits plus terraces on the surface. We have not recognized the great importance of this last finding for a long time: the etch-pits are marks of the reactivity of the Au surface with the imidazolium compound of the IL.
As a big step ahead, reproducibility of the CVs and of the impedance spectra could be soon substantially improved: First, a drying-and-cleaning method of the IL was elaborated [32] using a molecular sieve. This procedure resulted in water contents <20 ppm (w/w). Further, the cell and some parts of the apparatus had been moved into a glove-box of high purity atmosphere. Second, we moved from Au(111) to the Au(100) single crystal face. This latter change was inspired by the molecularly resolved STM images of Au(100) in an IL [44], which were not achieved with Au(111) at that time.
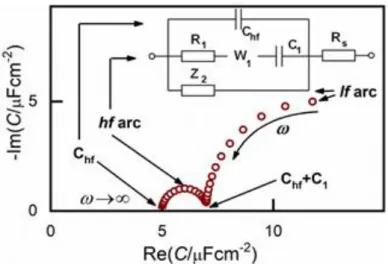
Following these modifications, we obtained a much broader potential window and impedance spectra of much higher quality and temporal stability [33]. From this point onward, the three branched equivalent circuit shown in Fig. 2 was found to be a good model for interpreting the impedance behavior of the Au(100) | BMIPF6 system and also for a number of other metal | IL interfaces.
Fig. 2. Equivalent circuit used for fitting the impedance spectra and features of the capacitance spectra as a complex plane plot. Rs is attributed solely to the electrolyte, the other elements to the interface. The W1 element is an empirical “pseudo-Warburg” element, defined by its admittance YW=W√(i). In some cases this W element was replaced by a constant phase element (CPE). The Z2
impedance is a serial R–CPE–C circuit, or a subset of it (CPE, R–W–C etc. or simply nil).
Accordingly, the capacitance spectra, as shown on the complex plane plot of Fig. 2, comprise two arcs. As we will show below, the two arcs represent processes of different nature. The high frequency arc (hf arc, with f > 10 Hz) in fact, characterizes double layer charging and will, hence, be denoted as Cdl(). The low frequency (lf) arc is related to some other process and has little to do with the double layer charging, as will be discussed later. Therefore, to interpret impedance spectra, first, in the next part of the results we describe all effects related to, and implications of, the lf capacitance arc. Afterwards, we will analyze Cdl() and will finally show STM images to illustrate what kind of ordered structures appear at the different potential regimes.
The results of the pztc measurements [37] (Epztc ≈ +0.4 V for Au(100) | BMIPF6) are also helpful for the interpretation of the spectra and the in-situ STM images. Accordingly, at the potential of the experiments of Figs. 3a and 4a, with this system, the Au(100) surface was covered by cations rather than anions. Unfortunately, unless otherwise noted, despite many attempts we did not succeed in achieving precise Epztc values for the other systems.
The low frequency arc of the capacitance spectra
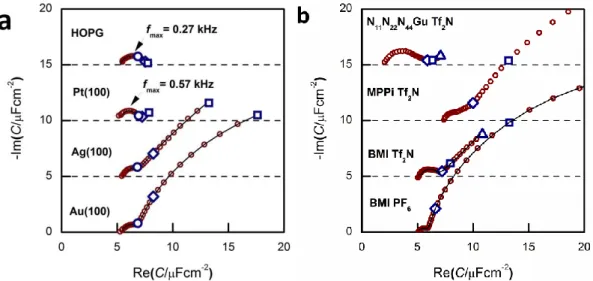
The appearance of the low frequency arc (i.e. the points on the rightmost segment of the spectra) is best seen on the spectra of Figs. 3a and b. These arcs appear for Au(100) and Ag(100), whereas they are absent for Pt(100) and HOPG. With Au(100), we get the lf arcs with ionic liquids of N-heterocycles (imidazolium and piperidinium cations), whereas a much smaller lf arc was observed with a guanidinium-based IL (for the structure of these ions, see Fig. 1).
Fig. 3. a) Capacitance spectra for Au(100), Ag(100), Pt(100) and HOPG in BMIPF6. The spectrum of HOPG is the same as of Fig. 3c of Ref. 38. b) Capacitance spectra of Au(100) in BMIPF6 (same spectrum as of Fig. 3 of Ref. 34); in BMITf2N: same spectrum as on Fig. 5 of Ref. 36); in N11N22N44GuTf2N (same spectrum as on Fig. 2 of Ref. 35) and in PMPiTf2N. All spectra have been measured at, or the close vicinity of, –0.1 V; marked frequencies are at 10 Hz, 1 Hz and 0.1 Hz. The spectra are shifted along the ordinate for visibility reasons.
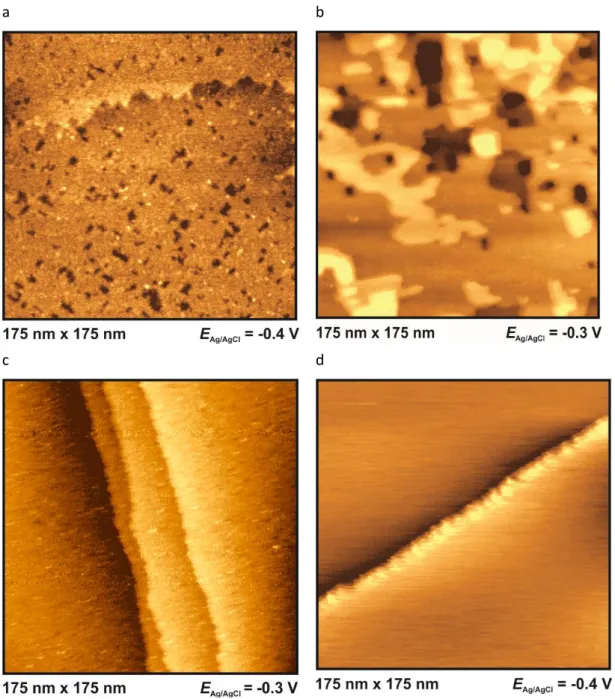
The in-situ STM images of Fig. 4 provide a clue for the origin of the lf arcs. Whereas the HOPG and Pt(100) surfaces do not alter during the STM experiments, on the originally (almost) perfect Au(100) and Ag(100) surfaces etch-pits and monoatomic islands are formed, and the terrace edges become corrugated (see also the time-series of images, Fig. 9 of Ref. 38, and also the presence of pits and terraces on Au(111), Fig. 5. of Ref. 31). (The appearance of such surface defects has been attributed
to cation-induced etching processes, also described in Refs. 44 and 45.) The difference between the groups of Au and Ag and that of Pt and HOPG is in accordance with the expectations based on the experience obtained from aqueous electrochemistry experiments, the surface atoms of Au and Ag are known to be mobile, whereas for Pt surface atoms are much less mobile [46].
a b
c d
Fig. 4. In-situ STM images in BMIPF6 at –0.3 V or –0.4 V for Au(100) (a), Ag(100) (b), Pt(100) (c) and HOPG (d). The images were taken about 30 minutes after assembling the cell.
This is why we might interpret the appearance of the lf arc as a consequence of strong interactions (formation of chemical bonds) between the Au (and Ag) and the N atoms of the heterocycles with a subsequent event – dissolution of the metal (“corrosion of the surface”) or simply the displacement of surface metal atoms, as seen in the STM images. This process contributes to the long tails in the current transients [37] and to the lf arcs of the capacitance spectra. This effect appears also with Ag(100) but not with HOPG and Pt(100) whose surface atoms are much less mobile than those of gold and silver.
The high frequency arc of the capacitance spectra
The hf arc, Cdl(), could be identified in the spectra of all studied systems. There are three characteristic parameters of the arcs: (a) the high frequency limit value (= Chf in terms of the equivalent circuit of Fig. 2); (b) the span of the arc (= C1) and (c) the characteristic frequency of the arc, ω1 (irrespectively of the actual R–W (or CPE) composition of the middle branch of the equivalent circuit of Fig. 2, this is the frequency of the topmost point along the arc). ω1 will be also named as relaxation frequency of the double layer.
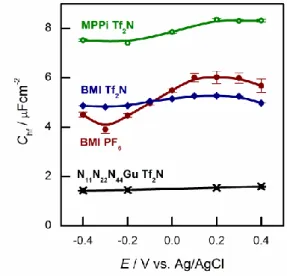
(a) First, Chf appears to be independent of the metal, as it is seen in Fig. 3a. Second, as it can be seen in Fig. 5, the potential dependence of Chf as measured on Au(100) in four ionic liquids is minor. Third, Chf depends on the cation rather than the anion (cf. the pair of BMIPF6 and BMITf2N exhibit very similar Chf values, whereas three ionic liquids comprised by Tf2N–-anions show markedly different Chf
values, in the range of 2–8 µF/cm2). If the double layer is modeled by a simple parallel-plate condenser; the distance of the plates is affected by the cation size, then it appears reasonable that Chf for the large guanidinium cation is much smaller than for the other – smaller – cations.
Fig. 5. High frequency capacitances of Au(100) in various ionic liquids in the potential range indicated.
(b) Second, for C1, the span of the lf arcs is in the range of 1–3 µF/cm2, we found neither trends of the values nor can we offer any explanation for the order of magnitude of these values.
(c) Third, the order of magnitude of the characteristic frequency of the hf arcs, ω1, is in the range between 100 Hz and 1 kHz. This frequency increases with higher temperatures. Whereas Chf and C1
do not depend on temperature, the temperature dependence of ω1 (the "Arrhenius plot" and the associated activation energy) is rather similar to that of the bulk conductivity of the ionic liquid (Ref.
38, Fig. 6b). This is why we suspect that the rearrangements of the double layer and the ionic movements require similar activation processes.
Interfacial structures as shown by in-situ STM images
Outside the so-called “potential window”, the ionic liquid | metal system becomes unstable due to either a reduction (or oxidation, respectively) of an ionic liquid component or the dissolution of the metal surface. At these potentials the ionic liquid’s interfacial structure cannot be imaged properly.
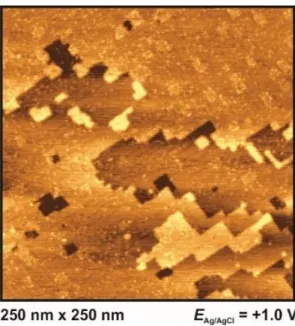
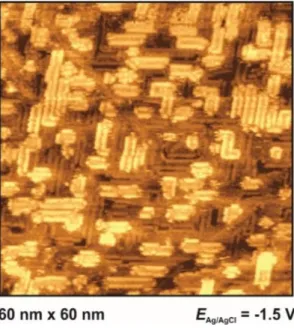
However, the structure of the metal surface can be imaged by in-situ STM: At very positive
potentials, dissolution of Ag(100) can be observed (Fig. 6), while at very negative potentials the characteristic lines of the reconstructed surfaces of Au(111) and Au(100) become visible (see Fig. 7).
Both surfaces have reconstruction features comparable to Au(111) and Au(100) in aqueous electrolytes [47,48].
Fig. 6. Metal surface at extreme positive potential: Dissolution of Ag(100) at 1 V in BMIPF6.
a b
Fig. 7. Metal surface at extreme negative potentials: Reconstructed Au(111) in PMPiTf2N (a) and Au(100) BMITf2N (b) surfaces, at potentials indicated. For other images of the reconstruction lines see Fig. 8d of Ref. 34, Figs. 4c and 5b of Ref. 35, as well as Figs. 10c and 10d of Ref. 36.
Inside the potential window, in some cases we could identify an ordering of anions or cations.
Fig. 8. In-situ STM images of the Au(100) in BMITf2N at potentials positive of the pztc.
For Au(100) in BMITf2N we observe a structuring of the anions somewhat positive of the pztc (which is around –0.2 V for this system [36]). As it can be seen in Fig. 8, islands appear, consisting of stripes with a thickness of approx. 2 nm and a distance of (2.5 ± 0.1) nm to each other [36]. Note that these distances are much larger than the lateral distance between surface atoms on Au(100). The stripes are oriented in preferred directions, indicating that the Au(100) surface acts as a kind of template.
a b
Fig. 9. In-situ STM images in BMIPF6 at –1.3 V for (a): Au(100) (b): Ag(100).
At –1.3 V, a potential being certainly negative of the pztc for all electrodes, on both Au and Ag surfaces we observe structuring of the cations (see Fig. 9); whereas no such ordering could be observed on Pt(100) and HOPG. The image indicates a patchwork-like structure for Ag(100), however, for Au(100) “parallelogram-shaped” patterns appear (similar patterns, characterized as
“micelle-like” have been described in Refs. 44 and 49). Higher magnification reveals that these
“parallelograms” are constituted by adjacent cations (inset of Fig. 9a). This ordering is much more pronounced in the case of Au(100) in PMPiTf2N (Fig. 10).
Fig. 10. Interfacial structure of PMPiTf2N on Au(100).
Just as in the case of anion ordering in Fig. 8, the directions of the parallel stripes are identical everywhere on the image, implying that even in this case the Au(100) surface serves as structural template for this ionic adlayer framework.
Finally, as already been discussed above, we observed the formation of etch pits and islands in a broad potential range on Au(111) (Ref.31, Fig. 5), on Au(100) (Fig. 4a), and on Ag(100) (Fig. 4b) in BMIPF6. Since both anodic and cathodic reaction steps are involved, we cannot conclude whether or not this process is hindered with increasing negative potentials.
Discussion
Interfacial capacitance
The double layer capacitance measurements in ILs started about fifteen years ago and peaked around 2010, mostly on polycrystalline electrodes of gold [40,41,50,51], Pt [52], carbon or glassy carbon [39,42,53,54]. The choice of using gold for double layer studies can be traced back to the classical aqueous electrochemistry: gold is regarded to be an inert metal and it is easy to accomplish oxide (and adsorbate) free conditions (note that an important outcome of the present study is that in imidazolium-salts gold is not completely inert).
The basic conditions for getting precise double layer capacitances are as follows: (a) the impedance spectra should be measured in a broad frequency range; (b) the current density distribution should be uniform along the surface on macroscale and atomic scale as well – this implies the use of a single crystalline working electrode in cells of parallel electrodes; (c) absence of Faradaic reactions – this is associated with the cleanliness both of the electrolyte and the metal surface; (d) the impedance spectra should be analyzed in terms of models (equivalent circuits) containing capacitive elements for the double layer rather than CPEs.
The number of published measurements that comply with (at least the majority of) these criteria are rather limited:
(i) Roling and coworkers published EIS and in-situ STM measurements on Au(111) electrodes in various (imidazolium- and pyrrolidium-based) ILs [55-59].55,56,57,58,59Their methods, materials, results and conclusions are rather similar to those described above, even if due to differences of representation it is somewhat difficult to compare their capacitance spectra to ours. They could model the frequency dependence of the capacitance spectra by a Cole-Cole function comprising three parameters of capacitances – which modelling is somewhat similar to ours, cf. Fig.2a, inset); none of
the dependences of the capacitances on potential and temperature are in a strong conflict to our results.
(ii) Lust and co-workers measured Bi(111) electrodes in various ionic liquids [60-65].60,61,62,63,64,65They concluded that the high and low frequency interfacial capacitances are different – that is, using the terms associated with the model of Fig 2 inset, there is a non-zero C1 capacitance.
The main outcome of these impedance studies — just as of our measurements — is that the double layer capacitance, Cdl, is not a single frequency independent value (as it usually appears in electrochemistry textbooks), but a Cdl(ω) frequency-dependent function, involving (at least) three parameters. The high and low frequency limiting values of Cdl(ω) (Chf and Clf≡Chf + C1 in this model) refer to the “frozen” and “relaxed” states, respectively; the angular frequency of the topmost point along the capacitance arc is a relaxation frequency, its reciprocal is a relaxation time. Note that the non-zero relaxation time means that any rearrangement of the double layer requires some time.
Such a double layer cannot be interpreted in terms of electrostatics – as the name of electrostatics implies, in that discipline there is no time involved as a variable.
Frequency-dependent double layer capacitances often appear as results in various interfacial studies.
In most cases these frequency dependencies can be attributed to some sort of geometric and/or energetic inhomogeneities of the interface. However, even with a completely homogeneous surface, certain slow surface processes are inseparably coupled to the double layer charging, causing a frequency dependence of the interfacial capacitance [66]. In these cases Cdl(ω) cannot be split to parts, it must be handled as a single element, even if three parameters of the function can be given individually.
The potential dependence of the parameters of the Cdl(ω) functions seems to be a controversial issue. The contemporary mean-field theories for calculating the equilibrium Cdl(E) function of undiluted ionic liquids [43], predict “bell-shape” dependence; however, both Chf(E) and Clf(E) are featureless functions, it is difficult to fit them to a bell-shaped curve.
The temperature dependence of the double layer capacitance parameters is also worth to be analyzed. Cdl, as measured at a single frequency or obtained from impedance spectra, has been reported to increase with increasing temperature [34,42,54,58], or were found to be practically temperature-independent [38]. In each case the increase of capacitances is less than 50% at 50 oC. In contrast, the temperature dependence of the relaxation frequency (the frequency of the topmost point of the hf capacitance arc) is much more pronounced: This quantity changes approximately one order of magnitude over the same temperature range. In short: whereas the capacitances are more- or-less temperature independent, the relaxation frequency increases with temperature, in a similar trend as the bulk conductance. We could show this similarity by plotting the relaxation frequency and bulk conductance together [34,38]; the Roling group has demonstrated in a dedicated experiment [58] that the bulk conductivity and the relaxation time has the same Vogel–Fulcher–
Tamann-type temperature dependence.
We refrain from further interpretation of the Cdl(ω,E,T) function. Still, we suspect that in future IL double layer models, which will reproduce the relaxation of the interfacial layer, the layered structure of the interfacial region will play an important role: namely, as AFM force curves revealed, several ionic-liquid layers exist in front of the electrode [59,67,68]. The connection of the models and systems, just as the physical meaning of the C-, W- and/or CPE-elements, remains an open issue.
In the capacitance spectra of Au(100) in BMIPF6 the easy-to-observe feature is the low frequency arc, which is completely unrelated to the double layer – it is a consequence of the surface rearrangement processes of the Au surface (plus eventual spurious processes of contaminants). If we want to understand the double layer’s behavior, this represents an unnecessary complication. Hence for future studies, we suggest the use of other-than Au electrodes in other-than imidazolium-based ionic liquids. Although one needs to be aware of the fact that these alternative systems have other difficulties as well.
STM images
STM can be an accurate tool for characterizing interfacial structures with molecular/atomic resolution. But, although in-situ STM was exposed to be suitable for interfacial imaging in ionic liquids, it should be noted that the quality of in-situ STM measurements in ILs is obviously lower compared to measurements in aqueous systems. This limitation is mostly due to the relatively strong interactions between ions within the electrolyte and with the STM tip.
Pan and Freyland were one of the first, who used in-situ STM for interfacial visualization of ILs [14].
They observed a potential-dependent phase transition of PF6–
anions from a Moiré-like pattern to a (√3×√3)-structure on Au(111) in BMIPF6. For the same electrochemical system, Lin et al. imaged etching processes, resulting in a random interfacial “worm-like” structure [16]. In 2009, this group also visualized the formation of holes on Au(100) at moderate potentials [44]. These findings are in accordance to our own results and confirm our assumption that vacancy formation is modifying the EIS plots with an additional second (low frequency) arc. These etching processes were also described by Atkin et al. on Au-electrodes [59]. At more negative potentials, ordered “micelle-like” structures on Au(100) were observed by Su et al., which are comparable in form and shape to our in-situ STM findings for BMI+ and MPPi+ (Fig. 9a in Ref. 34 and Fig. 10 in Ref. 36, respectively). It is presumed that the imidazolium ring is compliant to the bright outward spots of the double-rows (“parallelograms”).
The alkyl chains resemble the murkier inner dots. The distance within such a row is (2.1 ± 0.2) nm (Fig. 9a, inset). In comparison, the piperidinium-based adlayer, which resembles the imidazolium- based in its pattern, has an unambiguous lower width of 1.2 nm (Fig. 10). Additionally, Su et al. also studied the influence of the length of alkyl chains on the distance within an adlayer domain [49].
They observed a coherence between chain length of the imidazolium cation and double row distance in the following order: EMI+ < PMI+ < BMI+ < OMI+. It is assumed that the imidazolium-ILs have a flat orientation on the surface at negative potentials, stabilized by van-der-Waals-forces (and π–π- interactions), which was approved by sum frequency generation (SFG) measurements [69].
Another aspect, which we could confirm in our studies, is that in-situ STM images, measured with ionic liquids consisting of Tf2N–, are not of the same high quality as measurements with PF6–
[36]. The reason for the reduced quality is attributed to strongly adsorbing anions [49]. It is reported that Tf2N– can be reduced by strongly negatively polarized electrodes and, as a result, its reduction products adsorb at the interface [70]. But this observation should be dealt with caution, because the decomposition currents could not be measured by using dry ionic liquids in their highest purity [71].
Moreover, it is stated that the interfacial structure depends more on the electrode material and its surface orientation than on co-adsorbed anions of the electrolyte [49]. This finding is also in accordance to our results. For BMIPF6 as well as for BMITf2N we observed ordered structures on Au(100), but not on Ag(100) (Fig. 9b) and Au(111). The reason for that is probably an unsuitable surface alignment of the latter electrodes. On the negative limit of the potential window, the onset of a potential-induced surface reconstruction was imaged, simultaneously with the disappearance of the rectangular shaped BMI+- adlayer domains. This disappearance was observed also by us for BMITf2N [36].
Video-STM measurements by Wen et al. provided deeper insights into fast dynamic surface fluctuations, which were not accessible by conventional in-situ STM measurements. Ordered structures were described for Au(111) in pyrrolidinium- and imidazolium-based ionic liquids [72]. For Au(111) in BMPTf2N, an ordered (√3×√13)-adlayer of BMP+ could be observed, which is separated in several domains. This structure also exhibits a potential-dependent transition to a more densely packed (√3×2)-structure. The occurrence of this square-shaped adlayer on a hexagonally-shaped surface was explained by a possible co-adsorption of anions. This co-adsorption seems to lead to an energetically favored interfacial phase and can be regarded as an experimental confirmation of the so-called overscreening effect, which had been predicted by theoretical interfacial studies of ionic liquids. (The fact, that these structures could not be observed by (conventional) in-situ STM
measurements on Au(111) was explicated by the fast dynamics within these adlayers, making a conventional imaging difficult [72].)
Further studies showed that imidazolium-based ionic liquids (e.g. HMICl, HMITf2N) also undergo a potential-dependent phase transition [73]. Whereas locally restricted domains are only visible at moderate potentials, the formation of stable “striped-like” structures occurs at a more negative polarized surface. Here, the shape of the adlayer is also attributed to the influence of the anion. The co-adsorption of Tf2N- seems to favour a (√3×√13)-structure, whereas chloride attributes to a formation of a denser (√3×3)-structure. At –2.0 V (vs. Pt) a (final) phase transition to its densest pattern (√3×2) takes place with the alkyl groups oriented away from the surface [73].
Another additional approach to investigate this kind of interfaces is using UHV-STM. Uhl et al. used this method with a focus on temperature effects on the interfacial structures [74,75]. In this manner, the substrate–adsorbate interactions of thin BMPTf2N films on Au(111) and Ag(111) were studied in a temperature range between 100 K and 293 K. At room temperature, a highly mobile 2D liquid adsorbate phase was observed on gold and silver. At 100 K, a coexistence of long-range and short- range ordered phases was described on both materials. But otherwise than for Ag(111), the surface reconstruction on Au(111) seems to be crucial for the formation of an ordered surface phase. For graphite, the coexistence of an ordered 2D-crystalline and a 2D-mobile phase was reported for BMPTf2N by Buchner et al [76]. Their DFT calculations revealed that this adsorbate structure consists of alternating rows (…–cation–anion–cation–anion–…).
Temperature-dependent UHV-STM measurements of Au(110) in EMITf2N exhibited also an ordered adlayer at 100 K and its complete desorption at 600 K [77].
Atkin et al [59,67,78] and Zhang et al.[79] detected IL-multilayers on Au(111) using AFM force - distance measurements. For Au(111) | BMIPF6 the existence of inner and outer layers could be detected. Here, the inner layers showed an obviously reduced thickness. Therefore, a much higher force is needed to pierce through these inner layers. This is in line with our findings of a strongly adsorbed (inner) cation layer.
Interfacial investigations were also accomplished by using other physical techniques. High Energy X- Ray Reflection studies approved the occurrence of strong bonded ordered IL adlayers on a sapphire electrode [80]. Finally, Shell-Isolated Nanoparticle-Enhanced Raman Spectroscopy was used to characterize interfacial structures around the pzc of Au(111) in imidazolium-based ionic liquids [81].
Summary and conclusions
In order to understand the properties of the electrochemical solid | IL interface, we have performed electrical measurements — mostly EIS and in-situ STM — on inert metal electrodes in different ionic liquids, mostly in BMIPF6 and BMITf2N.
Our EIS measurements revealed that the interfacial capacitance, at a given potential, is a frequency dependent quantity, rather than a constant; accordingly, the capacitance spectra comprise arcs on the complex plane plot. The frequency dependence can be modelled by an equivalent circuit shown in the inset of Fig. 2. The lowermost branch of the circuit, Z2, represents the very slow surface rearrangement processes, which proceed on Au surfaces but are absent in HOPG and Pt surfaces.
These rearrangement processes can be identified by in-situ STM as the slow formation of etch pits and corrugation of step edges.
From double layer points of view the upper two branches are important: they model the high frequency arcs. The important findings are as follows: (i) We found little if any dependence of Chf and C1 on electrode material and electrode potential. (ii) Chf is smaller in ILs of larger cations (at least, for E negative to the pztc) and (iii) We found weak dependences of Chf and C1 on temperature; however, the relaxation frequency exhibits just as strong dependence on temperature, as the conductivity of the IL does.
The in-situ STM images provided three important information: (i) Gold is not completely inert in imidazolium-based ionic liquids; (ii) In certain potential ranges ordered anions or cation regions could be observed on Au(100); (iii) We failed to clearly identify these ordered regions on the (100) faces of other metals.
These results lead us to draw the following conclusions:
1. The frequency dependence of the double layer capacitance implies that the double layer rearrangement processes following potential changes are not instantaneous, but are much slower than those of the "classical" aqueous double layers. As we found little if any potential dependence of the capacitive quantities, our results do not provide support for the related contemporary theories of equilibrium capacitance.
2. With in-situ STM we found in certain cases ordered anion and cation structures. The Au(100) surface can act as a template to form an organized overlayer.
Acknowledgments
Support of the Deutsche Forschungsgemeinschaft (DFG) through project KO 576/28-1 and of the Hungarian Research Foundation OTKA (112034) is gratefully acknowledged. The part of the research within project No. VEKOP-2.3.2-16-2017-00013 was supported by the European Union and the State of Hungary, co-financed by the European Regional Development Fund.
References
1 M. Freemantle, Introduction to Ionic Liquids, RSC Publishing, Cambridge, UK, 2009.
2 B. Kirchner (Ed.), Ionic Liquids, Topics Curr. Chem., vol. 290, Springer, Heidelberg, Germany, 2010.
3 A. Kokorin (Ed.), Ionic Liquids: Applications and Perspectives, InTech, Rijeka, Croatia, 2011.
4 P. Wasserscheid, T. Welton, Ionic Liquids in Synthesis, Wiley-VCH, Weinheim, 2003.
5 S. Zhang, X. Lu, Q Zhou, X. Li, X. Zhang and S. Li, Ionic Liquids, Physicochemical Properties, Elsevier, 2009
6 M. Galiński, A. Lewandowski and I. Stępniak, Electrochim. Acta, 2006, 51, 5567.
7 F. Endres, D. MacFarlane and A. Abbott, Electrodeposition from Ionic Liquids, Wiley-VCH, Weinheim, 2008.
8 J. S. Wilkes and M. J. Zaworotko, J. Chem. Soc. Chem. Comm., 1992, 13, 965.
9 F. Zaera, Chem. Rev., 2012, 112, 2920.
10 K. Itaya, Prog. Surf. Sci., 1998, 58, 121
11 M. Wilms, P. Broekmann, C. Stuhlmann and K. Wandelt, Surf. Sci., 1998, 416, 121.
12 O. M. Magnussen, Chem. Rev.,. 2002, 102, 679.
13 O. M. Magnussen, B. M. Ocko, J. X. Wang and R. R. Adzic, J.Phys.Chem., 1996, 100, 5500.
14 G. B. Pan and W. Freyland, Chem. Phys. Lett., 2006, 427, 96.
15 L.H. S. Gasparetto, N. Borisenko, O. Höfft, R. Al-Salman, W. Maus-Friedrichs, N. Bocchi, S. Zein El Abedin and F. Endres, Electrochim.Acta, 2009, 55, 218.
16 L.G. Lin, Y. Wang, J.W. Yan, Y.Z. Yuan, J. Xiang and B.W. Mao, Electrochem. Commun., 2003, 5, 995.
17 N. Borisenko, S. Zein Al-Abedin and F. Endres, J. Phys. Chem.B, 2006, 110, 6250 18 A. A. Kornyshev, J. Phys. Chem.B 2007, 111, 5545
19 A. A. Kornyshev, J. Phys. Chem.C 2014, 118, 18285
20 M. V. Fedorov and A. A. Kornyshev, Chem. Rev., 2014, 114, 2978
21 M. Z. Bazant, B. D. Storey and A. A. Kornyshev, Phys. Rev. Lett., 2011, 106, 1
22 K.B. Oldham, J.Electroanal. Chem., 2008, 613, 131.
23 N. Georgi, A. A. Kornyshev and M. V. Fedorov, J. Electroanal. Chem., 2010, 649, 261.
24 M. V. Fedorov, N. Georgi and A. A. Kornyshev, Electrochem. Commun., 2010, 12, 296 25 A. A. Kornyshev, R. Qiao, J. Phys. Chem.C, 2014, 118, 18285
26 K. Kirchner, T. Kirchner, V. Ivaništšev and M. V. Fedorov, Electrochim. Acta, 2013, 110, 762 27 C. Merlet, D. T. Limmer, M. Salanne, R. van Roij, P. A. Madden, D. Chandler and B. Rotenberg, J.
Phys. Chem.C, 2014, 118, 18291
28 V. Ivaništšev, S. O’Connor and M. V. Fedorov, Electrochem. Comm., 2014, 48, 61
29 A. Ruzanov, M. Lembinen, P. Jakovits, S. N. Srirama, I.V. Voroshylova, M. N. D. S. Cordeiro, C.
M. Pereira, J. Rossmeisl and V. B. Ivaništšev, Phys. Chem. Chem. Phys., 2018, 20, 10275 30 B. Rothenberg and M. Salane, J. Phys. Chem. Lett. 2015, 6, 4978
31 M. Gnahm, T. Pajkossy and D.M. Kolb, Electrochim. Acta, 2010, 55, 6212.
32 M. Gnahm and D.M. Kolb, J. Electroanal. Chem., 2011, 651, 250.
33 T. Pajkossy and D.M. Kolb, Electrochem. Comm., 2011, 13, 284.
34 M. Gnahm, C. Müller, R. Répánszki, T. Pajkossy and D.M. Kolb, Phys.Chem. Chem. Phys., 2011, 13, 11627.
35 M. Gnahm, C. Berger, M. Arkhipova , H. Kunkel, T. Pajkossy, G. Maas and D.M. Kolb, Phys.Chem.Chem.Phys., 2012, 14, 10647.
36 C. Müller, S. Vesztergom, T. Pajkossy and T. Jacob, J. Electroanal. Chem., 2015, 737, 218.
37 C. Müller, S. Vesztergom, T. Pajkossy and T. Jacob, Electrochim. Acta, 2016, 188, 512.
38 C. Müller, K. Németh, S. Vesztergom, T. Pajkossy and T. Jacob, Phys.Chem.Chem.Phys., 2016, 18, 916.
39 R.Pauliukaite, A.P.Doherty, K.D. Murnaghan and C.M.A. Brett, J.Electroanal.Chem., 2008, 616, 14.
40 M.T. Alam, Md. M. Islam, T. Okajima and T. Ohsaka, Electrochem.Comm. 2007, 9, 2370.
41 M.T. Alam, Md. M. Islam, T. Okajima and T. Ohsaka, J.Phys.Chem.C., 2009, 113, 6596.
42 V. Lockett, R. Sedev, J. Ralston, M. Horne and T. Rodopoulos, J. Phys. Chem. C., 2008, 112, 7486.
43 M. V. Fedorov and A. A. Kornyshev, Chem. Rev., 2014, 114, 2978
44 Y.-Z. Su, Y.-C. Fu, J.-W. Yan, Z.-B. Chen and B.-W. Mao, Angew.Chem.Int.Ed., 2009, 48, 5148.
45 L.G. Lin, Y. Wang, J.W. Yan, Y.Z. Yuan, J. Xiang and B.W. Mao, Electrochem. Commun., 2003, 5, 995.
46 D. M. Kolb, Prog. Surf. Sci., 1996, 51, 109.
47 A.S. Dakkouri and D.M. Kolb, In: Interfacial electrochemistry: theory, experiment and applications, ed. A. Wieckowski, M. Dekker, New York, 151-173 (1999).
48 D.M. Kolb, Angew. Chem., 2001, 113, 1198.
49 Y.-Z. Su, J.-W. Yan, M.-G. Li, Z.-X. Xie, B.-W. Mao and Z.-Q. Tian, Z.Phys.Chem., 2012, 226, 979.
50 T. R. Gore, T. Bond, W. Zhang, R.W.J. Scott and I.J. Burgess, Electrochem. Comm., 2010, 12, 1340.
51 A.J. Lucio, S.K. Shaw, J. Zhang and Alan M. Bond, J. Phys. Chem.C, 2017, 121, 12136 52 M. Drueschler, B. Huber, S. Passerini and B. Roling, J. Phys. Chem.C, 2011, 114, 3614.
53 V. Lockett, M. Horne, R. Sedev, T. Rodopoulos and J. Ralston, Phys.Chem.Chem.Phys. 2010, 12, 12499.
54 F. Silva, C. Gomes, M. Figueiredo, R. Costa, A. Martins and C. M. Pereira, J. Electroanal. Chem.
2008, 622, 153.
55 L. Wallauer, M. Drüschler, B. Huber and B. Roling, Z. Naturforsch., 2013, 68b, 1143.
56 M. Drüschler, B. Huber and B. Roling, J. Phys. Chem.C, 2011, 115, 6802.
57 B. Roling, M. Drüschler and B. Huber, Faraday Discuss., 2012, 154, 303.
58 M. Drüschler, N. Borisenko, J. Wallauer, C. Winter, B. Huber, F. Endres and B. Roling, Phys.
Chem. Chem. Phys., 2012, 14, 5090.
59 R.Atkin, N. Borisenko, M. Drüschler, F. Endres, R. Hayes, B. Huber and B. Roling, J. Mol. Liquids,
2014, 192, 44.
60 L.Siinor, K.Lust and E.Lust, ECS Transactions, 2009, 16, 559 61 L. Siinor, K. Lust and E. Lust, J. Electrochem.Soc., 2010, 157, F83 62 L.Siinor, K.Lust and E.Lust, Electrochem. Comm., 2010, 12, 1058
63 L. Siinor, C. Siimenson, V. Ivaništšev, K. Lust and E. Lust, J. Electroanal. Chem., 2012, 668, 30.
64 E. Anderson, V. Grozovski, L. Siinor, C. Siimenson, V. Ivaništšev, K. Lust, S. Kallip and E. Lust, J.
Electroanal. Chem., 2013, 709, 46.
65 E. Anderson, V. Grozovski, L. Siinor, C. Siimenson and E. Lust, J. Electroanal. Chem., 2015, 758, 201.
66 T. Pajkossy and R. Jurczakowski, Current Opinion in Electrochemistry, 2017, 1, 53.
67 R. Atkin, S. Zein El Abedin, R. Hayes, L.H.S. Gasparotto, N. Borisenko and F. Endres, J. Phys.
Chem. C, 2009, 113, 13266.
68 F. Endres, O. Höfft, N. Borisenko, L.H. Gasparotto, A. Prowald, R. Al-Salman, T. Carstens, R.
Atkin, A. Bund and S. Zein El Abedin, Phys. Chem. Chem. Phys., 2009, 12, 1724.
69 S. Baldelli, Acc. Chem. Res., 2008, 41, 421.
70 F. Endres, S. Zein El Abedin, N. Borissenko, , Z. Phys. Chem. 2006, 220, 1377
71 S. Randström, M. Montanino, G. B. Appetecchi, C. Lagergren, A. Moreno and S. Passerini, Electrochim. Acta, 2008, 53, 6397.
72 R. Wen, B. Rahn and O. M. Magnussen, Angew. Chemie - Int. Ed., 2015, 2, 6062.
73 R. Wen, B. Rahn and O. M. Magnussen, J. Phys. Chem. C, 2016, 120, 15765.
74 B. Uhl, F. Buchner, D. Alwast, N. Wagner and R. Jürgen Behm, Beilstein J. Nanotechnol., 2013, 4, 903.
75 B. Uhl, T. Cremer, M. Roos, F. Maier, H.P. Steinrück and R. J. Behm, Phys. Chem. Chem. Phys., 2013, 15, 17295.
76 F. Buchner, K. Forster-Tonigold, M. Bozorgchenani, A. Gross and R. J. Behm, J. Phys. Chem.
Lett., 2016, 7, 226.
77 R. Foulston, S. Gangopadhyay, C. Chiutu, P. Moriarty and R. G. Jones, Phys. Chem. Chem. Phys., 2012, 14, 6054.
78 R. Atkin and G. G. Warr, J. Phys. Chem. C, 2007, 111, 5162.
79 X. Zhang, Y.-X. Zhong, J.-W. Yan, Y.-Z. Su, M. Zhang and B.-W. Mao, Chem.Commun., 2012, 48, 582.
80 M. Mezger, H. Schröder, H. Reichert, S. Schramm, J. S. Okasinski, S. Schöder, V. Honkimäki, M.
Deutsch, B. M. Ocko, J. Ralston, M. Rohwerder, M. Stratmann, H. Dosch, Science, 2008, 332, 424.
81 M. Zhang, L.-J. Yu, Y.-F. Huang, J.-W. Yan, G.-K. Liu, D.-Y. Wu, Z.-Q. Tian and B.-W. Mao, Chem.
Commun. (Cambridge, U. K.), 2014, 50, 14740.