Land Use Policy 114 (2022) 105968
Available online 5 January 2022
0264-8377/© 2021 The Authors. Published by Elsevier Ltd. This is an open access article under the CC BY license (http://creativecommons.org/licenses/by/4.0/).
The socioeconomic impacts of the CAP: Systematic literature review
Jüri Lillemets
a,*, Imre Fert o ˝
b, Ants-Hannes Viira
aaInstitute of Agricultural and Environmental Sciences, Estonian University of Life Sciences, Kreutzwaldi 1, Tartu 51006, Estonia
bInstitute of Economics, Centre for Economic and Regional Studies, Lorand Eotvos Research Network, T´oth K´alm´an u. 4, Budapest 1097, Hungary
A R T I C L E I N F O Keywords:
Common agricultural policy Rural development Policy impact
A B S T R A C T
One of the main aims of the EU’s common agricultural policy (CAP) is to promote the development of rural areas.
Although there is a rich abundance of academic literature on the impacts of the CAP on rural areas, there has yet to be a comprehensive overview on the effects. The paper aims to fill this gap by providing a systematic literature review on the impacts of the CAP on the socioeconomic situation in EU’s rural areas. A two-stage search pro- cedure to identify the relevant literature is employed. Only 59 publications that estimated the socioeconomic impacts of the CAP were found. The main findings are the following: the reviewed studies have found CAP to have no significant impacts on rural development as an abstract concept and the rural population; positive but negligible effects on economic output, the generational change in farming and gender equality; a positive effect on employment; and limited or inconclusive evidence about the impact on economic diversification, regional cohesion and civil participation.
1. Introduction
The EU’s common agricultural policy (CAP) is a political instrument used to regulate the distribution of financial support mainly to agricul- tural producers throughout the EU. Although its share of the EU budget has decreased from 66% in 1980 to 35% in 2020 (DG Agriculture and Rural Development, 2021a), it still comprises a considerable share of EU’s total expenditure. It can thus be expected to have a substantial impact on the economic, environmental as well as social aspects of farming and living in rural areas. From the onset in 1957 the main aims of the CAP were to increase agricultural productivity, ensure a fair standard of living for farmers and assure availability of supplies at fair prices (Stead, 2008). For three decades that followed, the CAP was mostly directed at maintaining high market prices through import tar- iffs, target prices, market intervention and export subsidies. As a result, distortions of international trade led to disputes in the international arena, agricultural production soon exceeded domestic consumption, larger farms received the bulk of the income support and intensive farming encouraged by the high product prices provoked negative environmental externalities. These problems induced an ongoing reform process beginning in 1992 with the MacSharry reform that initiated the gradual phasing out of market support in favour of direct payments (Fig. 1). Since the Agenda 2000 reform, the CAP has been regarded as comprising of two Pillars. Direct payments and market support
constitute the first Pillar while the second Pillar includes modernisation, agri-environmental and rural development measures.
Socioeconomic measures other than farm income support were introduced to the CAP already in the early 1970s. However, the aim of these socio-structural measures at that time was not to promote rural development, but rather to slow down structural changes in agricul- turally disadvantaged regions, modernise agricultural production and increase agricultural productivity as well as to address the potential excess supply of agricultural produce (Kjeldsen-Kragh, 2007). Although all payments to farmers have since the outset been relevant in terms of socioeconomic conditions of farm households, the development of rural areas became an integral part of the CAP only after the MacSharry re- forms in the early 1990s (Garzon, 2006). The socioeconomic measures introduced with the Agenda 2000 reform had much wider scope than the early socio-structural measures. In addition to reinforcement of the agricultural sector, these also included protection of the environment and rural heritage as well as the modernisation and diversification of rural areas.
These three objectives have persisted in the regulation on support for rural development (European Parliament and Council of the European Union, 2013). In particular, “achieving a balanced territorial develop- ment of rural economies and communities including the creation and maintenance of employment” could be considered a reference to the expectation of socioeconomic impacts. Starting from 2021, the goal “to
* Corresponding author.
E-mail addresses: jyri.lillemets@emu.ee (J. Lillemets), ferto.imre@krtk.hu (I. Fert˝o), ants-hannes.viira@emu.ee (A.-H. Viira).
Contents lists available at ScienceDirect
Land Use Policy
journal homepage: www.elsevier.com/locate/landusepol
https://doi.org/10.1016/j.landusepol.2021.105968
Received 11 May 2021; Received in revised form 21 December 2021; Accepted 22 December 2021
strengthen the socio-economic fabric of rural areas” is among the three objectives of the CAP, which also has set specific objectives related to attracting young farmers, sustainable business development in rural areas, employment, growth, gender equality, social inclusion and local development (European Parliament and Council of the European Union, 2021). Socioeconomic impacts can thus be summarised to refer to those outcomes of the CAP that relate to the social and economic situation of rural areas and are not limited only to agriculture.
The CAP can be considered one of the most researched public policies of the EU. Surprisingly, there are few attempts to summarise the evi- dence on the impacts of CAP instruments in the form of literature re- views. Erjavec and Lovec (2017) in their review of research on CAP explore the development of disciplinary divisions in research on the CAP, rather than analyse its outcomes. There is a review of literature on CAP impacts on socioeconomic development but it is very brief (OIR ¨ GmbH et al., 2021). Research on the employment impacts of the CAP has been systematically reviewed (Schuh et al., 2016; Vigani et al., 2019), but it is limited to only one particular outcome of the policy.
There are numerous studies investigating the impacts of the CAP on the economic performance of farms or on various environmental targets.
However, the socioeconomic impacts have been rarely evaluated. Some impact evaluations deliberately disregard the policy goals of the CAP related to socioeconomic issues (OECD, 2017). The reasons behind this negligence are manifold. Some research is likely discouraged by the lack of data. While farm performance can be measured by an ample choice of economic variables collected by Farm Accountancy Data Network (FADN), farm or regional level data on socioeconomic variables are more difficult to come by, except perhaps for employment. Limitations related to lack of data could be relieved by access to increasingly more detailed data on CAP expenditure (Garrone et al., 2019; World Bank Group, 2018). The operationalisation of socioeconomic variables might also pose a difficult task, most often when the variable under investi- gation is rural development, a concept that gives room for a wide range of interpretations. Socioeconomic effects of the rural development pol- icy measures of the CAP could be too small to be possible to demonstrate (Bednaˇríkov´a, 2015). Due to the relatively small amounts of financial resources allocated to these policy instruments, it would be difficult to link any such effects to these measures.
However, impacts on social and in particularly economic variables should not be limited to those measures of CAP that are aimed at rural development. Not only does income support of the CAP encourage well- being of farm households but also other instruments of the various EU Structural and Investment Funds have shown to contribute to the so- cioeconomic development of rural areas (Becker et al., 2010, 2012, 2018; Bourdin, 2018; Cappelen et al., 2003; Crescenzi and Giua, 2020;
Dall’erba, 2005; Dall’erba and Le Gallo, 2008; Mohl and Hagen, 2010).
These instruments are often aimed at less developed regions as are some of the CAP measures. As a result, isolating the effects of CAP or its particular measures from other policies and their instruments may not always be possible.
The purpose of this paper is to review the evidence on the socio- economic impacts of the CAP using the systematic literature review approach. In addition to synthesising the results of research on the so- cioeconomic impacts of the CAP, the evolution of themes, relationships between topics, policy measures and used methodologies is also reviewed.
2. Material and methods
We follow the PRISMA1 guidelines (Liberati et al., 2009) to overview the relevant literature. These guidelines were primarily devised to pro- mote the rigour of literature reviews in intervention research. While research on the impacts of the CAP has not been as systematic or standardised as in intervention research in some other fields, the CAP as a policy is still analogous to any intervention. It can be considered a policy intervention with various participants – subsidies as the inter- vention, comparable units as controls and difference in outcomes as policy impact. Although the PRISMA approach originates from medical research, it is demonstrated to also be appropriate in other research areas.
Some previous literature reviews in agriculture have primarily used the Web of Science, Scopus and AgEcon Search databases as sources (Schuh et al., 2016; Velten et al., 2015; Weltin et al., 2018). Because these databases allow users to export results, these are also used to find publications for the current review. Further sources are derived from following up on citations in the selected studies. The databases include academic journal articles, book chapters, conference proceedings, working papers and reports. Impact analyses of the CAP are also regu- larly conducted for policy evaluation purposes, but such literature is not considered in the review. A natural approach would be to include Rural Development Programme evaluations carried out by member states.
However, despite attempts to improve the methodology used in these evaluations, their results are questionable due to the frequent use of naïve methods (Andersson et al., 2017; Thoyer and Pr´eget, 2019) and the lack of quantification of the effects (Vidueira et al., 2014). Moreover, the evaluations themselves are hard to find, especially in English.
Although thematically relevant in the context of estimating the impacts of the CAP, these evaluations are not included in the review for the above-mentioned reasons.
Fig. 1. CAP expenditure. (DG Agriculture and Rural Development, 2021b).
1 Preferred Reporting Items for Systematic Reviews and Meta-Analyses.
The search term is searched from title, abstract and keywords of publications. Because prior to querying databases and investigating re- sults it is not known what topics have been studied regarding the so- cioeconomic impacts of CAP, it is also not known what kind of specific keywords should be used to capture possible outcome variables.
Therefore, a two-stage literature search is applied. In the 1st stage, all literature where any kind of CAP impact is studied is searched, then relevant topics are manually selected and respective keywords are determined. These keywords are then used in the 2nd stage to find relevant literature that the first stage search might have missed.
Determining the most useful search term consisted of three steps.
First, words used in the titles, abstracts and keywords of several random relevant articles were examined to find the most suitable keywords to be used as a search term. The resulting term was then used to incrementally improve the search term by attempting to exclude irrelevant articles that were returned by queries. In line with some previous research (Fischer et al., 2015), several test searches were performed using different combinations of search terms.
As a result of this process, it was determined that three elements need to be present in search terms in order to retrieve relevant publications:
(1) the policy, formatted as ““Common Agricultural Policy” OR “rural development” AND “European Union” OR EU”; (2) the policy in- struments, formatted as “support OR subsidy OR payment OR measure”; (3) the mechanism of impact formatted as “impact OR effect OR rela- tionship OR role”. Plural or lemmatisation is automatically considered by search engines, thus e.g. the common form “subsidies” is also considered when the search term only contains “subsidy”. The outcome (i.e. socioeconomic variables) was not included in the search term in the 1st stage of queries. The phenomena that are in some way or other relevant for the social and economic situation in rural areas are too numerous to explicitly define. Thus, the outcome is captured in the queries of the 2nd stage of the review.
For the reasons explained above, at the outset it was not possible to determine a complete list of specific topics relevant to the review. After running 1st stage queries and scrutinising the results while considering the previously outlined policy aims of the CAP, the following topics that could be considered as socioeconomic were identified from examination of the literature: regional economic output (GDP, GVA); rural develop- ment and quality of life; regional convergence and cohesion; employ- ment, labour migration and job creation; population and migration;
diversification into non-agricultural activity; civil participation; gener- ational change; gender equality.
Some frequently appearing policy outcomes that could potentially be considered relevant were disregarded due to their indirect relation to the wider socioeconomic situation in rural areas. These topics were mostly related to the economic situation of farms and could be summarised by the following keywords: farm household income; redistribution of CAP funds between beneficiaries or policy instruments; market prices;
viability of family farms, small and subsistence farming; size and type of farms; production efficiency; land use.
Eligibility, relevance and selection criteria are distinguished, each representing a stage in the process of literature selection. The first se- lection of publications to be included in the review is performed in the process of querying data from databases according to eligibility criteria.
These criteria determine which publications are considered for the re- view and are thus referred to as such. In order to capture as much of the relevant literature as possible, lenient constraints are set to the initial selection of literature. The applied eligibility criteria are as follows. The language must be English. Timeframe or subject area is not limited. It was observed that subject area is often not correctly assigned in data- bases and should thus not be used as an eligibility criterion. Publication type in the current review includes academic publications such as journal articles and conference papers but also working papers. Working papers are not excluded because these are often methodologically rigorous and include important findings that are not published else- where. Although there may be some relevant studies (e.g. World Bank
Group, 2018) in grey literature, these are excluded as these are not included in used databases. As a measure of quality, peer-reviewed studies are distinguished from others and this aspect is taken into consideration when summarising the contradictory results of studies.
We introduce relevance criteria to automatically exclude some studies containing words that are likely to be irrelevant regarding the review question. Hence, these words determine irrelevant studies and can therefore be used to efficiently remove them prior to manual se- lection. In case of studies of socioeconomic effects, words related to e.g.
environmental issues are not expected to be present in keywords, but they may occur in abstract. To determine irrelevant words, first all the words are stemmed using an algorithm (Porter, 1980), then the most frequent words and compound words are examined, and finally those that are irrelevant for our review question are used for the exclusion of studies. As such, relevance criteria represent the words that are used to exclude studies.
The decision on whether to include a publication is based on whether it fulfils each of the selection criteria. The following conditions deduced from our review question are imposed. Studies need to evaluate the impact of a CAP policy instrument. The SAPARD programme that can be considered as the pre-accession instrument of the CAP for new member states is also included. The outcome variable(s) examined are relevant to the social or economic situation and must investigate one or more of the topics outlined above. Impact needs to be empirically evaluated. Studies must consider the counterfactual situation where the CAP does not exist.
Studies evaluating the impact of policy reforms are excluded while studies evaluating impact of scenarios are included only if the examined scenarios involve the existence or absence of the CAP. Thus, also ex-ante analyses are included if these consider the counterfactual.
Databases were queried for publications in August and September 2020. For each result returned by queries, basic publication metadata was recorded. For the publications finally selected for review, additional information on the background and attributes of studies was deter- mined, e.g. variables analysed, methodology or data used. This infor- mation is presented in Appendix 1.
During the revision of publications that met the selection criteria, a number of issues relevant to summarising the impact analyses of the CAP were identified. First, measures are sometimes not correctly specified and linked to the specific CAP instruments. Some studies combine several measures under some overarching or ambiguous term, such as growth-oriented measures (Salvioni and Sciulli, 2018) or rural entre- preneurship diversification measure (Ozolin¸ˇs et al., 2015), without explicitly specifying the official name. Another difficulty is that terms such as “impact”, “effect” and “role” are often used even in case of merely descriptive studies (Cunder, 2007; Nikolov et al., 2012), where a counterfactual situation is not evaluated. Conversely, some studies don’t contain these terms in the title, keywords or abstract, yet do include an impact evaluation. Occasionally, the results of the same study are pub- lished as working or conference papers prior to final peer-reviewed publication, and such duplicates need to be thus identified.
Perhaps the most distinctive challenge in summarising the impacts of the CAP is in distinguishing between the effect of the policy itself, the effect of a policy change (reform) or the effect of a possible policy change (scenario). Each of these three types of policy evaluations is common for the CAP. Seven studies that evaluated the impact of a CAP reform were identified (usually decoupling of direct payments in 2005) and 15 studies of the potential CAP scenarios (usually modulation of funds between instruments). These satisfied all criteria except for not evaluating the counterfactual situation relevant for this review. A distinction can be made by examining the counterfactual situation (as explained by Michalek, 2012): in case of a policy impact evaluation, the counterfactual should be complete absence of the policy under investi- gation. This may sometimes even be incorrectly specified by the authors, e.g. the effect of decoupled payments does not demonstrate the effect of the decoupling reform as suggested by Bartolini et al. (2015), rather the effect of these payments. Only studies that fall into the category where
the effect of the policy itself is evaluated were included, whether by explicitly evaluating the counterfactual situation or by using so-called naïve descriptive statistics (DS).
3. Results and discussion
The selection process is outlined on Fig. 2. The 1st stage of the literature search yielded a total of 2760 publications from three data- bases. In order to remove duplicate publications, the DOI and titles were compared. As a result, 2046 publications were identified as unique, although it is likely that many duplicate publications were still present at this step. Only 1277 publications met the relevance criteria, i.e. did not contain any irrelevant words in the keywords, titles or abstracts.
Manual selection from these 1277 publications was performed
according to the selection criteria, and the reasons for exclusion were the absence of evaluating the impact of a CAP instrument (856 publications) or socioeconomic effects (280 publications). In the case of 118 publi- cations, the fulfilment of relevance criteria could not be determined by abstracts alone, and 97 available full texts were further examined.
In the 2nd stage, updated search terms were used, now containing keywords for relevant topics. The selection process and principles were otherwise the same as in the 1st stage, with the additional step of excluding the records evaluated in the 1st stage. The relatively high number of remaining relevant records after that step indicates that many studies were missed in the 1st stage. However, considering that only six of these met the selection criteria, the records introduced in the 2nd stage were mostly irrelevant. Thus, most relevant records were already captured in the 1st stage. A total of 59 studies was found that met all the Fig. 2. Flow diagram describing study selection.
selection criteria after examining the full texts of the retrieved records from both stages.
3.1. Topics, policy instruments and methods
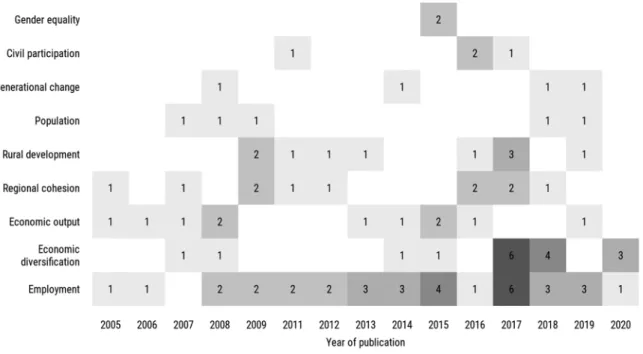
We examined topics by the number of times each topic occurs in publications each year (Fig. 3). These trends can be described according to persistence and relevance, as introduced by Velten et al. (2015).
Persistence can be understood as the share of years that a topic appears in literature from all the years considered, whereas relevance shows the average share of studies on a topic from all the studies of that year. There were only two topics that can be considered highly persistent: employ- ment and economic output. Both are represented in most of the years investigated here. Employment is also a highly relevant topic, as it is represented in most of the years by the highest number of publications.
For studies on the socioeconomic effects of the CAP, it is not observed that some new topics are introduced over time, whereas others diminish as expected. An exception to this is economic diversification, which has received considerably more attention since 2017. In light of the fact that the promotion of the diversification of farm activities was included
among the rural development measures of the CAP in 1999 (Council of the European Union, 1999), this cannot be interpreted as a result of a policy change. Thus, the relevance of topics does not seem to be dependent on policy changes.
It is notable that there were no publications published before 2005 that fulfilled all the review criteria. Moreover, the number of studies included in the review published before 2008 was only 9. This can be explained by the focus of the CAP and the limitations of data. Studies on the socioeconomic impacts of the CAP seem to be associated with rural development support when the temporal range of data is considered (Fig. 4). Introduced with the Agenda 2000 reform, the initial amount and use of this support was planned for seven years. This is evident in the research of the socioeconomic impacts of the CAP where the years assessed in the studies were often between 2000 and 2007 for studies published in 2008–2012. Studies published from 2015 onwards gener- ally use data on the 2007–2013 programming period. A slight lag can be explained by the fact that some funds were used after the end of the programming periods. The increased interest in the evaluation of the CAP impacts during the 2007–2013 programming period could be related to the introduction of a common monitoring and evaluation Fig. 3. Number of studies including topics per year of publication.
Fig. 4. Period of data used of included publications where available.
framework (Council of the European Union, 2005). There have been few studies in which the data used spans more than a decade.
We assigned policy instruments to each reviewed publication ac- cording to how precisely authors outlined it. Many studies examined the entire CAP funding to evaluate the impacts of the policy as a whole (Bonfiglio et al., 2016; Garrone et al., 2019; Hansen and Herrmann, 2012; Loizou et al., 2019; Mattas et al., 2008; Petrick and Zier, 2011;
Rizov et al., 2018; Rogoznicki et al., 2018). Other studies investigated and compared the effects of one (Bournaris et al., 2014; Kouˇrilov´a and Pˇelucha, 2017; Ozolin¸ˇs et al., 2015) or several specific policy in- struments of the CAP. This latter differentiation may be between mea- sures (Dudek and Karwat-Wo´zniak, 2018; Lasanta Martínez and Laguna, 2007; Mantino, 2017; Pelucha et al., 2017), or even Pillars (Mack et al., 2021; Mattas et al., 2008; Olper et al., 2012; Tocco et al., 2013). For more convenient analysis, some authors have categorised all the CAP instruments into a few categories according to their purpose. Psalto- poulos et al. (2006) classified several instruments into farm income support, aids to increased agricultural productivity and aids to economic diversification. Salvioni and Sciulli (2018) isolated and evaluated in- struments that can be described as growth-oriented measures. Some
studies have combined the effects of EAFRD with various EU structural and investment funds, most commonly the European Regional Devel- opment Fund and the Cohesion Fund (Crescenzi and Giua, 2016;
Juvancic et al., 2005; Montresor et al., 2011).
Due to the differences in the design of the two CAP Pillars, the se- lection of specific payments has been more common with Pillar 2 in- vestment measures, as these are directed at numerous activities with a variety of purposes. Moreover, several measures under Pillar 2 have had a more direct association with improving socioeconomic development in rural areas. Measures related to fostering entrepreneurship, tourism and other non-agricultural activities in rural areas (Bednaˇríkov´a, 2015;
Ozolin¸ˇs et al., 2015), protecting cultural heritage (Kouˇrilov´a and Pˇelucha, 2017) or the LEADER measure (Furmankiewicz et al., 2016) are more likely to have an impact on the variables relevant in the current review. However, because direct payments represent a substantial share of CAP and in a general sense have a specific function as an income provision tool for agricultural producers, this instrument has also been used as a variable with a potential socioeconomic impact (Bartolini et al., 2015; Hansen and Herrmann, 2012; Loughrey and Hennessy, 2018; Martinho, 2015).
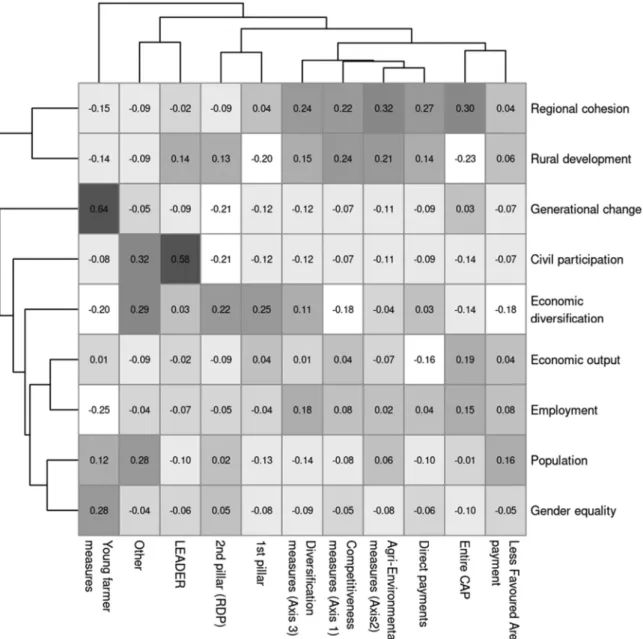
Fig. 5.Pearson’s R between CAP instruments used (bottom) and evaluated policy outcomes (right). The dendrograms were calculated using Hierarchical agglomerative clustering based on Ward’s method.
The relevance of research topics is evident when examining the re- lationships2 between policy instruments and outcomes (Fig. 5). As ex- pected, the evaluation of generational change in agriculture is highly related to measures supporting young farmers, and civil participation tends to be evaluated in the context of the LEADER measure. The impact of the CAP on economic diversification is not limited to diversification measures but is also estimated as an effect of both Pillars. Considering the instruments used, most notably employment and economic output have been evaluated similarly. Also, population and gender equality were similar in this respect. Whereas the CAP impact evaluations on gender equality were related to measures supporting young farmers, change in population has a stronger relation to some more specific measures, e.g. mountain compensatory allowances (Lasanta Martínez and Laguna, 2007). Regional cohesion and rural development tended to
be measured similarly via various axes of RDPs and direct payments with a few exceptions. The negative correlation of rural development with the 1st Pillar and entire CAP indicates that the effect of these in- struments on rural development has seldom been estimated or not at all.
The impact evaluations of the CAP have been diverse in the meth- odological approaches taken. The majority of such studies have imple- mented quantitative methods, although some have also been entirely qualitative or included some qualitative elements such as interviews (Dax et al., 2016; Mattas et al., 2008; Midmore et al., 2008;
Unay-Gailhard and Bojnec, 2019). A notable characteristic of the selected CAP impact assessments is the frequent use of (regional) input-output (I-O) modelling (Bonfiglio et al., 2016; Loizou et al., 2014;
Psaltopoulos et al., 2006). Such models aid in examining different eco- nomic activities within an entire region and quantify the effects of shocks, thereby providing a useful tool for impact evaluation. Despite some suggestions to implement counterfactual methods that involve differences-in-differences (DiD) analysis when evaluating the impacts of the CAP (Evaluation Expert Network, 2014), only eight studies modelled a control group to explicitly evaluate the counterfactual situation. While computable general equilibrium (CGE) and I-O models also allow for Fig. 6.Pearson’s R between units of analysis (bottom) and methods (right). The dendrograms were calculated using Hierarchical agglomerative clustering based on Ward’s method.
2The relationships between instruments, topics, methods and data are esti- mated as Pearson’s correlation coefficients between values of the two variables that were each quantified as dichotomous variables. This is equivalent to Phi coefficient. The dendrograms illustrate similarities of variables in terms of these correlations, so that the distances between similar variables are lower.
considering the counterfactual, these have several disadvantages when applied to CAP (Michalek, 2012, pp. 13–14). The most frequently applied method was descriptive statistics, which can be considered as very limited in the context of impact evaluation.
The socioeconomic impacts of the CAP were most often examined on the level of regions or farms. These units of analysis were related to quantitative methods and were negatively correlated to interviews and other qualitative methods (Fig. 6). Interviews and to some extent descriptive statistics were naturally applied when the unit of analysis was persons, i.e. beneficiaries of CAP support or other stakeholders. As expected, I-O and CGE models tended to similarly analyse resources of economic sectors or regions. The most frequent method, descriptive statistics, was somewhat related to projects and persons, and was usually applied to describe project activities (Dudek and Karwat-Wo´zniak, 2018; Florina, 2020) or survey responses (Kocur-Bera, 2017; Kouˇrilov´a and Pˇelucha, 2017; Marquardt, 2011). Regression analysis and DiD methods were similar, as both were related to data on farms and regions.
Only 13 of the 59 reviewed studies evaluated the impact of the CAP in multiple countries simultaneously (Appendix 1). Most studies exam- ined only a single country, and 16 studies were limited to a few or just one region of a single country. Several studies estimated the socioeco- nomic effects of CAP in all EU countries at the time of evaluation (Bal- lesteros and Hern´andez, 2017; Bonfiglio et al., 2016; Garrone et al., 2019; Jansson et al., 2008; Marquardt, 2011). However, it can be concluded that the evaluations of the CAP studied here tend to be limited in terms of geographical coverage.
3.2. Evidence on policy impact
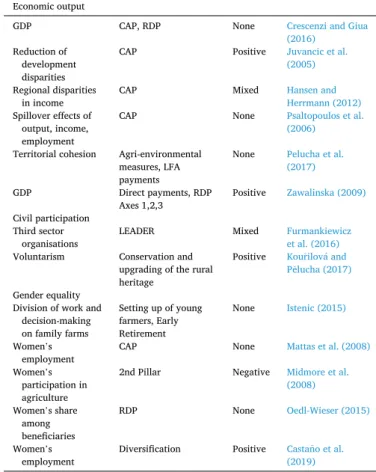
Because evaluations of the impact of the CAP have used different methodologies, theoretical conceptualisations and relationships, narra- tive assessment of evidence is performed to synthesise the results of the studies. Additionally, some text mining techniques were applied to ti- tles, keywords and abstracts to discover topics and relationships be- tween the publications, but this did not yield very meaningful results. It is likely that the vocabulary used in these publications does not distin- guish them from other literature and the topics examined are too distinct for publications to be linked via citations. A summary of the results of reviewed studies is provided in Table 1 and in more detail in Appendix 2.
In the following narrative description these results are presented as precisely as possible, i.e. quantitatively when available.
3.2.1. Economic output
Indicators such as total output, GDP and GVA are often used as proxies to assess the size of an economy or economic development and have thus also been examined in the context of the CAP impacts. Most studies on this topic have applied I-O analysis or extended this to more complex social accounting matrix (SAM) analysis or CGE models. Such methods have provided (often ex-ante) estimates on the proportional change of output or GDP in a given region during a time period that can be attributed to an inflow of the CAP support. As this support is not uniformly distributed among countries or regions, it is important to
consider the spatial context of studies.
In this context, it has been demonstrated that the increase of regional economic output due to various measures was between 0.01% and 1%
for three regions in Greece in 1988–1998 (Psaltopoulos et al., 2006), 0.32% for a region in Greece in 2007–2013 (Loizou et al., 2014) and between 0.09% and 0.39% for a region in Czech Republic in 2007–2013 (Bednaˇríkov´a, 2015). A positive impact of CAP expenditure on output in the Slovenian region was attributed to mostly increased output in the service sector (Juvancic et al., 2005), which suggests increased house- hold consumption as a mediating variable. The economic increase due to a combination of CAP instruments could be expected to be larger, but this is not always the case. While in a region in Greece the increase in output in 2007–2013 was estimated to be 1.54% due to 1st Pillar sub- sidies (Loizou et al., 2014) and 6.01% due to 2nd Pillar subsidies (Mattas et al., 2008), for another region in Greece it was found to be only 0.024%
in 2014–2020 (Lampiris et al., 2018). Variability of output effects has also been demonstrated for the 1988–1998 period where the increase due to farm income support was estimated to have been between 0.01%
and 4.3%, depending on the region (Psaltopoulos et al., 2006).
Similar estimates have been found regarding the impact of CAP subsidies on GDP. Various measures related to the CAP that were implemented in Poland in 2004–2008 and 2007–2013 were estimated to increase GDP by 0.07–0.3%, except for investment subsidies in con- struction in which case the estimated effect was 5.3% (Zawalinska, 2009; Zawalinska et al., 2013). In Italy, 2nd Pillar measures were found to have a positive effect on GDP in 2003–2007 (Salvioni and Sciulli, 2011) and five selected 2nd Pillar measures were estimated to increase GDP by 0.1% in 2007–2013 (Felici et al., 2008). A study estimating the effects of CAP in 15 EU countries in 1989–2000 demonstrated that the increase of GDP that can be attributed to 1st Pillar expenditure was al- ways less than 0.01% (Esposti, 2007). A small effect of both 1st and 2nd Pillars on GDP growth in 1994–2013 was also demonstrated in a study of 12 countries, albeit with some regional differences (Crescenzi and Giua, 2016).
The relationship between CAP subsidies and regional GVA has been estimated for some RDP investment measures for the 2007–2013 period.
The relevant studies have concluded that these measures have increased GVA in Scotland, Ireland, Portugal (Casta˜no et al., 2019) and Latvia (Ozolin¸ˇs et al., 2015).
The evidence presented here suggests that the impact of CAP sub- sidies on the economy or its growth is positive but usually negligible, whether the economy is expressed as total output, GDP or GVA. This result does not appear to be contingent on policy instruments, geographical area or time period. Although most of the studies that have studied this area have applied some form of I-O analysis, similar results have also been demonstrated by the applications of other methods.
3.2.2. Employment
Employment is the most common socioeconomic variable investi- gated in the context of CAP impacts. Considering that some CAP mea- sures have a more (RDP Axis 3) or less (direct payments) direct impact on employment, this is to be expected. While total CAP expenditure was reported to increase employment in a Greek region by 5.2% in the 2007–2013 programming period (Loizou et al., 2019) and have a posi- tive effect in Slovenia (Juvancic et al., 2005), most studies have exam- ined more specific instruments and found smaller effects.
Direct payments were found to increase employment by just 0.1% in Poland in 2004–2008 (Zawalinska, 2009) and have a positive effect in Portugal (Martinho, 2015), while another evaluation of direct payments in Italy found the instrument to have a negative impact on farm employment (Mantino, 2017). This negative effect was suggested to be caused by decreased labour requirements or more risk-averse behaviour as a result of the subsidies. Two studies that evaluated LFA payments found these subsidies to have no (Petrick and Zier, 2011) or negligible (Zawalinska et al., 2013) impact on employment. Other studies have instead focused on unemployment as a dependent variable and reported Table 1
Number of studies by topics and by conclusions about the socioeconomic im- pacts of the CAP.
Topic Negative None Mixed Positive
Economic output 0 1 0 29
Employment 8 6 4 37
Population 0 3 0 1
Generational change 0 1 0 3
Diversification 1 3 1 5
Rural development 0 3 2 2
Regional cohesion 0 5 1 4
Civil participation 0 0 1 1
Gender equality 1 3 0 1
the negative effect of CAP in this respect (Galluzzo, 2018; Michalek, 2012). The fact that the CAP impact on employment may vary depending on context was also demonstrated in a study of Greek regions (Psaltopoulos et al., 2006) that found the positive impact of CAP on employment in 1988–1998 to vary between 0.05% and 8.6%, depending on measure and region.
RDP measures were reported to have had a positive impact on employment in 2007–2013 in Greece (Lampiris et al., 2018) and Italy (Mantino, 2017; Mattas et al., 2008) but no significant effect was found in Italy in 2003–2007 (Salvioni and Sciulli, 2018). The lack of impact of the 2007–2013 RDP on unemployment was also determined in Romania (Galluzzo, 2018). Different types of RDP instruments have been found to impact on employment differently. While investments in technology and modernisation were reported to increase employment in Poland (Zawalinska, 2009), Greece (Bournaris et al., 2014) and Italy (Mantino, 2017), in three German regions such measures were reported to have led to job losses (Petrick and Zier, 2011). This latter result can be explained by the fact that modernisation potentially introduces labour saving technologies. Conversely, agri-environmental measures have been argued to have an opposite effect, as such measures favour labour-intensive technologies (Midmore et al., 2008; Petrick and Zier, 2011). However, this line of reasoning is somewhat in contrast to find- ings for the 2007–2013 RDP in Italy, where investment support was reported to generate higher employment effects than agri-environmental measures (Mantino, 2017). RDP support for non-agricultural activities has been found to increase employment in Greece (Loizou et al., 2014) and Czech Republic (Bednaˇríkov´a, 2015).
In case of 2nd Pillar measures that have been aimed at economic diversification and development of enterprises (Axis 3), beneficiaries were required to create non-agricultural jobs because of the supported projects. A number of studies have reported the number of jobs created in this context as an employment effect (Casta˜no et al., 2019; Dudek and Karwat-Wo´zniak, 2018; Florina, 2020; Klepacka et al., 2013; Ozolin¸ˇs et al., 2015), although the indirect employment impacts of such mea- sures have also been additionally noted (Kouˇrilov´a and Pˇelucha, 2017;
Midmore et al., 2008). While the positive impact of the CAP on employment is direct and obvious in such cases, the absolute number of jobs is a poor representation of the relative importance of the CAP in employment. It has been noted that the beneficiaries of economic diversification measures often created a minimum required number of jobs, resulting in poor efficiency of the respective expenditure (Hapen- ciuc et al., 2014). Also, it is likely that many of the created jobs were short-term, and no evaluations on how many of the created jobs per- sisted after the projects ended were found.
In addition to the overall change in employment, another stream of research has investigated farm labour migration and the outflow of la- bour from agriculture to other sectors. Such studies have usually found that CAP in general tends to maintain the labour force in agriculture according to multiple country studies (Olper et al., 2012; Tocco et al., 2013), although there is an important distinction to be made between the two Pillars. Pillar 1 payments tend to have a higher impact on decreasing labour outflow than those of Pillar 2 (Olper et al., 2012), and the latter have been demonstrated in some cases to increase out-farm migration (Tocco et al., 2013) and non-farm employment more than 1st Pillar expenditure (Rizov et al., 2018). In terms of direct payments, coupled payments have been found in multiple country analyses to provide higher incentives for labour to remain in the sector compared to decoupled payments according to two non peer-reviewed studies (Olper et al., 2012; Tocco et al., 2013), although the opposite has also been observed (Garrone et al., 2019). Another distinction in terms of the la- bour outflow effect of the CAP has been made between old and new member states. Total CAP expenditure has been found to have a positive impact on keeping labour force in agriculture in new rather than old member states (Tocco et al., 2013). This contrasts with the 2nd Pillar, which has been found to reduce the outflow of labour in old member states, but not in new member states (Garrone et al., 2019). In addition
to labour outflow from agriculture, decoupled direct payments have also been found to decrease the probability and intensity of off-farm work in the case of farm operators (Loughrey and Hennessy, 2018).
The impact of the CAP on employment also differs when considering family and hired labour. In Italy, the RDP (Salvioni and Sciulli, 2011) as well as direct payments (Bartolini et al., 2015) have been found only to increase family farm labour, while having insignificant or negligible effect on hired labour. Agri-environmental measures in Slovenia were found to increase hired labour for field crop farms, but the increase for dairy farms was in family labour (Unay-Gailhard and Bojnec, 2019).
There is also reason to believe that the employment impacts of CAP have substantial regional spillover effects (Benga et al., 2017; Bonfiglio et al., 2016), as different instruments either free the labour force from agriculture or, conversely, provide new job opportunities.
While the magnitude of the impact of the CAP on regional employ- ment is dependent on the characteristics of policy instruments (Garrone et al., 2019), measurement of employment and location, it has generally been found to be positive. Similarly, Schuh et al. (2016) in their litera- ture review of employment effects of CAP found that the policy has helped maintain employment in agricultural sector and create rural jobs, although possibly at a very high cost.
3.2.3. Population
There are few studies that have assessed the impact of CAP on the number of people in rural areas. This is likely due to the high ambiguity of this relationship. One way in which CAP helps maintain population in rural areas is by providing income support to small agricultural and other enterprises as has been argued in a non peer-reviewed study of a remote rural area in Spain in 1981–2001 (Lasanta Martínez and Laguna, 2007). Conversely, in a study from Poland and Czech Republic (Stolbova and Niewęgłowska, 2009) and a non peer-reviewed study of Romania (Galluzzo, 2018), no significant relationships were found when exam- ining the interaction between CAP expenditure and population in rural areas on a regional level. Similar results were obtained in a study of RDP expenditures in 2008–2013 in Hungary (Bakucs et al., 2019). In addition to observing an increase of outmigration from the poorest Hungarian regions during that time, propensity score matching combined with the differences-in-differences approach (PSM-DiD) failed to demonstrate an increase in a migration-based Quality of Life index as a result of RDP expenditure. Thus, while CAP income support likely helps subsistence farms to remain viable, most evidence indicates that the CAP has been unable to affect migration in rural areas.
3.2.4. Generational change
Among the multitude of activities of the CAP is supporting young farmers in entering the agricultural sector and transferring land to young trained farmers. In Poland, the notable increase in the share of young farmers and a decrease in the share of old farmers in 2002–2010 has been attributed to the implementation of CAP measures (Rogoznicki et al., 2018). Other studies have assessed the effectiveness of in- struments particularly aimed at young farmers. The 2nd Pillar measure Setting up of young farmers has been reported to increase the transfer of land to young farmers and assist with farm setup costs in Greece (Bournaris et al., 2014). However, a non peer-reviewed evaluation of the same measure in Italy indicated that the measure was ineffective (Car- bone and Subioli, 2008). The subsidies were argued to be too small to attract young people into the agricultural sector, and many of the ben- eficiaries did not actually manage a farm but simply received subsidies due to belonging to a family that owned a farm. A study investigating the attitudes of young farmers in the UK concluded that the Young Farmer Payment of the 1st Pillar had a positive effect on motivation, which in turn had a negative effect on intentions to leave the farm (May et al., 2019). In summary, there is some reason to believe that CAP has helped young farmers to start or continue farming activities, but respective measures might not have always been effective.
Table 2
Overview of studies included in the literature review.
Source Publication
year Peer-
reviewed Instrument Dependent variable Method Countries Data
period Unit of analysis (Bakucs et al., 2019) 2019 Yes RDP Quality of Life index, Rural
Development Index GPSM, DiD HU 2008–2013 Region (LAU-
(Ballesteros and 1)
Hern´andez, 2017) 2017 Yes LEADER, RDP Tourism Document analysis EU27 1991–2013 Document
(Bartolini et al.,
2015) 2015 No DP Farm and external labour GPSM IT 2000–2010 Farm
(Bednaˇríkov´a, 2015) 2015 Yes RDP measures 311, 312 and 313
Production, income and
employment I-O model CZ 2007–2012 Sector
(Benga et al., 2017) 2017 No RDP Employment PSM, DiD LV 2007–2013 Region
(Bonfiglio et al.,
2016) 2016 Yes CAP GDP, employment I-O model EU27 2007–2011 Region
(NUTS-3) (Bournaris et al.,
2014) 2014 Yes RDP measure
112 Transfer of land to young
farmers DS EL 2000–2013 Farm
(Carbone and
Subioli, 2008) 2008 No RDP measure
112 Farmers’ age DS IT 2000–2003 Farm
(Casta˜no et al., 2019) 2019 Yes RDP Rural economy and
employment Literature review ES, IE, PT, RO,
UK, MT 2007–2013 Document (Chmielewska,
2009) 2009 Yes DP, RDP Technical infrastructure,
health care, education DS PL 2004–2006 Region,
beneficiary (Crescenzi and Giua,
2016) 2016 Yes CAP GDP per capita average
growth rate Regression analysis BE, DE, UK, AT, FI, FR, EL, IT, NL, PT, ES, SE
1994–2013 Region
(Dax et al., 2016) 2016 Yes LEADER Policy performance for
rural regions and societies Case studies and
interviews AT, IE 2007–2013 Respondent
(Dudek and Karwat-Wo´zniak, 2018)
2017 Yes RDP measures
311, 312 and 313, LEADER
Jobs created DS PL 2007–2015 Project
(Esposti, 2007) 2007 Yes CAP GDP per unit of labour GMM-DIFF, GMM-
SYS EU15 1989–2000 Region
(NUTS-2) (Felici et al., 2008) 2008 No RDP measures
112, 113, 121, 123 and 311
GVA in agriculture and
food processing, GDP I-O model (REMI-
IRPET) IT 2000–2006 Region
(Florina, 2020) 2020 Yes RDP measures
6.2 and 6.4 Jobs created DS RO 2014–2020 Project
(Furmankiewicz
et al., 2016) 2016 Yes LEADER Number of third sector
organisations DS PL 2004–2013 Region, Local
Action Group (Galluzzo, 2017a) 2017 Yes RDP Agritourism enterprises Regression analysis
(fixed effects model) IT 2000–2011 Farm (Galluzzo, 2017b) 2017 Yes CAP Employment, agritourism Correlation and
regression analysis RO 2007–2013 Region
(Galluzzo, 2018) 2018 No CAP Unemployment,
emigration Regression analysis RO 2007–2015 Region
(Galluzzo, 2020) 2020 Yes CAP Agritourism Correlation analysis RO 2007–2016 Region
(Garrone et al.,
2019) 2019 Yes CAP Agricultural employment Regression on panel
data EU27 2004–2014 Region
(Giaccio et al., 2018) 2018 Yes CAP Tourism DS, statistical
hypothesis testing IT 2007–2013 Farm
(Hansen and
Herrmann, 2012) 2012 Yes CAP Economic cohesion Correlation, linear
regression DE 1991–2009 Region
(NUTS-1) (Hapenciuc et al.,
2014) 2014 Yes SAPARD Jobs created, number of
arrivals and overnight stays in accommodation facilities
Correlation analysis
and other DS RO 2004–2011 Beneficiary
(Istenic, 2015) 2015 Yes RDP measures Division of work and decision-making on family farms in context of gender
Regression analysis SI 2004–2006 Farm
(Juvancic et al.,
2005) 2005 No CAP Output and labour
requirements I-O model SI 2000 Sector
(Klepacka et al.,
2013) 2013 No LFA, RDP Job creation Regression analysis PL 2004–2009 Farm
(Kouˇrilova and ´
Pˇelucha, 2017) 2017 Yes RDP measure
323 Tourism, employment,
economic activities, voluntarism
DS based on survey
responses CZ 2016 Respondent
(Lampiris et al.,
2018) 2018 Yes RDP Output, employment,
income I-O model (GRIT) EL 2010 Sector
(Lasanta Martínez
and Laguna, 2007) 2007 Yes CAP Number of farms,
population, personal income
Correlation analysis ES 1981–2001 Region
(Loizou et al., 2014) 2014 No RDP Axis 4 Output, employment,
income I-O model (GRIT) EL 2010 Sector
(Loizou et al., 2019) 2019 Yes CAP I-O model EL 2010 Sector
(continued on next page)
3.2.5. Economic diversification
The diversification of economic activity in the context of CAP is mostly related to supporting the transition of small farms towards non- agricultural activities. In addition to providing alternative income to farmers, encouraging entrepreneurship has also been deemed to contribute to the economic development of rural areas. Most studies have focused on the provision of tourism services by farms as an outcome of participation in CAP measures. A positive relationship has
been noted between farms with tourism activities and 2nd Pillar pay- ments for rural development in Italy (Galluzzo, 2017a; Giaccio et al., 2018). Whereas CAP expenditure as a whole in Romania has also been found to positively correlate to the adoption of tourism activities by farmers on a regional level (Galluzzo, 2017b), other research using similar methods indicates that 2nd Pillar payments have a very small effect, and the impact may also be negative in the case of 1st Pillar payments (Galluzzo, 2020). This latter result can be explained by the Table 2 (continued)
Source Publication
year Peer-
reviewed Instrument Dependent variable Method Countries Data
period Unit of analysis Total output, employment
and household income (Loughrey and
Hennessy, 2018) 2018 No DP Farm households’ labour
allocation decisions Regression analysis IE 2005–2014 Farm
(Mack et al., 2021) 2020 Yes CAP Number of newly
established enterprises in the secondary and tertiary sector
PSM RO 2009–2014 Region (LAU-
2)
(Mantino, 2017) 2017 Yes RDP Employment Regression analysis IT 2007–2013 Region
(Marquardt, 2011) 2011 No LEADER Implementation of rural
development policies DS based on survey
responses EU27 2010 Rural network
(Martinho, 2015) 2015 Yes RDP Agricultural output,
employment and productivity
Regression analysis PT 2010 Region
(Mattas et al., 2008) 2008 No CAP Employment, output,
income Interviews,
mathematical programming, I-O model
IT, UK, EL, SE 2007–2013 Region
(May et al., 2019) 2019 Yes DP Incentives of young
farmers to stay in the farm Structural equation
model UK NA Farm
(Michalek, 2012) 2012 No SAPARD Rural Development Index,
unemployment GPSM, DiD PL, SK 2002–2005 Region
(NUTS-4) (Midmore et al.,
2008) 2008 No RDP Employment Case studies and
interviews DE, EL, HU, IT,
SE, UK 2000–2006 Respondent (Montresor et al.,
2011) 2011 Yes CAP Economic growth and
convergence in terms of GVA and employment
Regression analysis EU15 1995–2006 Region (NUTS-2)
(Oedl-Wieser, 2015) 2015 Yes RDP Gender equality Document analysis,
interviews, DS AT 1995–2009 Civil servant, document (Olper et al., 2012) 2012 No CAP Farm labour migration Regression on panel
data EU15 1990–2008 Region
(NUTS-1, NUTS-2) (Ozolin¸ˇs et al., 2015) 2015 No RDP measure
311 GVA, number of jobs
created DS LV 2007–2014 Region
(Pechrov´a, 2013) 2013 Yes RDP Rural development Regression
(multinomial logit model)
CZ 2007–2012 Region
(Pelucha et al., 2017) 2017 Yes AEM, LFA, RDP
Axis 3 Geographic, demographic
and economic indicators Correlation and
other DS CZ 2004–2013 Region
(Petrick and Zier,
2011) 2011 Yes CAP Employment DiD DE 1999–2006 Region
(Psaltopoulos et al.,
2006) 2006 Yes CAP Output, income,
employment I-O model EL 1988–1998 Region, firm,
household
(Rizov et al., 2018) 2018 Yes CAP Non-farm employment GMM-SYS UK 2008–2014 Enterprise
(Rogoznicki et al.,
2018) 2018 Yes CAP Generational renewal DS PL 2002–2016 Farm
(Salvioni and Sciulli,
2011) 2011 No RDP Rural GDP, GVA,
employment growth DiD IT 2003–2007 Farm
(Salvioni and Sciulli,
2018) 2018 Yes RDP Employment DiD IT 2003–2007 Farm
(Stolbova and Niewęgłowska, 2009)
2009 Yes LFA Depopulation,
unemployment DS PL, CZ 2004–2006 Farm
(Zawalinska et al.,
2013) 2013 Yes LFA GDP, employment CGE model PL 2005 Region
(NUTS-2), sector
(Zawalinska, 2009) 2009 No CAP Economic growth,
employment CGE model PL 2004–2008 Region
(NUTS-2), sector
(Tocco et al., 2013) 2013 No CAP Out-farm migration of
agricultural workers, farm exit rates
Regression analysis
(probit model) FR, HU, IT, PL 2005–2008 Farm (Unay-Gailhard and
Bojnec, 2019) 2019 Yes AEM Farm labour, green jobs Interviews, DS,
regression analysis SI 2007–2015 Farm