63
ACTA UNIVERSITATIS AGRICULTURAE ET SILVICULTURAE MENDELIANAE BRUNENSIS
Volume 68 7 Number 1, 2020
AUTOMATED ESTIMATION OF LOIN MUSCLE MASS IN LIVING RABBITS
USING COMPUTED TOMOGRAPHY
Zsolt Matics
1, György Kovács
2, Ádám Csóka
3, Virág Ács
1, Rozália Kasza
1, Örs Petneházy
3, István Nagy
1, Rita Garamvölgyi
3, Zsolt Petrási
3, Tamás Donkó
31 Kaposvár University, Faculty of Agricultural and Environmental Sciences, Guba S. str. 40., H-7400 Kaposvár, Hungary
2 Analytical Minds Ltd., Cívis str. 8. 1/9., H-4032 Debrecen, Hungary
3 Medicopus Nonprofit Ltd., Research Department, Guba S. str. 40., H-7400 Kaposvár, Hungary Link to this article: https://doi.org/10.11118/actaun202068010063
Received: 4. 7. 2019, Accepted: 8. 1. 2020
To cite this article: MATICS ZSOLT, KOVÁCS GYÖRGY, CSÓKA ÁDÁM, ÁCS VIRÁG, KASZA ROZÁLIA, PETNEHÁZY ÖRS, NAGY ISTVÁN, GARAMVÖLGYI RITA, PETRÁSI ZSOLT, DONKÓ TAMÁS. 2020. Automated Estimation of Loin Muscle Mass in Living Rabbits Using Computed Tomography. Acta Universitatis Agriculturae et Silviculturae Mendelianae Brunensis, 68(1): 63–72.
Abstract
The objective of this study was to present the updated segmentation technique predicting the loin muscle weight of rabbits based on in vivo computed tomography measurements.
The segmented muscle volumes are used to estimate the weight of the loin muscle and the predicted weights are compared to the real weights of meat cuts measured after the dissection of the animals.
The R2 value of the proposed technique is 0.74 which is significantly better than the determination coefficients than that of the of the previously used method (R2 0.49). The proposed technique is suitable to be involved in the breeding selection program of rabbits (Pannon White) at Kaposvár University, Hungary.
Keywords: computed tomography, automated segmentation, loin muscle, rabbit
INTRODUCTION
Nowadays, the use of computed tomography (CT) instruments tends to appear in the everyday practice of agricultural research. Due to its non-invasive nature, the use of CTs enables the examination of living animals; it is less time-consuming, more accurate and reproducible than dissection. One can estimate the body composition of living animals and efficiently utilize the results in breeding selection programs (e.g. pig (Gjerlaug-Enger et al., 2012), sheep (Navajas et al., 2007), rabbit (Nagy et al., 2006)) and carcass and meat quality predictions (e.g. pig (Font-i- Furnols et al., 2013), beef (Font-i- Furnols et al., 2014), sheep (Lambe et al., 2017)). The tendency is greatly characterized by the large industrial and academic co-operations working on the standardization of
farm animal cross sectional, digital imaging methods (Scholz et al., 2015).
The segmentation of animal CT images is usually carried out by simple thresholding: the threshold 0 HU (Hounsfield Unit – the unit of radio density values in CT images) is used to distinguish fat and meat voxels and the threshold 120 HU is accepted as the threshold between meat and bone voxels (Vester- Christensen et al., 2009; Font-i-Furnols et al., 2009).
The number of voxels belonging to some specific tissue is then regressed to the weights measured during dissection to get a predictive model of tissue weights from CT images.
Glasbey and Robinson (2002) give a thorough overview on the techniques used to predict the weights of tissues from CT scans. Recently, the use of
histograms are used, the predictions are highly biased by the contributions of irrelevant organs and the false densities introduced by the partial volume eff ect (PVE) (Xiberta et al., 2017). Thus, one can expect that the accurate segmentation of CT images preceding the extraction of voxel counts or histograms could improve the accuracy of weight predictions. In order to enable the drawing of statistically relevant conclusions in the studies, the segmentation method should be automated and robust. Although CT image segmentation has been studied for decades in the human medicine, the fully automated segmentation of CT images of animals is diff erent:
• unlike in medicine, where most of the CT segmentation techniques are semi-automated (needing some human input or human validation), in farm animal imaging large number of scans need to be evaluated to draw statistically valid conclusions about populations and full-automation is preferred for cost and processing time reduction;
• unlike in industry, where engineering objects are scanned for quality insurance, in farm animal imaging living animals are scanned with enormous variability, thus, the simple segmentation and rigid registration techniques used for engineering objects cannot be exploited.
Due to the novelty of this paradigm, the relevant literature is limited. Regarding image segmentation techniques, we mention the segmentation method based on spatial Bayesian classifi cation described by Larsen (2000) and successfully applied by Vester- Christensen et al. (2009) for the automated and
animals (Ngo et al., 2016; Gangsei et al., 2016a). The statistical or geometrical modelling of densities in living animals is a complicated and unsolved issue.
These methods can hardly be extended directly to living animals, but these can be used effi ciently when the irrelevant internal organs and soft tissues are already removed from the images. Zhou et al.
(2006) describe a technique for the detection and removal of inner structures in human CT images.
Recently, a rule-based technique using morphological operators and distance maps is described for the automated removal of intestines from the CT scans of living pigs by Xiberta et al. (2017).
In this paper, a novel technique is presented for the automated segmentation of the loin muscle in the CT images of living rabbits. The method is based on some simple morphological operators we have developed for a more general problem: to remove voxels from binary images that are not parts of any strongly connected, slowly and smoothly varying object.
In rabbit breeding programs the main selection criterion is the volume of a specifi c axial part of the loin muscle (Musculus longissimus lumborum and the caudal part of the M. longissimus thoracis).
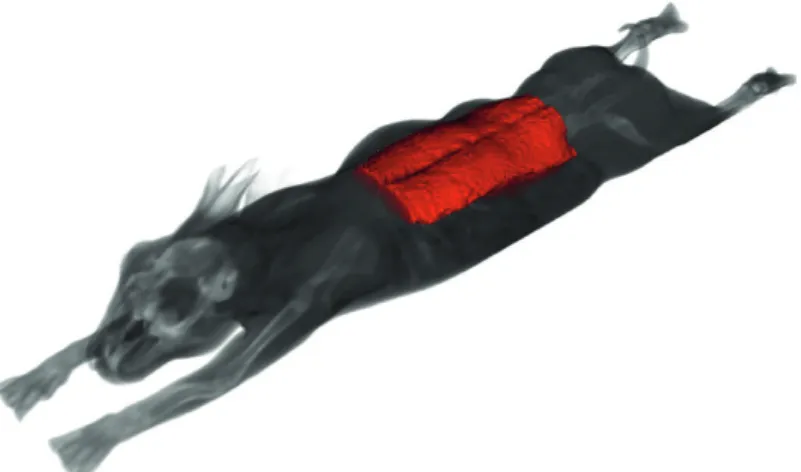
This muscle runs along the body of the animal and the axial region of interest is defi ned by some geometrical constraints related to the skeleton of the animal: the region of interest resides between the fi fth pair of ribs (caudocranial direction), and the slice in which the pelvis bone fi rst appears (craniocaudal direction). The skeleton and the region of interest are visualized in Fig. 1.
1
1: The 3D image of the skeleton of an animal visualized by 3D Slicer program. The region of interest lies between the red planes
Automated Estimation of Loin Muscle Mass in Living Rabbits Using Computed Tomography 65
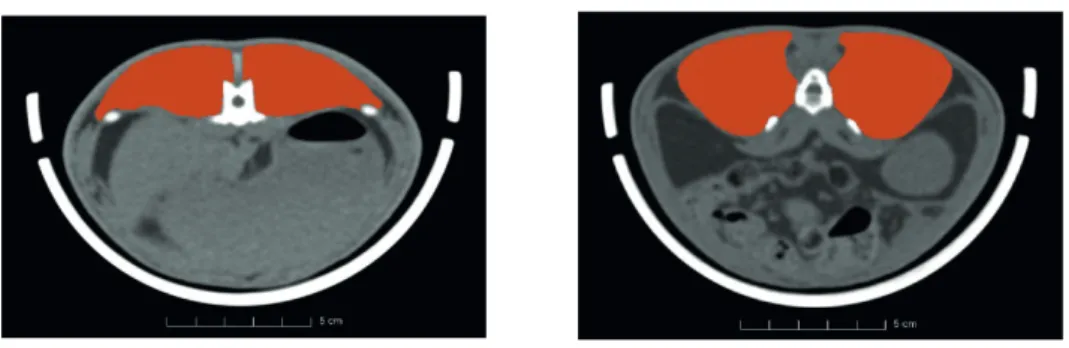
In the region of interest, the loin muscle touches several organs and soft-tissues that have densities from the same range as a muscle (liver, kidneys, guts) (see Fig. 2). The diffi culties of the problem lie in circumstances:
a) the animals are living during the acquisition process, they are breathing, their heart is beating, thus, the boundaries of tissues in the torso are not as sharp as they could be with slaughtered animals;
b) the use of drugs or anaesthesia is prohibited by laws, since the animals having undesired properties are slaughtered and prepared for human consumption;
c) accordingly, although the animals are immobilized to the trough, they can make small movements, slightly rotate and strain their body.
Clearly, the boundaries of the object of interest are not sharp and its geometry also varies. However, as a characteristic property, we can mention its strong connectedness in both the axial direction and within the axial slices. This is the feature we utilize in the proposed segmentation method to remove those regions that are not part of the object of interest.
MATERIALS AND METHODS Acquisition Protocol
170 animals (at the age of 11 weeks) were involved in the study at 2018 January, and used a Siemens Somatom Sensation Cardiac 16 MDCT scanner at the Institute of Diagnostic Imaging and Radiation Oncology of the Kaposvár University, Faculty of Agricultural and Environmental Sciences for acquisition. During the CT measurements scans of overlapping slices covering the rabbits from head to toe were recorded. The used acquisition parameters were: tube voltage 140 kV, X-ray radiation dose 90 mAs, spiral data collection mode with pitch 1, fi eld of view 500 mm, slice thickness 2 mm. During the CT scanning procedures 3 rabbits were immobilized in a special plastic container with belts, anaesthetics were not applied (Fig. 3).
The acquisition process was performed imaging without anaesthetics, because it is expensive, time
consuming and contraindicated in terms of food safety, although the risk of the appearance of the motion artefacts is increasing. In the common practice, the animal was lying in prone position during the acquisition process as one can see in Fig. 3.
The Proposed Segmentation Method Rough Segmentation of the Skeleton to Determine the Axial Region of Interest First, we have to determine the axial region of interest, which is defi ned as the axial region between the fi fth pair of ribs counting from the caudal part and the axial slice where the pelvis bone appears. The skeleton of the animal is extracted by simple thresholding over the level of 150HU.
Then, the backbone is extracted by morphological opening with a suffi ciently long axial structuring element. The largest object remaining is considered to be the backbone of the animal. The backbone is subtracted from the skeleton and the largest object remaining is considered to consist of the pelvis and the bones of the legs, thus, the slice where the pelvis bone fi rst appears can be identifi ed.
The identifi cation of the fi fth pair of ribs is more diffi cult. Firstly, the ribs are extracted from the skeleton, by applying a morphological dilation in the axial direction with a structuring element that is longer than the expected distance between two
2
3 4 5
(b) Loin muscle touching the kidney 6 7
Figure 2 Illustration of the segmentation of the loin muscle in rabbits. Red colour indicates loin 8 muscle areas.
10 9 11
(a) Loin muscle touching the liver (b) Loin muscle touching the kidney
2: Illustration of the segmentation of the loin muscle in rabbits. Red colour indicates loin muscle areas
12
13
Figure 3. Illustration of the acquisition process.
1415 1617
3: Illustration of the acquisition process
count the pairs of ribs, since (a) due to PVE, some thin ribs may be fragmented; (b) some consecutive ribs can be connected by nature; (c) if the animal rotates its body, further consecutive ribs seem to be connected in the CT image; (d) the ribs are curved, and the axial extents of one rib usually intersect with the axial extents of the neighbouring ribs. The robust determination of the axial location of the fifth pair of ribs is carried out in the following way.
Based on the regions A and B, we can estimate the largest radial extents of the ribs r. We assume that at the distance of r/2 voxels from the backbone the individual ribs are not connected to each other. This is a natural assumption, considering that the animal cannot rotate its body so much that the ribs at this distance could be seen connected. Thus, a tube is placed around the backbone with inner and outer radii r/2 - r/5, r/2 + r/5, respectively, and this tube is used for masking the already extracted ribs (that still can be connected) in order to identify some fragments from the individual ribs. However, since the individual ribs can be also fragmented, in some cases more than one fragment is extracted from the same rib by the masking operation. To make these fragments connective, dilation is applied in the axial slices with a structuring element of radius r/3.
Now the one and only one fragment corresponds to each rib, thus, one can easily identify the axial slice where the fifth pair of ribs resides, by simply sorting the fragments by axial coordinates and determining the axial coordinates of the fifth pair. The values r/2, r/3 and r/5 are determined experimentally, slight changes do not affect the results. We note that the fragmentation of thin ribs could be reduced by PVE correction methods; however, we have found that the proposed technique based on some simple geometric considerations fulfils the requirements of determining the desired region of interest with acceptable accuracy.
Segmentation of the Loin Muscle
The segmentation of the loin muscle must be carried out in the axial region specified by the position of the fifth pair of ribs and the first axial slice where the pelvis bone appears. The initial segmentation is carried out by thresholding at 0 HU level. Then, the voxels not belonging to the loin are removed. In order to carry out a robust and accurate segmentation, we have used some simple considerations to develop four operators, each of them formulating a constraint on voxels that
in slice i cannot be part of the object of interest if another voxel close enough in slice i - 1 or i + 1 is not part of the object of interest. We introduce the Bounded Axial Slope Operator (BASO) that simply removes the voxels that do not fit the mentioned criterion. Particularly, the following steps are repeated in the axial region of interest until more voxels cannot be removed. Let (s, r, c) denote the coordinates of the foreground voxel v. Voxel v is removed if there are no foreground voxels in the disk-shaped regions of radius ρ centered around (r, c) in the axial slices s - 1 and i + 1.
We note that this concept is usually utilized in semi-automated solutions: the expert of the field makes an annotation of an organ in one slice and the system offers it as an initial solution for the next slice, assuming that only slight modifications in the boundary are required.
Sagittal and Coronal Connectivity Operator The second operator we introduce is based on the observation that the objects of interest have strong short-range connectivity in the axial slices. Namely, in an axial slice one voxel of the object can be connected to other voxels of the object along straight lines inside the object. We note that this constraint does not mean that the shape of the axial slice of the object is convex. It can be concave, as well, until the concavities enable to connect voxels within the object by straight lines of a given minimum length.
The basic operation of the proposed Sagittal and Coronal Connectivity Operator (SCCO) is checking whether a voxel of the object can be connected to other voxels of the object with straight lines inside the object. In order to increase the robustness of the operator against salt-and-pepper like noise and cases when the object of interest is not perfectly aligned in the axial direction, the connectivity is also checked in the neighbouring slices.
Due to limitations on the length of the paper, we do not introduce the operator formally; only describe its operation in words. The operator denoted by SCCOl1,Θ1,t1,t2 has four parameters. Based on the first two parameters, a set of line segments is assigned to the operator. The line segments are specified by the polar coordinates l (length), θ (polar angle), and ϕ (azimuth angle). The relation of the polar coordinate system to the body of the animal is visualized in Fig. 4(a). The length l = l1 of the line segments is fixed, the polar and azimuth angles of the line segments take all the combinations of the
Automated Estimation of Loin Muscle Mass in Living Rabbits Using Computed Tomography 67
discretized ranges θ ∈ {π/2 - Θ1, …, π/2 + Θ1}, and ϕ ∈ {0, …, 2π}. In practice, both ranges can be discretized at the multiples of 1°. To illustrate the line segments assigned to the operator SCCO15,5,0.9,0.2, they are visualized volumetrically in Fig. 4(b) and Fig. 4(c).
The operator SCCOl1,Θ1,t1,t2 works in the following way. We consider two voxels v1 and v2 connected by a line segment if at least t1l1 foreground voxels can be found along the straight line from v1 to v2. The operator fi ts all line segments to a foreground voxel v and checks, whether it is connected to other foreground voxels regarding the defi nition of connectivity we have introduced. The azimuth angles of the line segments connecting other foreground voxels to v are registered. If there is a contiguous range of the registered azimuth angles that is larger than t22π, voxel v is kept, otherwise v is removed from the set of foreground voxels. The role of threshold t1 is to reduce the eff ects of salt-and- pepper like noise, t1 is usually close to 1. Threshold t2 is used to handle the cases when the voxels of some undesired tissues form a linear structure in the axial slices. This is usually the case with the axial sections of the skin of the animals. In practice t2 is usually larger than zero, but much smaller than 1.
The polar range specifi ed by Θ1 is used to control the number of neighbouring axial slices involved when the connectivity is checked. In practice, the range specifi ed by Θ1 is usually narrow, that is, Θ1 is close to 0.
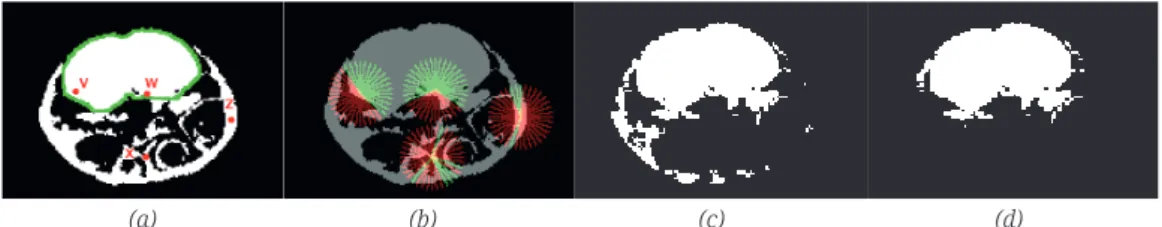
See Fig. 5 for the illustration of the work of the operator. In Fig. 5(a) a slice of the binary object is visualized with some sample voxels. In Fig. 5(b) the line segments specifi ed by the parameters of
the operator SCCO20,0,0.8,0.2 are visualized when the segments are fi tted to the sample voxels. Green and red colour indicates the line segments that connect and do not connect the sample voxels to other voxels, respectively. Although there are some line segments that still connect the sample voxels x and z to other voxels, the largest continuous range covered by the azimuth angles of these line segments is much smaller than 0.22π, thus, the foreground voxel x and z, belonging to the intestines area and the skin are removed, while the voxels v and w belonging to the object of interest are kept. The iterative applications of the operator remove a large part of the undesired structures from the image (see Fig. 5(c) and Fig. 5(d)).
Axial Connectivity Operator
The third operator being introduced is focusing on the most representative property of the objects of interest: the long range axial connectivity. The idea behind the operator is similar to that of the SCCO operator: we suppose that straight lines connecting foreground voxels can be drawn into the object of interest. In the development of the operator we have handled three issues carefully:
a) the object of interest may be not aligned properly in the axial direction;
b) the natural contour of the object is usually not straight;
c) there can be other objects that are slightly connected to the object of interest.
In the description of the operator we use the polar coordinate system introduced in the previous subsection. The Axial Connectivity Operator
(ACOl2,Θ2,t3) has three parameters. The parameter l2
specifi es the maximum length of line segments
19
20 21
(a) (b) (c) 22 23
Figure 4. The polar coordinate system used to parametrize the line segments and the volumetric 24 25
(a) (b) (c)
4: The polar coordinate system used to parametrize the line segments and the volumetric model of the body of a rabbit (a); some random samples from the set of line segments associated to the operator SCCO15,5,0.9,0.2 (b); all line segments associated to the operator SCCO15,5,0.9,0.2 (c)
26
27 (a) (b) (c) (d) 28 29
Figure 5: Illustration of the SCCO operator. One slice of the binary object, green boundary 30 31
(a) (b) (c) (d)
5: Illustration of the SCCO operator. One slice of the binary object, green boundary indicates the object of interest, and labelled red dots denote some sample voxels (a); illustration of the application of the operator
SCCO20,0,0.8,0.2: voxels v and w are kept, x and z are removed (b); the outcome of the application of the operator (c),
next iteration when the operator is applied iteratively (d)
associated to the operator, Θ2 specifies the range of the polar coordinates of the line segments and t3 is a threshold variable. On the contrary to the SCCO operator, this time two sets of line segments are associated with the operator, L and M. The line segments in L have polar coordinates from the range [-Θ2, Θ2], while the line segments in the set M have polar coordinates from the range [π - Θ2, π + Θ2]. The line segments associated with the operator ACO40,15,0.9 are visualized in Fig. 6(a). The line segments in L point from the origin towards the positive axial direction, while the line segments in M point from the origin towards the negative axial direction. The parameter Θ2 is usually a small value enabling small deviations from the axial direction.
The process of the operator is described below.
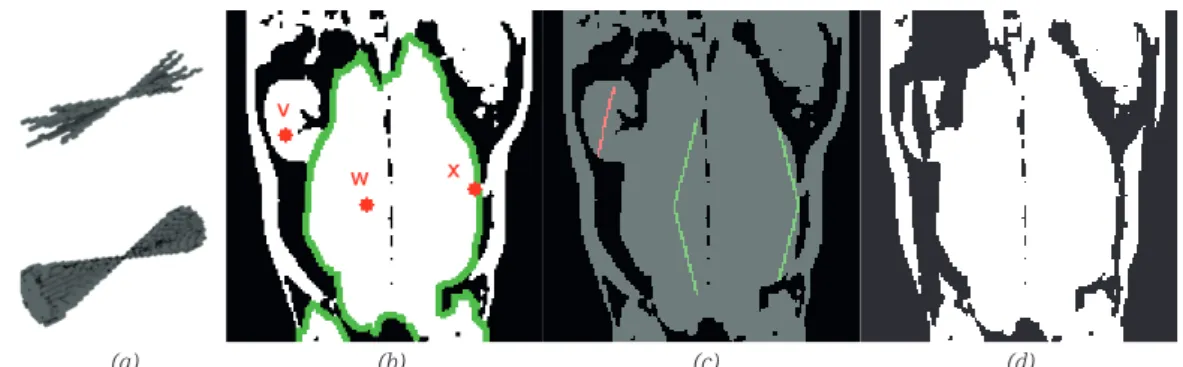
Similarly, to the case of the SCCO operator, two foreground voxels are considered to be connected with a line segment of length l if at least t3l voxels along the segment are foreground voxels. In this sense, the ACO operator examines a foreground voxel v by fitting the line segments of L to v and checking whether v can be connected to other foreground voxels. Let the length of the longest line segment that connects v to another foreground voxel be denoted by lL. The same operation is carried out for the elements of M and the length of the longest line segment that connects v to another foreground voxel lM is determined. Voxel v is kept as a foreground voxel, if lL + lM > l2 holds, otherwise v is removed. In words, the ACO operator checks whether piecewise linear structures of minimum length l2 can be drawn into the object, when the breakpoint of the piecewise linear structure is positioned at v. The operation of the specific operator ACO40,15,0.8 is illustrated in Fig. 6 (b, c, d).
The voxel v residing in the kidney is removed, since the overall length of line segments connecting that voxel to other foreground voxels is smaller than 40.
In the same time, voxel w in the middle of the object of interest and voxel x on the varying boundary of the object of interest are kept.
The Slice-wise Region Removal Operator The rough segmentation of the skeleton can be carried out robustly by thresholding the CT images at the level of 150 HU. Then, the voxels of the skeleton can be used as landmarks in the axial slices of the CT image, since we know that the object of interest is attached to the skeleton of the animal.
Thus, the last operator being introduced is the Slice- wise Region Removel Operator (SRRO), examining each axial slice of the image and removing the connected components that are not connected to the skeleton of the animal. Regarding the SRRO operator, connectivity means the conventional 8-connectivity.
Usage of the Proposed Segmentation Method The operators introduced before implement well defined, but not too strict constraints on the voxels of the desired foreground object. Each of the operators can be considered as a weak classifier of the voxels of binary objects. The starting point of the final segmentation process is a simple thresholding at the level of 0 HU, providing a highly sensitive segmentation of the muscle. Then, the proposed operators are repeated iteratively to remove the foreground voxels that do not satisfy the criteria implemented in the operator. The iteration stops when more foreground voxel cannot be removed.
From the resulting image the skeleton is subtracted and the remaining region is considered to be the segmented loin. Some volumetric images of the initial binary objects (segmented by thresholding) and the results of the proposed iterative method are visualized in Fig. 7.
RESULTS
During the development of the method the used dataset contained the CT images of 170 rabbits and the corresponding muscle weights. The mean weight of the dissected loin muscles was 143.17 ± 15.82 grams. The described segmentation technique was applied prior to extracting the loin
34 (a) (b) (c) (d) 35 36
Figure 6: Illustration of the line segments associated to the Axial Connectivity Operator 37 38
(a) (b) (c) (d)
6: Illustration of the line segments associated to the Axial Connectivity Operator ACO40,15,0.9: some random samples from the sets L and M (top) and all the elements of the sets L and M (below) (a); A coronal slice of the body of the animal, with some sample voxels (b); illustration of the operator (c); the outcome of the operator when it is applied to all voxels of the input image (d)
Automated Estimation of Loin Muscle Mass in Living Rabbits Using Computed Tomography 69
region. The results were tested computing the Pearson correlation coeffi cient between the volume of the loin area and the post-mortem measured loin weight (r = 0.86) and applying linear regression model (Loin muscle weight (g) = 0.6895 × segmented loin muscle volume (cm3) + 14.843). The linear regression model was tested with leave-one-out-cross-validation.
The adjusted coeffi cient of determination was 0.737, while the RMSE of cross validation was 8.18 g using R-project software (Fig. 8).
DISCUSSION
A new segmentation technique was proposed for extracting the loin muscle from the CT images of rabbits.
The segmentation technique was validated using the weights of the loin fi llets: a linear regression model was fi tted to the volumes of the regions and the coeffi cient of determination became R2 = 0.737, which is highly acceptable value in the fi eld, considering that the CT images of living animals were studied using without any anaesthetics and minor movements may have occurred.
The accuracy of the in vivo animal examination mainly depends on the acquisition protocol, immobilisation (presence of motion artefacts, positioning), the examined ROI (region of interest), the spatial resolution of the images and the segmentation method (Font-i-Furnols et al., 2015;
Scholz et al., 2015).
Ideally, the movement artefact is caused only by the beating heart and breathing of the animal. In anaesthesia, we only have to count on those, but it is not possible to perform in our selection work.
Therefore, there are some small movements and changes in posture on the images. These circumstances can make diffi cult the accurate segmentation. An early study – under similar circumstances – reports an estimation of chicken breast weight by CT with the best calculated correlation coeffi cient of 0.76 (Svihus and Katie, 1993).
The higher body weight with signifi cant amounts of muscle mass are benefi cial as well, because higher muscle volume to voxel size (spatial resolution) ratio resulted more precise estimation of primal cuts (R2 > 0.9) in pigs (Lambe et al., 2013;
Font-i-Furnols, 2015). Rabbits are at a disadvantage in terms of body weight.
39 Figure 7. Illustration of the addressed segmentation problem using 3D Slicer program
40 (Fedorov et al., 2012)
41 42
7: Illustration of the addressed segmentation problem using 3D Slicer program (Fedorov et al., 2012)
43 44
8: The correlation of the segmented loin muscle volumes and the weight of loin filletswere obtained semi-automatically or manually. The selection program of Pannon White rabbit started in 1995 by means of CT (Matics et al., 2014) using this idea. Since the first-generation CT scanners were much slower than nowadays, therefore only two cross sectional images were reconstructed at the levels of the 2nd–3rd and 3rd–4th lumbar vertabrae.
The basis of the selection was the so-called L-value calculated from the loin muscle areas of these two scans (Matics et al., 2014). The correlation coefficient between the L-value and the loin muscle weight was 0.7 which means determination coefficient
the hip bone to the level of the knee joint (Romvári et al., 1996; Nagy et al., 2006; Szendrő et al., 2012).
Nowadays, as a consequence of the technical advances, the CT scanners are able to provide even submillimeter slice thickness from the whole rabbit body in a 15–20 seconds scanning time. Respecting this, we targeted again the loin muscle volume to the selection program. CT based estimation of the loin weights in living rabbits have not been reported with the accuracy we have gained with the proposed techniques.
CONCLUSION
An automated post-processing pipeline was developed for in vivo estimation of loin muscle mass in rabbits using CT scans. The described segmentation technique was validated using the weights of the loin fillets. A linear regression model was fitted to the volumes of the segmented regions (R2 0.737). The proposed techniques provide acceptable efficiency to be involved in the breeding selection program of rabbits.
Acknowledgements
This work was supported by the Emberi Erőforrások Minisztériuma (EFOP-3.6.3.- Vekop-16-2017-00005) and the János Bolyai Research Scholarship BO/00871/19 of the Hungarian Academy of Sciences. The publication was supported by the ÚNKP-19-4-KE-24 New National Excellence Program of the Ministry for Innovation and Technology.
REFERENCES
CARABÚS, A., GISPERT, M., BRUN, A., RODRÍGUEZ, P. and FONT-I-FURNOLS, M. 2014. In vivo computed tomography evaluation of the composition of the carcass and main cuts of growing pigs of three commercial crossbreeds. Livestock Science, 170: 181–192.
FEDOROV, A., BEICHEL, R., KALPATHY-CRAMER, J., FINET, J., FILLION-ROBIN, J.-C., PUJOL, S., BAUER, C., JENNINGS, D., FENNESSY, F., SONKA, M., BUATTI, J., AYLWARD, S., MILLER, J. V., PIEPER, S. and KIKINIS, R. 2012. 3D Slicer as an image computing platform for the quantitative imaging network.
Magnetic Resonance Imaging, 30(9): 1323–1341.
FONT-I-FURNOLS, M., BRUN, A., MARTI, S., REALINI, C. E., PÉREZ-JUAN, M., GONZALEZ, J. and DEVANT, M. 2014. Composition and intramuscular fat estimation of Holstein bull and steer rib sections by using one or more computed tomography cross-sectional images. Livestock Science, 170: 210–218.
FONT-I-FURNOLS, M., BRUN, A., TOUS, N. and GISPERT, M. 2013. Use of linear regression and partial least square regression to predict intramuscular fat of pig loin computed tomography images.
Chemometrics and Intelligent Laboratory Systems, 122: 58–64.
FONT-I-FURNOLS, M., CARABÚS, A., POMAR, C. and GISPERT, M. 2015. Estimation of carcass composition and cut composition from computed tomography images of live growing pigs of different genotypes. Animal, 9(1): 166–178.
FONT-I-FURNOLS, M., TERAN, M. F. and GISPERT, M. 2009. Estimation of lean meat content in pig carcasses using X-ray Computed Tomography and PLS regression. Chemometrics and Intelligent Laboratory Systems, 98(1): 31–37.
Automated Estimation of Loin Muscle Mass in Living Rabbits Using Computed Tomography 71
GANGSEI, L. E., KONGSRO, J., OLSEN, E. V., RØE, M., ALVSEIKE, O. and SÆBØ, S. 2016. Prediction precision for lean meat percentage in Norwegian pig carcasses using ‘Hennessy grading probe 7’: Evaluation of methods emphasized at exploiting additional information from computed tomography. Acta Agriculturae Scandinavica A: Animal Sciences, 66: 17–24.
GANGSEI, L. E., KONGSRO, J., OLSTAD, K., GRINDFLEK, E. and SÆBØ, S. 2016. Building an in vivo anatomical atlas to close the phenomic gap in animal breeding. Computers and Electronics in Agriculture, 127: 739–743.
GJERLAUG-ENGER, E., KONGSRO, J., ØDEGÅRD, J., AASS, L. and VANGEN, O. 2012. Genetic parameters between slaughter pig efficiency and growth rate of different body tissues estimated by computed tomography in live boars of Landrace and Duroc. Animal, 6(1): 9–18.
GLASBEY, C. A. and ROBINSON, C. D. 2002. Estimators of tissue proportions from X-ray CT images.
Biometrics, 58(4): 928–936.
HO, H., YU, H. B., GANGSEI, L. E. and KONGSRO, J. 2019. A CT-image based pig atlas model and its potential applications in the meat industry. Meat Science, 148: 1–4.
JONES, H. E., LEWIS, R. M., YOUNG, M. J. and WOLF, B. T. 2002. The use of X-ray computer tomography for measuring the muscularity of live sheep. Animal Science, 75(03): 387–399.
LAMBE, N. R., WOOD, J. D., MCLEAN, K. A., WALLING, G. A., WHITNEY, H., JAGGER, S., FULLARTON, P., BAYNTUN, J. and BÜNGER, L. 2013. Effects of low protein diets on pigs with a lean genotype 2.
Compositional traits measured with computed tomography (CT). Meat Science, 95(1): 129–136.
LAMBE, N. R., MCLEAN, K. A., GORDON, J., EVANS, D., CLELLAND, N. and BUNGER, L. 2017. Prediction of intramuscular fat content using CT scanning of packaged lamb cuts and relationships with meat eating quality. Meat Science, 123: 112–119.
LARSEN, R. 2000. 3-D contextual Bayesian classifiers. IEEE Transactions on Image Processing 10(3):
518–524.
MATICS, Z., NAGY, I., GERENCSER, Z., RADNAI, I., GYOVAI, P., DONKO, T., DALLE ZOTTE, A., CURIK, I.
and SZENDRO, Z. 2014. Pannon Breeding Program in rabbit at Kaposvar University. World Rabbit Science, 22(4): 287–300.
NAGY, I., IBÁÑEZ, N., ROMVÁRI, R., MEKKAWY, W., METZGER, S., HORN, P. and SZENDRO, Z. 2006.
Genetic parameters of growth and in vivo computerized tomography based carcass traits in Pannon White rabbits. Livestock Science, 104(1–2): 46–52.
NAVAJAS, E. A., LAMBE, N. R., MCLEAN, K. A., GLASBEY, C. A., FISHER, A. V., CHARTERIS, A. J. L., BÜNGER, L. and SIMM, G. 2007. Accuracy of in vivo muscularity indices measured by computed tomography and their association with carcass quality in lambs. Meat Science, 75(3): 533–542.
NGO, L., HO, H., HUNTER, P., QUINN, K., THOMSON, A. and PEARSON, G. 2016. Post-mortem prediction of primal and selected retail cut weights of New Zealand lamb from carcass and animal characteristics. Meat Science, 112: 39–45.
R CORE TEAM. 2013. R: A language and environment for statistical computing. Vienna, Austria: R Foundation for Statistical Computing.
ROMVÁRI, R., MILISITS, G., SZENDRÖ, Z. and SORENSEN, P. 1996. Non invasive method to study the body composition of rabbits by X-ray computerised tomography. World Rabbit Science, 4: 219–224.
SCHOLZ, A. M., BÜNGER, L., KONGSRO, J., BAULAIN, U. and MITCHELL, A. D. 2015. Non-invasive methods for the determination of body and carcass composition in livestock: Dual-energy X-ray absorptiometry, computed tomography, magnetic resonance imaging and ultrasound: Invited review. Animal, 9(7): 1250–1264.
SVIHUS, B. and KATIE, J. 1993. Computerized Tomography as a Tool to Predict Composition Traits in Broilers. Comparisons of Results across Samples and Years, Acta Agriculturae Scandinavica, Section A — Animal Science, 43(4): 214–218.
SZENDRO, Z., METZGER, S., NAGY, I., SZABÓ, A., PETRÁSI, Z., DONKÓ, T. and HORN, P. 2012. Effect of divergent selection for the computer tomography measured thigh muscle volume on productive and carcass traits of growing rabbits. Livestock Science, 149(1–2): 167–172.
VESTER-CHRISTENSEN, M., ERBOU, S. G. H., HANSEN, M. F., OLSEN, E. V., CHRISTENSEN, L. B., HVIID, M., ERSBØLL, B. K. and LARSEN, R. 2009. Virtual dissection of pig carcasses. Meat Science, 81(4):
699–704.
XIBERTA, P., BOADA, I., BARDERA, A. and FONT-I-FURNOLS, M. 2017. A semi-automatic and an automatic segmentation algorithm to remove the internal organs from live pig CT images.
Computers and Electronics in Agriculture, 140: 290–302.
ZHOU, X., HAYASHI, T., HARA, T., FUJITA, H., YOKOYAMA, R., KIRYU, T. and HOSHI, H. 2006. Automatic segmentation and recognition of anatomical lung structures from high-resolution chest CT images.
Computerized Medical Imaging and Graphics, 30(5): 299–313.
Contact information Zsolt Matics: matics.zsolt@ke.hu
György Kovács: gyuriofkovacs@gmail.com Ádám Csóka: csoka.adam@sic.medicopus.hu Virág Ács: acs.virag@ke.hu
Rozália Kasza: kasza.rozalia@ke.hu Örs Petneházy: ors.petnehazy@gmail.com István Nagy: nagy.istvan@ke.hu
Rita Garamvölgyi: rita.garamvölgyi@sic.medicopus.hu Zsolt Petrási: dr.petrasi.zsolt@gmail.com
Tamás Donkó: donko.tamas@sic.medicopus.hu