Article
Composition, Structure and Mechanical Properties of Industrially Sputtered Ta–B–C Coatings
Michael Kroker1,* , Pavel Souˇcek1 , Pavol Matej1 , Lukáš Zábranský1 , Zsolt Czigány2 , Katalin Balázsi2and Petr Vašina1
1 Department of Physical Electronics, Faculty of Science, Masaryk University, Kotlarska 2, 61137 Brno, Czech Republic; soucek@physics.muni.cz (P.S.); 460414@mail.muni.cz (P.M.);
zerafel@mail.muni.cz (L.Z.); vasina@physics.muni.cz (P.V.)
2 Institute of Technical Physics and Materials Science, Center for Energy Research, Hungarian Academy of Sciences, Konkoly Thege M. út 29-33, H-1121 Budapest, Hungary; czigany.zsolt@energia.mta.hu (Z.C.);
balazsi.katalin@energia.mta.hu (K.B.)
* Correspondence: kroker@physics.muni.cz; Tel.: +420-549-492-589
Received: 14 July 2020; Accepted: 25 August 2020; Published: 31 August 2020 Abstract:Ta–B–C coatings were non-reactively sputter-deposited in an industrial batch coater from a single segmented rotating cylindrical cathode employing a combinatorial approach. The chemical composition, morphology, microstructure, mechanical properties, and fracture resistance of the coatings were investigated. Their mechanical properties were linked to their microstructure and phase composition. Coatings placed stationary in front of the racetrack of the target and those performing a 1-axis rotation around the substrate carousel are compared. Utilization of the substrate rotation has no significant effect on the chemical composition of the coatings deposited at the same position compared to the cathode. Whereas the morphology of coatings with corresponding chemical composition is similar for stationary as well as rotating samples, the rotating coatings exhibit a distinct multilayered structure with a repetition period in the range of nanometers despite utilizing a non-reactive process and a single sputter source. All the coatings are either amorphous, nanocomposite or nanocrystalline depending on their chemical composition. The presence of TaC, TaB, and/or TaB2phases is identified. The crystallite size is typically less than 5 nm. The highest hardness of the coatings is associated with the presence of larger grains in a nanocomposite structure or formation of polycrystalline coatings. The number, density, and length of cracks observed after high-load indentation is on par with current optimized commercially available protective coatings.
Keywords:magnetron sputtering; industrial process; segmented target; TaBC; phase composition;
structure; mechanical properties
1. Introduction
The ever-increasing demands placed on modern machining for speed, precision, ecology, and cost have led to the continuous evolution of traditional coatings as well as the development of entirely new coating materials for the protection of cutting, milling, and forming tools. Traditional hard protective coatings are often ceramics—cubic phases of TiN, CrN, AlN, and their combinations nowadays constitute the majority of industrially deposited protective coatings [1–3]. Such coatings exhibit high hardness or even superhardness combined with low wear; however, brittleness is their common drawback [4–6]. Once a crack is formed, it spreads easily leading to premature failure of the coating and of the coated tool itself. Although inherent brittleness of a coating can be partially mitigated by their selective alloying or by preparing these materials in a nanocomposite or a nanolayered structure [7–10], the next-generation of coating materials combining high hardness, fracture resistance, and low wear needs to be developed for the most demanding applications of the current and future industry.
Coatings2020,10, 853; doi:10.3390/coatings10090853 www.mdpi.com/journal/coatings
Crystalline Mo2BC was introduced in 2009 as a new type of coating material simultaneously exhibiting high hardness and moderate ductility implying good fracture resistance [11]. Deposition of crystalline Mo2BC was reported at the temperature of 900 °C using direct current magnetron sputtering [11]. Employing High Power Impulse Magnetron Sputtering (HiPIMS) led to a decrease in the synthesis temperature of crystalline Mo2BC as low as 380 °C [12]. Later, an ab-initio modeling of similar materials was performed and it was reported that crystalline Ta2BC and W2BC in particular are also promising candidates for experimental synthesis owing to their calculated elastic properties indicating their simultaneous high stiffness and moderate ductility [13]. Although experimental studies of coating systems like Ti–B–C [14–20], Ta–B–C [21], Nb–B–C [22], and W–B–C [19,23–28] potentially leading to the formation of the X2BC crystalline structure have been published, no formation of the ternary crystalline X2BC phase other than Mo2BC has ever been reported [11,13].
Ta2BC is one of the most promising, as of yet, unsynthesized coatings from the X2BC family.
Its bulk to shear modulus ratio was calculated to be 1.71, similar to that of Mo2BC [13]. Ta2BC also exhibits a positive value for the Cauchy pressure, 28 GPa [13]. Both criteria predict moderate ductility of the material, implying its enhanced fracture resistance. The ternary Ta–B–C system, apart from the crystalline Ta2BC phase, is also interesting for the properties of its binary compounds. Binary Ta–B coatings exhibit high hardness of∼22–40 GPa together with good oxidation resistance at high temperatures [29,30]. Similarly, binary Ta–C systems exhibit high hardness (>20 GPa) and resistance to thermal shock, chemical attack, and oxidation [31–33].
A Ta–B–C coating was reported to have been prepared in a laboratory-scale system with planar magnetrons by simultaneous sputtering of Ta, B4C, and C targets [21]. The hardness of 28 GPa and the effective elastic modulus of 440 GPa were measured. The fracture resistance was qualitatively estimated from TEM images of the residual indentation impressions and the coatings have been found to show a favorable combination of high hardness and elastic modulus together with high fracture resistance [21].
The industrial preparation of coatings brings another level of complexity to the deposition process.
To ensure sufficient coating uniformity when a large number of pieces are being coated in a single batch, industrial systems are typically equipped with multi-axis substrate rotation. The substrates typically move around and in front of a stationary source or sources of the thin-film forming species to uniformly coat complex objects [34]. Such geometry typically introduces the growth of a multilayered structure of the coating when multiple sources are used simultaneously, or reactive gases are introduced during the deposition [35–37]. Recently, the appearance of the multilayered structure of magnetron sputtered W–B–C coatings was even reported in non-reactive sputtering from a single cathode [26]. The layering in industrial conditions is often disregarded. However, it can be beneficial for many applications where a large number of interfaces can enhance the fracture resistance of the coating [38,39].
The present paper explores the possibilities for the preparation of Ta–B–C coatings in an industrial sputtering device employing a combinatorial approach, where a large industrial cathode with variable composition was used as the sputter source. The evolution of the chemical composition as a function of the sample position in the chamber is shown. The morphology, structure, the present crystalline phases, and the mechanical properties of the coatings are described. Similarities and differences between the samples deposited in a stationary position in front of the cathode racetrack and those performing a 1-axis rotation are shown and discussed. The mechanical properties, as well as the fracture resistance, were found to be on par with the protective coatings currently used in machining.
2. Experimental Setup
2.1. Sample Deposition
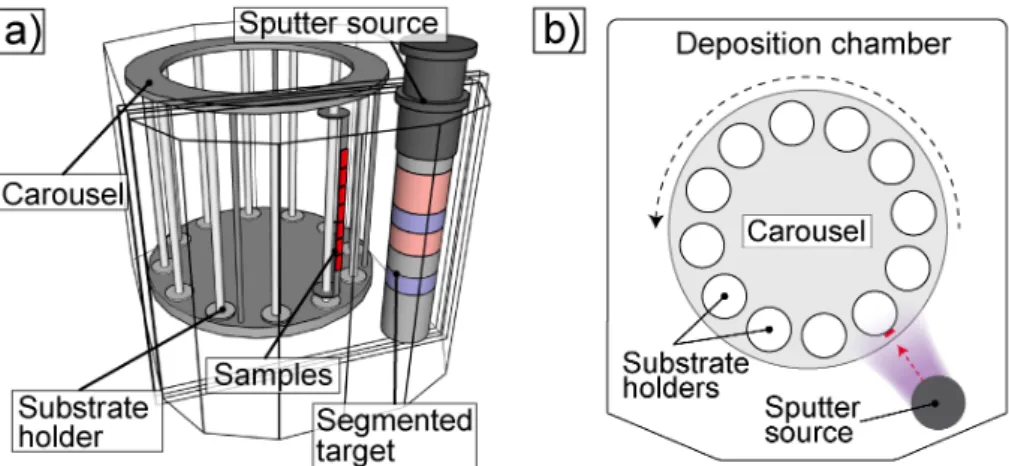
An industrial-scale deposition system provided by SHM, Šumperk, Czech Republic [1] was utilized for depositing the Ta–B–C coatings in this study. A sketch of the deposition chamber is shown in Figure1. The internal dimensions of the high-vacuum chamber are 550 mm×550 mm×850 mm.
The chamber contains a carousel with substrate holders capable of performing single-axis rotation around the center of the carousel. A single segmented rotating cylindrical sputter source was placed in the chamber door. The target was composed of tantalum, graphite, and B4C ring segments placed on top of each other, creating a uniform cylindrical target. Two different targets setups shown in Figure2 were used. The number and the location of the different segments were varied between these two setups to achieve different coating compositions along the height of the segmented target. The vacuum was sustained by a Pffeifer TMH 1201 P turbomolecular pump backed by an Edwards E2M40 rotary oil pump (Edwards, Burgess Hill, UK). The base pressure before the deposition process was measured by a Pffeifer IKR 251 ionization vacuum gauge (Pfeiffer Vacuum, Aßlar, Germany). The deposition pressure was measured by an MKS Baratron 627BX capacity vacuum gauge (MKS Instruments, Andover, MA, USA). Argon was dosed via MKS mass flow gauge (MKS Instruments, Andover, MA, USA).
Figure 1.Industrial deposition system which utilizes a segmented cylindrical target as sputter source (a) 3D model of the chamber showing the placement of samples on the carousel with reference to the sputter source; (b) top-view scheme of the deposition system.
Figure 2.The two setups of segmented target utilized for the coating deposition with height reference of the sample placement. The middle of the target was assigned as 0 coordinate.
AISI 304 stainless steel and silicon (100) substrates were ultrasonically cleaned in degreasing agents for 5 min. The samples were placed vertically onto the substrate holder parallel to the cathode as is shown in Figure2. Two sets of samples were prepared in dedicated deposition processes for each target setup. One set of samples was placed in a stationary position 10 cm from the surface of the target facing the racetrack. The other set of samples was performing a 1-axis rotation at a rate of 5 rpm facing
the target as it was passing it. Prior to the deposition process, the chamber was evacuated to a base pressure lower than 5×10⁻³Pa when the chamber was heated to the deposition process temperature of 550 °C. Argon was then introduced into the chamber, and argon ion etching of the substrates was performed utilizing a remote arc ionization source to clean the surface of substrates biased to−300 V.
During the ion-etching step, the power delivered to the shuttered target was ramped to 10 kW for 15 min, and the target was sputter-cleaned. The shutter was opened at the start of the deposition, and the bias voltage was set to−100 V. The depositions were carried out at an argon pressure of 0.44 Pa corresponding to the argon flow of 48 sccm. The deposition time varied according to the required thickness of the coating of at least 1 µm in each case. After the deposition, the power applied to the target, the bias, the argon flow, and the heating were turned off, and the samples were left to cool down in vacuum over night.
2.2. Sample Characterization
The chemical composition of the coatings was determined by energy-dispersive X-ray spectroscopy (EDX) using an Oxford Instruments X-MAX50 detector (Oxford Instruments, Abingdon-on-Thames, UK) attached to a Tescan MIRA 3 scanning electron microscope (SEM, Tescan, Brno, Czech Republic) that was also utilized for SEM imaging. The spectra were acquired from a 50 µm×50 µm area of the coating surface using an electron beam at an accelerating voltage of 8 kV.
The elemental composition was then quantified by the AZtec software (Version 4.2, Oxford Instruments, Abingdon-on-Thames, UK) using the implemented internal library of standards. Although EDX suffers from a low boron signal and overestimation of the carbon by as much as several percent, the trends in the chemical composition are in accordance with the target setup and positions of the different segments.
In order to acquire information on the microstructure of the coatings, transmission electron microscopy (TEM) analysis was carried out including high-resolution TEM (HR-TEM) and selected area electron diffraction (SAED) using a Cscorrected Thermo Fisher Themis TEM (Thermo Fisher Scientific, Waltham, MA, USA) at 200 kV accelerating voltage (point resolution was 0.08 nm). The specimens were prepared by Ar ion beam milling using Technoorg Linda equipment. The thinning procedure was finished at low-energy of 300 eV to minimize possible ion beam damage.
The microstructure of the coatings was further studied by X-ray diffraction (XRD) using a Rigaku SmartLab Type F X-ray diffractometer (Rigaku Corporation, Tokyo, Japan) in a Bragg–Brentano configuration with a 3 kW copper KαX-ray source. The size of crystallites was calculated using the Scherrer equation attributing the peak broadening only to the crystallite size [40].
Hysitron TI 950 TriboIndenter (Bruker, Billerica, MA, USA) with a diamond Berkovich tip was used to evaluate the hardness and effective elastic modulus of the coatings on steel substrates. Sixteen quasistatic indentation tests with 20 segments of partial unloading per each test with a maximum load of 11 mN were performed for each analytical spot on the sample. Four analytical spots were located equidistantly on every sample. The maximum indentation depth was always<1/10 of film thickness to avoid any substrate effect. The calculation method proposed by Oliver and Pharr [41] was performed to process the load-displacement curves in order to determine the hardness and the effective elastic modulus. The effective elastic modulus was calculated from the known material parameters of the diamond indenter and the measured reduced elastic modulus. It can be expressed asEeff=E/(1−ν2) whereνis the Poisson’s ratio of the coating andEis its Young’s modulus. An additional high-load test with a maximum load of 1 N was performed on selected samples to study the residual indenter impressions on the coating for evaluation of the coating fracture resistance.
The residual stress in the coatings was determined from the curvature radius of the silicon samples, the thickness of the coatings, and the parameters of the silicon (100) substrate using the Stoney equation [42] by the method described in detail [43]. The measurement of the curvature radius was performed using a Bruker DektakXT profilometer (Bruker, Billerica, MA, USA) along the horizontal axis of silicon samples. The radius measurement and the nanoindentation tests were
performed several weeks after the deposition to allow for the partial relaxation of the stress generated during the deposition or during the cool-down phase after the deposition to a steady-state value.
A LEXT OLS4000 3D laser confocal microscope (Olympus, Tokyo, Japan) was used for analysis of the surface roughness on selected samples. The roughness profile was measured along four lines with 400 µm evaluation length in close vicinity to the indentation areas and with the roughness/waviness cut-off wavelength set to 80 µm. The average roughness value (Ra) was selected to evaluate the sample roughness.
All coating analyses were performed with sufficient spatial resolution to account for the gradient of the chemical composition of the coatings. The analytical sites were selected on the vertical central axis of samples 10 mm apart.
3. Results and Discussion
3.1. Chemical Composition and Deposition Rate
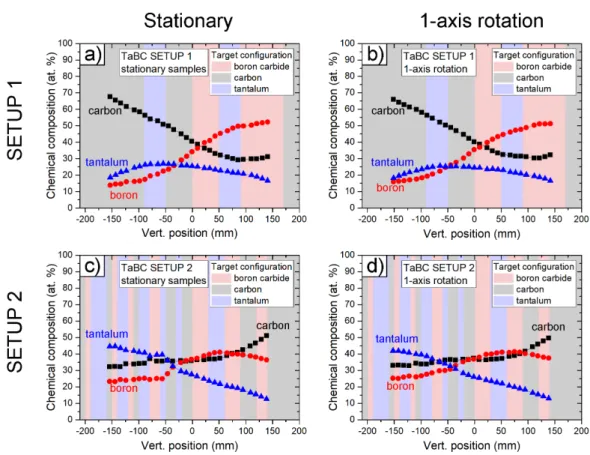
The samples were prepared in the two different target setups previously shown in Figure1.
Setup 1 had two tantalum segments placed symmetrically around the middle of the target that was designated as the coordinate 0. Boron carbide segments were placed on the top part of the target (i.e., positive vertical coordinates), and carbon segments were predominantly placed on the bottom part of the target (i.e., negative vertical coordinates). Therefore, this setup was designed to achieve stable relative tantalum concentration in the coatings and to study the effect of the boron to carbon ratio. On the other hand, setup 2 concentrated most of the tantalum segments at the bottom of the target, while the boron carbide and carbon segments were more evenly distributed along the target height. The tantalum concentration in the coatings was expected to vary significantly.
The chemical composition of the deposited coatings as a function of the vertical coordinate is shown in the four graphs in Figure3. The color of the background shows the type of the target segment at the corresponding position—black for carbon graphite, blue for tantalum, and red for boron carbide.
The first row of graphs shows the chemical composition of the samples prepared with the sputtered target assembled in Setup 1, the second row those in Setup 2. The first column shows results for samples placed stationary in front of the target racetrack, and the second column shows the results for the samples performing the 1-axis rotation around the carousel center. Samples prepared in Setup 1 in the stationary position in front of the target exhibited a carbon content decrease with the vertical position from∼70 to∼30 at.%. The boron content increased from∼10 to∼55 at.% and the tantalum content stayed within the range of∼15 to∼30 at.%. Samples performing the 1-axis rotation showed the same trend and nearly the same composition at the corresponding vertical position. Samples prepared in Setup 2 in the stationary position in front of the target exhibited carbon content increase with the vertical position from∼30 to∼50 at.%. The boron content increased from∼25 to∼45 at.%
and tantalum content decreased from∼40 to∼10 at.%. No significant difference, between the chemical composition of the stationary samples and the samples performing the 1-axis rotation deposited at the same vertical position, was observed.
Figure 3.Chemical composition of the TaBC coatings with reference to the target setup and rotation during the deposition: (a) stationary placed samples and (b) samples carrying 1-axis rotation prepared with target in Setup 1; (c) stationary placed samples and (d) samples carrying 1-axis rotation prepared with target in Setup 2.
The chemical composition of all the deposited samples can be clearly visualized in the ternary diagram shown in Figure4. The deposited coatings cover a composition space area of 13–45 at.% of tantalum, 14–52 at.% of boron and 32–68 at.% of carbon.
Figure 4.Ternary diagram of the deposited coatings.
The deposition rate is always the highest for coatings deposited in the vertical center of the target in position 0, and it decreases to approximately 70% of the maximum deposition at vertical
positions of +150 and−150 mm corresponding to the racetrack edges. The deposition rate differs for the stationary coatings and those performing the 1-axis rotation. The deposition rate in the center of the target is approximately 200 nm/min for coatings placed stationary in front of the target in both target setups. When the 1-axis rotation is utilized, the deposition rate drops by a factor of 8 along the whole height of the target. This resulted in a deposition rate of approximately 25 nm/min for the rotating coatings placed at the target center. The deposition times were set to deposit coating with the minimum thickness of 3 µm on steel substrate and 1 µm on the silicon substrate.
3.2. Morphology and Structure
Typical SEM images of the surface morphology and corresponding unpolished broken cross-sections of coatings with distinctly different compositions prepared on the Si (100) substrates are shown in Figures5and6for stationary samples and for samples performing the 1-axis rotation, respectively. The surface of the stationary samples shown in Figure5was relatively smooth with no significant features. The samples performing the 1-axis rotation during the deposition shown in Figure6exhibited similar surface morphology to their stationary counterparts. The cross-sections show the fine columnar structure of the coatings. However, the columns are thicker and more pronounced.
Coatings with the lowest tantalum content, deposited both in the stationary position and performing the 1-axis rotation, were more fragile during the breakage, and no clean fracture surface was obtained as can be seen in the bottom right cross-section images in Figures5and6.
Figure 5.SEM images of surface morphology and unpolished cross-sections of stationary samples.
Figure 6.SEM images of surface morphology and unpolished cross-sections of samples performing the 1-axis rotation.
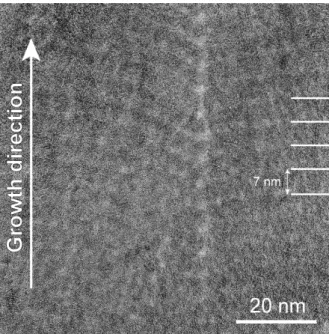
The TEM image of the rotating sample shown in Figure7reveals the presence of lighter and darker layers horizontally arranged with a repetition period of∼7 nm. The vertical lighter column was caused by the surface asperities of the silicon sample after intense argon ion cleaning. This repetition period of the horizontal layers corresponds to the time of one rotation of the samples around the carousel. Formation of similar multilayers in a similar industrial deposition configuration has been
recently reported and explained by the different transport routes of lighter and heavier elements sputtered from the target [26].
Figure 7. TEM image of the cross-section of a rotating sample with 29 at.% of Ta, 36 at.% of B and 35 at.% of C with apparent multilayered structure.
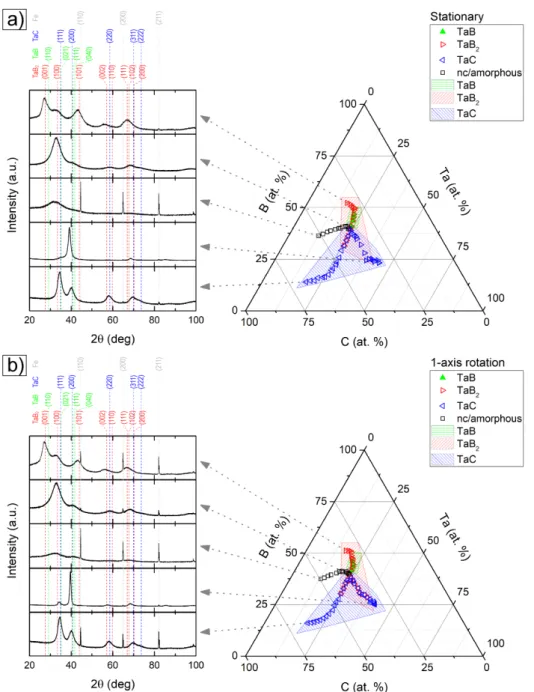
X-ray diffractograms of representative coatings for stationary samples and rotating samples are shown on the left side of Figure8a,b, respectively. Most of the diffractograms exhibited crystalline peaks, and the present crystalline phases were identified. The presence of the crystalline phases in the studied coatings is summarized in Figure8in the ternary diagrams. The microstructure of the samples prepared in the stationary position facing the target racetrack is shown in Figure8a and that of the samples performing the 1-axis rotation in Figure8b. TaC, TaB, and TaB2phases were found in the deposited coatings. The reference positions of the diffraction peaks are marked by vertical lines and the presence of each phase in the ternary diagrams in Figure8is marked by a dedicated symbol. If more than one symbol is shown at the same point in Figure8, more than one crystalline phase was present in the corresponding coating. The presence of the Ta2BC phase was not proved [13]. The presence of the different crystalline phases is in accordance with the chemical composition of the corresponding samples. The TaB2phase is observed when the boron content is&25 at.%, and the coatings exhibit only a single crystalline phase if the boron content is&50 at.%. An example of the measured diffraction patterns exhibiting only the TaB2diffraction peaks (PDF card no. 00-038-1462) is shown as the top diffraction patterns on the left side of Figure8a,b. The TaC phase is observed if the boron content is .40 at.% irrespective of the actual carbon content. When the carbon content is&45 at.%, TaC is the only crystalline phase observed. Examples of the measured diffraction patterns exhibiting only the TaC diffraction peaks (PDF card No. 00-035-0801) are shown as the two diffraction patterns at the very bottom of Figure8a,b. The TaB phase is never found to be existing as the only crystalline phase in the coatings. It is formed only if the boron content is in the range of∼40–50 at.%. It never exhibits dominant crystalline peaks and is only observed as an asymmetric broadening of the (101) and (001) peaks of the TaB2phase at diffraction angles corresponding to the positions of the (021), (111) and (110) peaks of the TaB phase (PDF card no. 00-035-0815). Positions of these three peaks are shown by green vertical lines in the diffraction patterns in Figure8a,b. When the samples contained∼40 at.% of boron, 10–25 at.% of tantalum and 40–50 at.% of carbon, they were X-ray amorphous. This can be seen in the center diffraction patterns in Figure8a,b. However, the formation of short-range ordered structures in the X-ray amorphous coating such as those seen in the case of WBC coatings is possible [23,25].
There was no significant difference between samples of similar composition that were prepared in the stationary position and those performing the 1-axis rotation.
Figure 8.Identified crystalline phases. Typical diffraction patterns with reference peak positions are provided on the left: (a) stationary samples; (b) rotating samples.
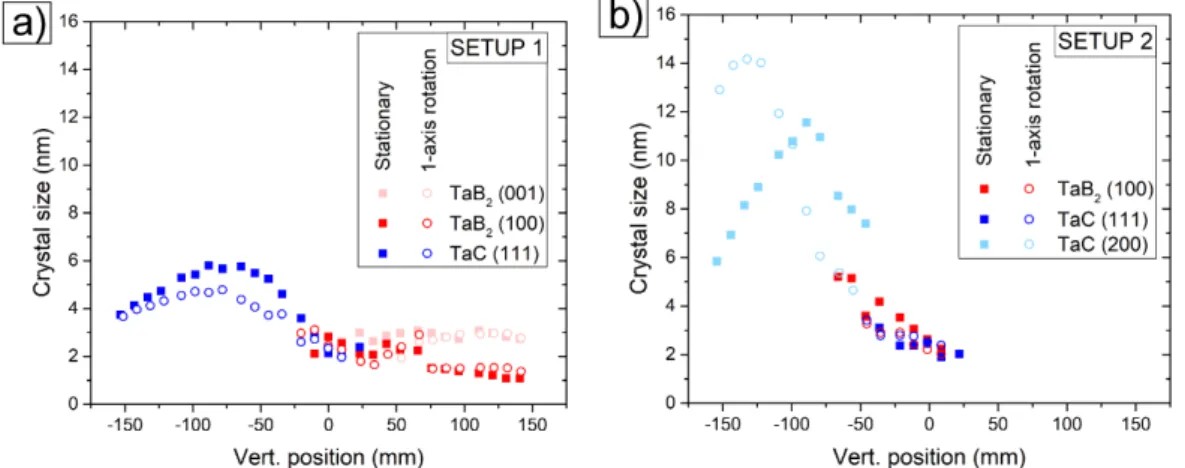
The crystallite sizes calculated from all the diffraction peaks allowing for reliable fitting are plotted in Figure9as a function of the vertical position. The crystallite sizes of the different phases found in samples prepared in Setup 1 shown in Figure9were always.6 nm. The crystallite sizes were the highest for the TaC phase reaching∼6 nm, and they were typically∼2 nm for the TaB2phase.
Such crystallite sizes are on the lower resolution limit of the measurement method, and an error of±2 nm has to be considered. Where more than one diffraction peak allows for a reliable fitting, as is the case for the TaB2phase, the crystallite sizes calculated from different diffraction peaks are similar. There was also no appreciable difference between the crystallite sizes for the same phase in samples prepared in the stationary position in front of the target and those performing the 1-axis rotation. Crystallite sizes of up to∼14 nm for the TaC phase were reached in the samples prepared
in Setup 2. The vertical position where the maximum crystallite size was reached is shifted between the stationary and rotating samples by∼50 mm. The crystallite sizes rapidly decreased with the increasing vertical position after reaching their maximum size and samples prepared at positions
&25 mm were amorphous.
Figure 9.Crystallite sizes calculated from all peaks allowing for reliable fitting: (a) Setup 1; (b) Setup 2.
The most intensive diffraction peaks in the diffraction patterns in every coating also yield the largest crystallite size. These maximum crystallite sizes are plotted in the ternary diagram in Figure10.
High boron concentration is unfavorable for the growth of large grains and samples with boron content
&35 at.% exhibit grains smaller than 3 nm or are amorphous. Larger grains are generally observed
when only the TaC phase is present. This indicates that simultaneous competitive growth of the TaC and TaB phases impedes the grain growth of the TaC phase [44]. The largest grain size is achieved for coatings with similar composition for stationary as well as rotating substrates.
Figure 10.Maximum crystallite sizes calculated from the most intensive diffraction peaks.
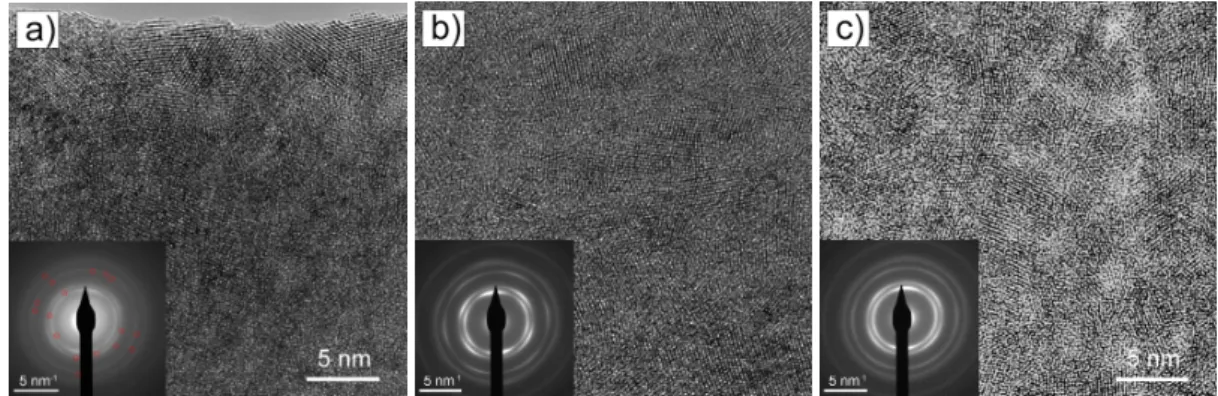
The TEM images of representative samples are shown in Figure11. Figure11a shows a stationary placed sample with 25 at.% of Ta, 38 at.% of B and 37 at.% of C. This composition places the sample at the intersection of the two deposition setups, where the XRD analysis revealed the simultaneous presence of the crystalline TaC, TaB, and TaB2phases. The TEM images reveal that the sample was predominantly nanocrystalline with little to no amorphous phase. The grain size is<5 nm. The selected electron diffraction pattern (SAED) shown in the inset of the image reveals diffuse diffraction rings and with several bright segments of rings in the SAED pattern. The latter features indicate texture in the film. They correspond to an FCC crystalline phase with the interplanar distance 4.48 Å. This can be
attributed to the TaC phase. An inverse FFT of the image together with the measured SAED pattern also suggest the presence of other phases; that, however, cannot be precisely identified. Figure11b shows a stationary placed sample with 33 at.% of Ta, 33 at.% of B, and 34 at.% of C lying in the composition area, where only the TaC phase was detected by the XRD analysis. The TEM image shows that the coating was also predominantly nanocrystalline with∼2–3 nm grain size. The electron diffraction shows an FCC structure of the present crystalline phase with the interplanar distance of 4.46 Å and a strong 111 texture. The presence of the TaC phase was identified. The dark field images with the corresponding bright-field image reveal that the grains formed a columnar structure with columns being arranged in the growth direction and with a thickness of∼10 nm. The individual columns penetrate several layers. According to Structure Zone Models, such texture may form as a result of nucleation rather than coalescence at such relatively low growth temperatures [45].
Figure11c shows a rotating sample with 29 at.% of Ta, 36 at.% of B and 35 at.% of C. The XRD analysis revealed the presence of TaC and TaB2crystalline phases. The TEM image shows that the coating was predominantly nanocrystalline with a grain size of∼2–3 nm. The selected area electron diffraction shows a crystalline phase with the FCC structure and an interplanar distance of 4.46 Å and weak 111 texture. The hexagonal TaB2phase is not visible in this image.
Figure 11.HRTEM images of (a) stationary sample with 25 at.% of Ta, 38 at.% of B and 37 at.% of C;
(b) stationary sample with 33 at.% of Ta, 33 at.% of B and 34 at.% of C; (c) sample performing 1-axis rotation with 29 at.% of Ta, 36 at.% of B and 35 at.% of C.
3.3. Mechanical Properties
The mechanical properties and the stress of the coatings studied are shown in Figures12–14.
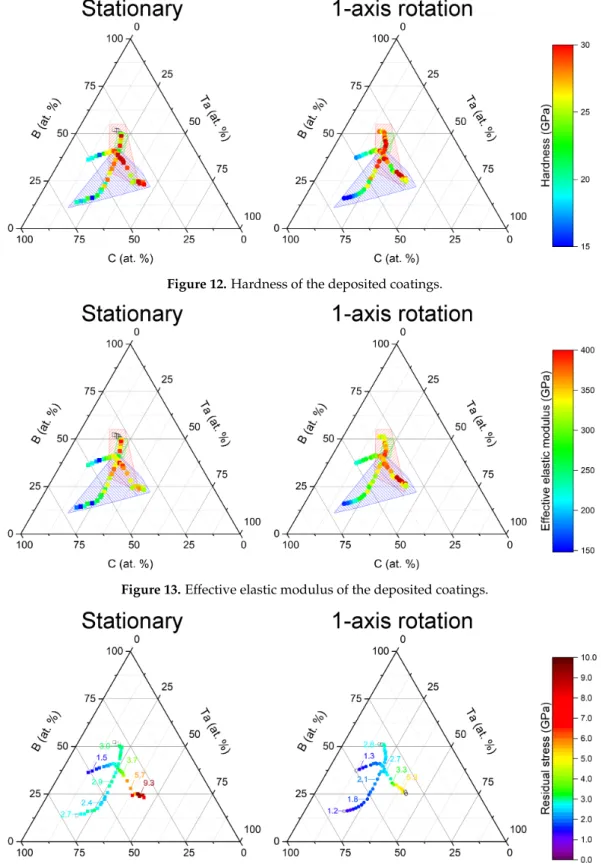
The hardness of the deposited coatings is plotted in the ternary diagram in Figure12. The average error in hardness measurement is±5 GPa due to high roughness of the coatings on the stainless steel substrates, especially those deposited in the stationary position. The average roughness of the samples was in the range of 45–80 nm for most samples and even∼200 nm for coatings close to Ta41B25C34. The roughness was higher than that of the ion-cleaned substrate of 25 nm, as is typical for coatings grown at lower temperatures compared to their melting temperature and at high deposition rates [46].
Depending on the chemical composition, the hardness reached values of 15–30 GPa. No systematic difference between coatings with the corresponding composition deposited in the stationary position and rotating samples is observed. The effective elastic modulus is plotted in Figure13. The average error of the effective elastic modulus measurement was±50 GPa because of the sample roughness.
The effective elastic modulus reached values of 150–450 GPa depending on the chemical composition of the coatings. The coatings prepared employing the 1-axis rotation generally showed slightly higher effective elastic modulus compared to their stationary counterparts. The residual stress calculated from the silicon strip curvature ranges from∼−1 to∼−9 GPa, and it is plotted in Figure14. The residual stress is always compressive. The deposition process onto silicon strips had to be shortened as longer deposition times led to the disintegration of the silicon substrates during the deposition. Coatings on silicon.500 nm thick were typically analyzed.
Figure 12.Hardness of the deposited coatings.
Figure 13.Effective elastic modulus of the deposited coatings.
Figure 14.Residual stress of the deposited coatings.
Two areas of composition where the coatings reach the highest measured hardness and effective elastic modulus and one area of low hardness and effective elastic modulus were observed in Figure12 for stationary as well as rotating coatings. The first area of high hardness and high elastic modulus is observed for coatings with the highest tantalum content of∼45 at.%. The hardness can be explained by the low amount of boron and the similar content of tantalum and carbon. These conditions favor
the formation of the TaC phase with grains ordered into coherently diffracting zones with the size of 10–16 nm. The composition suggests the formation of near-stoichiometric crystallites together with the formation of low amounts of an amorphous matrix. Such a nanocomposite structure is favorable for achieving high hardness of the coating [47,48]. The measured hardness of 25–30 GPa is indeed in agreement with the hardness of 25–35 GPa reported for nanocomposite tantalum carbide thin films with grains close to stoichiometry [31], and it is significantly higher than that of bulk tantalum carbide with a hardness of only 15–19 GPa [49]. This area also exhibits the highest compressive stress of
∼−9 GPa. The coatings exhibit an effective elastic modulus of 300–400 GPa corresponding to the moduli measured in the range of 250–400 GPa reported for nanocomposite TaC coatings [31].
The second area of high hardness and high elastic modulus is observed at the intersection of both setups with∼25 at.% of tantalum,∼40 at.% of boron, and∼35 at.% of carbon. All the crystalline phases—TaC, TaB, and TaB2—are present in this area. Based on the XRD patterns, the composition, and the TEM imaging, it can be seen that, although the individual grains are small, the coatings exhibit a high degree of crystallinity with only a negligible volume of any amorphous phase. The measured hardness corresponds to that measured for tantalum carbide coatings of 25–35 GPa [31,50] and nanocomposite tantalum diboride coatings with a hardness of 30–40 GPa [30]. The second area at the intersection of the two deposition lines also exhibits higher compressive stress of∼−3 GPa.
The effective elastic modulus of 300–400 GPa is higher than 200–250 GPa reported for nanocomposite TaB2coatings [30] and much lower than 500–600 GPa reported for bulk polycrystalline TaB2[39,51].
It is comparable to the elastic modulus reported for nanocomposite TaC coatings of 250–400 GPa [31].
The high carbon content of&45 at.% led to the low hardness of the coatings within the range of 15–20 GPa and a low effective elastic modulus in the range of 150–300 GPa. This is true for purely amorphous coatings as well as for coatings containing the TaC crystalline phase with crystallite size of∼4 nm. Amorphous coatings generally show lower hardness compared to corresponding nanostructured coatings [52]. Even when a crystalline phase is formed, certain grain size and the ratio of the amount of the crystalline grains to the possible amorphous matrix is required for achieving high hardness. The grains need to be generally in the range of 10–20 nm due to an effect similar to the Hall–Petch effect in polycrystalline materials to contribute to nanocomposite hardening, and the grains need to be separated by only one or a few atomic layers of the matrix to achieve the maximum hardness [47,53,54]. In our case, the chemical composition together with the observed XRD patterns suggest the presence of grains with the size of only∼2–4 nm together with a high volume of the amorphous matrix and a wide grain separation [25,48,55]. This structure favors grain sliding and the occurrence of the inverse Hall–Petch effect [56] resulting in coatings with low hardness.
These coatings also exhibit the lowest stress with its absolute value of.2 GPa. The hardness of the amorphous samples corresponds to hardness reported for amorphous boron carbide coatings [57,58].
The hardness of the carbon-rich samples where the TaC phase was detected is much lower compared to nanocomposite tantalum carbide coatings 25–35 GPa [31]. It is closer to that of amorphous sputtered carbon coatings with the hardness of 10–15 GPa [59]. The carbon-rich coatings also exhibit low stress with its absolute value of.2.5 GPa. The measured elastic modulus of 150–300 GPa of the amorphous samples corresponds to that of 150–250 GPa reported for sputtered amorphous boron carbide coatings [57,58]. The elastic modulus of the carbon-rich samples where the TaC phase was detected is in the range of 140–270 GPa. This is lower compared to nanocomposite tantalum carbide that exhibits the elastic modulus in the range of 240–470 GPa [31,50]. It is, however, comparable to the elastic modulus of amorphous carbon coatings that exhibit the elastic modulus of 100–200 GPa [59].
This suggests that these coatings are composed of a high volume of a mostly carbon matrix separating small TaC grains.
Although there was no systematic difference in the hardness and elastic modulus of static and rotating coatings with corresponding composition, the rotating coatings systematically show a lower value of the compressive stress compared to their stationary counterparts as can be seen in Figure14.
This can be partly due to the coatings periodically moving between areas of high deposition rate
in front of the target and low deposition rate opposite the target allowing partial relaxation of the stress [60]. Another possible effect contributing to the relieving of the stress that was observed in the rotating coatings is stress relaxation on the interfaces of the individual layers seen in Figure7[61,62].
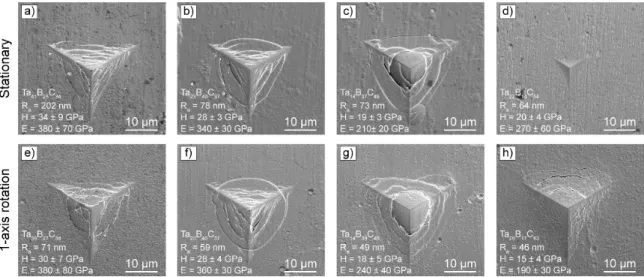
The typical residual indenter impressions after 1N indentation used specifically for the evaluation of the coating fracture resistance in coatings covering the whole studied composition space are shown in Figure15. Figure15a–d show the stationary samples and Figure15e–h the corresponding samples carrying out the 1-axis rotation. There is no significant difference between the appearance of the residual indenter impressions in stationary samples shown in Figure15a–c and the corresponding rotating samples shown in Figure15e–g. The residual imprint in the stationary sample in Figure15d is significantly smaller compared to the indenter impression in the coating carrying out the 1-axis rotation shown in Figure15h. This is given by the difference in the thickness of the coatings as coatings with similar thickness were not available for this composition. While the stationary coating is∼10 µm thick, the coating performing the 1-axis rotation is only∼2 µm thick. Underneath the coatings was stainless steel with a hardness of only∼3 GPa and the elastic modulus of∼230 GPa.
The indentation in the thinner coating is much more affected by the soft and yielding substrate and allows for much deeper indentation compared to the indentation of the thick, hard and unyielding coating. The residual imprints, in general, show clear picture frame cracking. The amount and severity of the cracks are comparable to that found in current typical commercially used protective coatings such as AlTiN or TiB2[63]. Therefore, the fracture resistance of the coating is on a par with the current hard protective coatings.
Figure 15. Residual indenter impressions after 1N indentation of coatings with corresponding composition, average roughness, hardness and elastic modulus (a–d) stationary sample; (e–h) sample carrying out 1-axis rotation.
4. Conclusions
Ta–B–C coatings have been deposited in an industrial deposition configuration with a rotating cylindrical cathode equipped by a segmented target. A combinatorial approach using two different target setups leading to different coating compositions was used. The deposited coatings covered a composition space area of 13–45 at.% of tantalum, 14–52 at.% of boron, and 32–68 at.% of carbon.
All the deposited coatings exhibit a dense fine columnar structure. Rotating coatings are found to exhibit a multilayered structure with a repetition period of∼7 nm. This multilayered structure has no significant effect on the crystalline phases present in the coating or on the size of the crystallites.
These are governed by the chemical composition of the coatings. The coatings are either amorphous, nanocomposite, or nanocrystalline with a maximum crystallite size of∼15 nm and a typical crystallite size of∼4 nm. TaC, TaB, and/or TaB2phases are identified in the coatings. The presence of the Ta2BC phase is not proven. The maximum hardness and the elastic modulus of the coatings are associated
with either the presence of larger TaB crystallites with a low volume of amorphous matrix arranged in a nanocomposite form or with polycrystalline coatings exhibiting the simultaneous presence of the TaC, TaB2, and TaB crystalline phases with no amorphous matrix present. The fracture resistance is already on a par with current protective coatings on the market.
Author Contributions: Conceptualization, M.K., P.S., and P.V.; methodology, M.K., P.M., P.S., and L.Z.;
investigation, Z.C., M.K., P.M., and L.Z.; visualization, M.K., P.S., and Z.C.; writing, P.S. and M.K.; supervision, P.V.;
funding acquisition, P.V. and K.B. All authors have read and agreed to the published version of the manuscript.
Funding:This article is created within the FV30262 project, which is funded through the TRIO program of the Ministry of Industry and Trade with financial support from the state budget of Czech Republic. This research has been supported by project GA19-03899S funded by the Czech Science Foundation (GA ˇCR) and project LM2018097 funded by the Ministry of Education, Youth, and Sports of the Czech Republic. This research was also supported by Grant No. VEKOP-2.3.3-15-2016-00002 of the European Structural and Investment Funds.
Acknowledgments: The authors would like to acknowledge M. Jílek and V. Sochora from SHM Šumperk for lending the deposition apparatus and R. Diviš for his support.
Conflicts of Interest:The authors declare no conflict of interest.
References
1. SHM s.r.o., Šumperk, Czech Republic. SHM Industrial PVD Coatings—PVD Coatings. Available online:
https://shm-cz.cz/en/pvd-coatings/(accessed on 29 August 2020).
2. Oerlikon Balzers, Balzers, Lichtenstein. Oerlikon Balzers—Balzers Surface Solutions. Available online:https:
//www.oerlikon.com/balzers/com/en/portfolio/balzers-surface-solutions/(accessed on 29 August 2020).
3. CemeCon, Aachen, Germany. Cemecon the Tooling Company—Coating Materials. Available online:
https://www.cemecon.de/en/coating-materials(accessed on 29 August 2020).
4. Jilek, M.; Cselle, T.; Holubar, P.; Morstein, M.; Veprek-Heijman, M.; Veprek, S. Development of novel coating technology by vacuum arc with rotating cathodes for industrial production of nc-(Al1-xTix) N/a-Si3N4 superhard nanocomposite coatings for dry, hard machining. Plasma Chem. Plasma Process.2004,24, 493–510.
[CrossRef]
5. Veprek, S.; Veprek-Heijman, M.J. Industrial applications of superhard nanocomposite coatings.
Surf. Coat. Technol.2008,202, 5063–5073. [CrossRef]
6. Zhang, Q.; Wu, Z.; Xu, Y.X.; Wang, Q.; Chen, L.; Kim, K.H. Improving the mechanical and anti-wear properties of AlTiN coatings by the hybrid arc and sputtering deposition. Surf. Coat. Technol. 2019, 378, 125022. [CrossRef]
7. Voevodin, A.; Zabinski, J. Superhard, functionally gradient, nanolayered and nanocomposite diamond-like carbon coatings for wear protection. Diam. Relat. Mater.1998,7, 463–467. [CrossRef]
8. Hahn, R.; Bartosik, M.; Soler, R.; Kirchlechner, C.; Dehm, G.; Mayrhofer, P.H. Superlattice effect for enhanced fracture toughness of hard coatings. Scr. Mater.2016,124, 67–70. [CrossRef]
9. Chen, Y.H.; Roa, J.; Yu, C.; Johansson-Joesaar, M.; Andersson, J.; Anglada, M.; Oden, M.; Rogström, L.
Enhanced thermal stability and fracture toughness of TiAlN coatings by Cr, Nb and V-alloying.
Surf. Coat. Technol.2018,342, 85–93. [CrossRef]
10. Hahn, R.; Kirnbauer, A.; Bartosik, M.; Kolozsvári, S.; Mayrhofer, P. Toughness of Si alloyed high-entropy nitride coatings. Mater. Lett.2019,251, 238–240. [CrossRef]
11. Emmerlich, J.; Music, D.; Braun, M.; Fayek, P.; Munnik, F.; Schneider, J.M. A proposal for an unusually stiff and moderately ductile hard coating material: Mo2BC.J. Phys. D Appl. Phys.2009,42, 185406. [CrossRef]
12. Bolvardi, H.; Emmerlich, J.; Mráz, S.; Arndt, M.; Rudigier, H.; Schneider, J.M. Low temperature synthesis of Mo2BC thin films. Thin Solid Films2013,542, 5–7. [CrossRef]
13. Bolvardi, H.; Emmerlich, J.; to Baben, M.; Music, D.; von Appen, J.; Dronskowski, R.; Schneider, J.M.
Systematic study on the electronic structure and mechanical properties of X2BC (X = Mo, Ti, V, Zr, Nb, Hf, Ta and W).J. Physics: Condens. Matter2012,25, 045501. [CrossRef]
14. Mitterer, C.; Mayrhofer, P.; Beschliesser, M.; Losbichler, P.; Warbichler, P.; Hofer, F.; Gibson, P.; Gissler, W.;
Hruby, H.; Musil, J.; et al. Microstructure and properties of nanocomposite Ti–B–N and Ti–B–C coatings.
Surf. Coat. Technol.1999,120, 405–411. [CrossRef]
15. Ok, J.T.; Park, I.W.; Moore, J.J.; Kang, M.C.; Kim, K.H. Syntheses and mechanical properties of Ti–B–C coatings by a plasma-enhanced chemical vapor deposition. Surf. Coat. Technol. 2005, 200, 1418–1423.
[CrossRef]
16. Shimada, S.; Takahashi, M.; Tsujino, J.; Yamazaki, I.; Tsuda, K. Deposition and wear resistance of Ti–B–N–C coatings on WC–Co cutting tools from alkoxide solutions by thermal plasma CVD.Surf. Coat. Technol.2007, 201, 7194–7200. [CrossRef]
17. Abad, M.D.; Cáceres, D.; Pogozhev, Y.S.; Shtansky, D.V.; Sánchez-López, J.C. Bonding structure and mechanical properties of Ti–B–C coatings.Plasma Process. Polym.2009,6, S107–S112. [CrossRef]
18. Lauridsen, J.; Nedfors, N.; Jansson, U.; Jensen, J.; Eklund, P.; Hultman, L. Ti–B–C nanocomposite coatings deposited by magnetron sputtering.Appl. Surf. Sci.2012,258, 9907–9912. [CrossRef]
19. Friedemann, M.; Klostermann, H. Composition and mechanical properties of BCW and BC–Ti thin films prepared by pulse magnetron sputtering.Surf. Coat. Technol.2016,308, 115–120. [CrossRef]
20. Contreras, E.; Galindez, Y.; Gómez, M. Microstructure, mechanical and tribological properties of TiBC coatings by DC magnetron sputtering onto AISI M2 steel using independent TiB2and graphite targets.
Surf. Coat. Technol.2018,350, 298–306. [CrossRef]
21. Buršík, J.; Buršíková, V.; Souˇcek, P.; Zábranský, L.; Vašina, P. Characterization of Ta–B–C nanostructured hard coatings. IOP Conf. Ser. Mater. Sci. Eng.2017,175, 012020. [CrossRef]
22. Nedfors, N.; Tengstrand, O.; Eklund, P.; Hultman, L.; Jansson, U. Nb–B–C thin films for electrical contact applications deposited by magnetron sputtering.J. Vac. Sci. Technol. A2014,32, 041503. [CrossRef]
23. Alishahi, M.; Mirzaei, S.; Souˇcek, P.; Zábransk `y, L.; Buršíková, V.; Stupavská, M.; Peˇrina, V.; Balázsi, K.;
Czigány, Z.; Vašina, P. Evolution of structure and mechanical properties of hard yet fracture resistant W–B–C coatings with varying C/W ratio.Surf. Coat. Technol.2018,340, 103–111. [CrossRef]
24. Debnárová, S.; Souˇcek, P.; Vašina, P.; Zábransk `y, L.; Buršíková, V.; Mirzaei, S.; Pei, Y. The tribological properties of short range ordered WBC protective coatings prepared by pulsed magnetron sputtering.
Surf. Coat. Technol.2019,357, 364–371. [CrossRef]
25. Mirzaei, S.; Alishahi, M.; Souˇcek, P.; Zábransk `y, L.; Buršíková, V.; Stupavská, M.; Peˇrina, V.; Balázsi, K.;
Czigány, Z.; Vašina, P. Effect of bonding structure on hardness and fracture resistance of WBC coatings with varying B/W ratio.Surf. Coat. Technol.2019,358, 843–849. [CrossRef]
26. Kroker, M.; Czigány, Z.; Weiss, Z.; Fekete, M.; Souˇcek, P.; Balázsi, K.; Sochora, V.; Jílek, M.; Vašina, P. On the origin of multilayered structure of WBC coatings prepared by non-reactive magnetron sputtering from a single segmented target.Surf. Coat. Technol.2019,377, 124864. [CrossRef]
27. Debnárová, S.; Zábransk `y, L.; Souˇcek, P.; Buršíková, V.; Vašina, P. Study of WBC thin films prepared by magnetron sputtering using a combinatorial approach. Int. J. Refract. Met. Hard Mater. 2019,85, 105066.
[CrossRef]
28. Mirzaei, S.; Alishahi, M.; Souˇcek, P.; Ženíšek, J.; Holec, D.; Koutná, N.; Buršíková, V.; Stupavská, M.;
Zábransk `y, L.; Burmeister, F.; et al. The effect of chemical composition on the structure, chemistry and mechanical properties of magnetron sputtered WBC coatings: Modeling and experiments. Surf. Coat. Technol.
2020,383, 125274. [CrossRef]
29. Lin, S.T.; Lee, C. Growth of tantalum boride films by RF magnetron sputtering effect of bias.J. Electrochem. Soc.
2003,150, G607–G611. [CrossRef]
30. Goncharov, A.; Ignatenko, P.; Petukhov, V.; Konovalov, V.; Volkova, G.; Stupak, V.; Glazunova, V.
Composition, structure, and properties of tantalum boride nanostructured films. Tech. Phys. 2006, 51, 1340–1343. [CrossRef]
31. Du, S.; Zhang, K.; Wen, M.; Qin, Y.; Li, R.; Jin, H.; Bao, X.; Ren, P.; Zheng, W. Optimizing the tribological behavior of tantalum carbide coating for the bearing in total hip joint replacement.Vacuum2018,150, 222–231.
[CrossRef]
32. Vargas, M.; Castillo, H.; Restrepo-Parra, E.; De La Cruz, W. Stoichiometry behavior of TaN, TaCN and TaC thin films produced by magnetron sputtering.Appl. Surf. Sci.2013,279, 7–12. [CrossRef]
33. Poladi, A.; Semnani, H.M.; Emadoddin, E.; Mahboubi, F.; Ghomi, H. Nanostructured TaC film deposited by reactive magnetron sputtering: Influence of gas concentration on structural, mechanical, wear and corrosion properties.Ceram. Int.2019,45, 8095–8107. [CrossRef]
34. Greene, J.E. Tracing the recorded history of thin-film sputter deposition: From the 1800s to 2017. J. Vac. Sci.
Technol. A Vac. Surf. Films2017,35, 05C204. [CrossRef]
35. Müller, C.M.; Sologubenko, A.S.; Gerstl, S.S.; Süess, M.J.; Courty, D.; Spolenak, R. Nanoscale Cu/Ta multilayer deposition by co-sputtering on a rotating substrate. Empirical model and experiment.
Surf. Coat. Technol.2016,302, 284–292. [CrossRef]
36. Eriksson, A.; Zhu, J.; Ghafoor, N.; Johansson, M.; Sjölen, J.; Jensen, J.; Odén, M.; Hultman, L.; Rosén, J.
Layer formation by resputtering in Ti–Si–C hard coatings during large scale cathodic arc deposition.
Surf. Coat. Technol.2011,205, 3923–3930. [CrossRef]
37. Hans, M.; to Baben, M.; Chen, Y.T.; Pradeep, K.G.; Holzapfel, D.M.; Primetzhofer, D.; Kurapov, D.; Ramm, J.;
Arndt, M.; Rudigier, H.; et al. Substrate rotation-induced chemical modulation in Ti–Al–ON coatings synthesized by cathodic arc in an industrial deposition plant. Surf. Coat. Technol. 2016,305, 249–253.
[CrossRef]
38. Voevodin, A.A.; Shtansky, D.V.; Levashov, E.A.; Moore, J.J. Nanostructured Thin Films and Nanodispersion Strengthened Coatings; Volume 155 of NATO Science Series II: Mathematics, Physics and Chemistry; Springer Science & Business Media: Dordrecht, The Netherlands, 2006.
39. Zhang, X.; Hilmas, G.E.; Fahrenholtz, W.G. Synthesis, densification, and mechanical properties of TaB2.
Mater. Lett.2008,62, 4251–4253. [CrossRef]
40. Scherrer, P. Bestimmung der grosse und der inneren struktur von kolloidterilchen mittels rontgestrahlen.
Nachrichten Von Der Ges. Der Wiss. Zu Göttingen Math. Phys. Kl.1918,1918, 98–100.
41. Oliver, W.; Pharr, G. Measurement of hardness and elastic modulus by instrumented indentation: Advances in understanding and refinements to methodology. J. Mater. Res.2004,19, 3–20. [CrossRef]
42. Stoney, G.G. The tension of metallic films deposited by electrolysis.Proc. R. Soc. Lond. Ser. A Contain. Pap. A Math. Phys. Character1909,82, 172–175. [CrossRef]
43. Janssen, G.C.; Abdalla, M.M.; van Keulen, F.; Pujada, B.R.; van Venrooy, B. Celebrating the 100th anniversary of the Stoney equation for film stress: Developments from polycrystalline steel strips to single crystal silicon wafers.Thin Solid Film.2009,517, 1858–1867. [CrossRef]
44. Baker, M. Advanced characterisation of nanocomposite coatings. Surf. Coat. Technol.2007,201, 6105–6111.
[CrossRef]
45. Petrov, I.; Barna, P.; Hultman, L.; Greene, J. Microstructural evolution during film growth.J. Vac. Sci. Technol.
A Vac. Surf. Films2003,21, S117–S128. [CrossRef]
46. Pei, Y.; Shaha, K.; Chen, C.; Van der Hulst, R.; Turkin, A.; Vainshtein, D.; De Hosson, J.T.M. Growth of nanocomposite films: From dynamic roughening to dynamic smoothening. Acta Mater.2009,57, 5156–5164.
[CrossRef]
47. Veprek, S.; Zhang, R.; Veprek-Heijman, M.; Sheng, S.; Argon, A. Superhard nanocomposites: Origin of hardness enhancement, properties and applications. Surf. Coat. Technol.2010,204, 1898–1906. [CrossRef]
48. Souˇcek, P.; Daniel, J.; Hnilica, J.; Bernátová, K.; Zábransk `y, L.; Buršíková, V.; Stupavská, M.; Vašina, P.
Superhard nanocomposite nc-TiC/aC: H coatings: The effect of HiPIMS on coating microstructure and mechanical properties.Surf. Coat. Technol.2017,311, 257–267. [CrossRef]
49. Storms, E.K.The Refractory Carbides; Refractory Materials 2; Academic Press: Cambridge, MA, USA, 1967.
50. Bakshi, S.R.; Musaramthota, V.; Lahiri, D.; Singh, V.; Seal, S.; Agarwal, A. Spark plasma sintered tantalum carbide: Effect of pressure and nano-boron carbide addition on microstructure and mechanical properties.
Mater. Sci. Eng. A2011,528, 1287–1295. [CrossRef]
51. Laszkiewicz-Łukasik, J.; Jaworska, L.; Putyra, P.; Klimczyk, P.; Garzeł, G. The influence of SPS heating rates on the synthesis reaction of tantalum diboride.Boletín De La Soc. Espa Nola De Cerámica Y Vidr.2016, 55, 159–168. [CrossRef]
52. Musil, J. Hard nanocomposite coatings: Thermal stability, oxidation resistance and toughness.
Surf. Coat. Technol.2012,207, 50–65. [CrossRef]
53. Hall, E.O. The deformation and ageing of mild steel: III Discussion of results. Proc. Phys. Soc. Sect. B1951, 64, 747–753. [CrossRef]
54. Petch, N.J. The cleavage strength of polycrystals. J. Iron Steel Inst.1953,174, 25–28.
55. Zábransk `y, L.; Buršíková, V.; Souˇcek, P.; Vašina, P.; Buršík, J. On the study of the mechanical properties of Mo–BC coatings.Eur. Phys. J. Appl. Phys.2016,75, 24716. [CrossRef]
56. Carlton, C.; Ferreira, P.J. What is behind the inverse Hall–Petch effect in nanocrystalline materials?Acta Mater.
2007,55, 3749–3756. [CrossRef]
57. Jacobsohn, L.; Nastasi, M. Sputter-deposited boron carbide films: Structural and mechanical characterization.
Surf. Coat. Technol.2005,200, 1472–1475. [CrossRef]
58. Wang, C.; Yang, Y.; Chung, Y.W.; Zhang, Y.; Ouyang, S.; Xiao, Z.; Song, K.; Li, P. Microstructure, hardness and toughness of boron carbide thin films deposited by pulse dc magnetron sputtering. Ceram. Int.2016, 42, 6342–6346. [CrossRef]
59. Gupta, B.; Bhushan, B. Micromechanical properties of amorphous carbon coatings deposited by different deposition techniques. Thin Solid Film.1995,270, 391–398. [CrossRef]
60. Mattox, D. Particle bombardment effects on thin-film deposition: A review. J. Vac. Sci. Technol. A Vac.
Surf. Films1989,7, 1105–1114. [CrossRef]
61. Ennos, A.E. Stresses developed in optical film coatings.Appl. Opt.1966,5, 51–61. [CrossRef]
62. Abadias, G.; Michel, A.; Tromas, C.; Jaouen, C.; Dub, S. Stress, interfacial effects and mechanical properties of nanoscale multilayered coatings.Surf. Coat. Technol.2007,202, 844–853. [CrossRef]
63. Soucek, P.; Zabransky, L.; Bursikova, V.; Bursik, J.; Debnarova, S.; Svoboda, M.; Perina, V.; Vasina, P. Fracture resistance enhancement in hard Mo–BC coatings tailored by composition and microstructure. J. Nanomater.
2018,2018, 5184584. [CrossRef]
© 2020 by the authors. Licensee MDPI, Basel, Switzerland. This article is an open access article distributed under the terms and conditions of the Creative Commons Attribution (CC BY) license (http://creativecommons.org/licenses/by/4.0/).