Edited by:
Claire Dumas, Institut National de la Recherche Agronomique (INRA), France Reviewed by:
Mohanakrishna Gunda, Qatar University, Qatar Qaisar Mahmood, COMSATS University, Islamabad Campus, Pakistan Laura Treu, University of Padova, Italy Stefano Campanaro, University of Padova, Italy
*Correspondence:
Kornél L. Kovács kovacs.kornel@bio.u-szeged.hu
Specialty section:
This article was submitted to Bioenergy and Biofuels, a section of the journal Frontiers in Energy Research Received:22 January 2019 Accepted:04 November 2019 Published:20 November 2019 Citation:
Ács N, Szuhaj M, Wirth R, Bagi Z, Maróti G, Rákhely G and Kovács KL (2019) Microbial Community Rearrangements in Power-to-Biomethane Reactors Employing Mesophilic Biogas Digestate. Front. Energy Res. 7:132.
doi: 10.3389/fenrg.2019.00132
Microbial Community Rearrangements in
Power-to-Biomethane Reactors Employing Mesophilic Biogas Digestate
Norbert Ács1, Márk Szuhaj1, Roland Wirth1, Zoltán Bagi1, Gergely Maróti2, Gábor Rákhely1,3and Kornél L. Kovács1,4*
1Department of Biotechnology, University of Szeged, Szeged, Hungary,2Biological Research Centre, Institute of Plant Biology, Szeged, Hungary,3Biological Research Centre, Institute of Biophysics, Szeged, Hungary,4Department of Oral Biology and Experimental Dental Research, University of Szeged, Szeged, Hungary
The biological conversion of hydrogen (H2) and carbon dioxide (CO2) to methane (CH4), is accomplished by the hydrogenotrophic methanogens (HM). HMs are difficult to cultivate in pure culture, but they are readily available in the mixed culture of effluents from the anaerobic degradation of organic matter, i.e., the fermentation effluent of biogas plants. The rate-limiting step in the work of CH4-forming microbial communities is the low solubility of H2 in the aqueous environment. In our approach, the simple fed-batch fermentation technique was selected to supply the gaseous substrates for the microbial community at laboratory scale and mesophilic temperature. Periodically withdrawn samples were analyzed for process parameters and the microbial communities were studied using Terminal Restriction Fragment Length Polymorphism (T-RFLP) of the mcrA gene and Ion Torrent whole metagenome DNA sequencing. The metagenome data were evaluated by both read-based and genome-centric bioinformatics tools. The rearrangements in the mixed microbial communities, triggered by switching the operating conditions to biological power-to-biomethane (bio-P2M), have been established. The production rates were 6.30 mL CH4 L−1 h−1 during the acclimation phase and 9.21 mL CH4 L−1 h−1 by the fully adapted community, respectively. The diversity of the anaerobic microbiota decreased as the bio-P2M process progressed. Feeding the community with H2 apparently promoted the abundance of several genera, in particularCandidatus CloacimonasandHerbinix. The diversity of theArchaeacommunity decreased considerably upon daily feeding with H2 and CO2. The predominantArchea genus was Methanobacterium in every reactor, Methanothrix persisted for the first 4 weeks, while the initially less abundant genusMethanoculleusgained advantage during the adaptation to the sustained bio-P2M process. The accumulation of acetate indicated a strong involvement of homoacetogenic bacteria.
Keywords: biological-power-to-methane, mcrA, T-RFLP, whole genome DNA sequencing, hydrogen, carbon dioxide, acetate
INTRODUCTION
There is a common understanding worldwide about the importance of renewable energy carriers (RECs) and the need for increasing their proportion in the portfolio of the global energy consumption. The rapidly spreading REC technologies comprise primarily wind, photovoltaic, biomass incineration, and hydropower; these approaches generate renewable electricity to be distributed by the power grid. Due to the inherently fluctuating nature of the most widely used wind and photovoltaic technologies, the stable operation of the grid is jeopardized as the fluctuations cannot be synchronized with electricity consumption. Eventually, this leads to the reduction of the overall efficiency and economic feasibility. Among the technical possibilities to overcome this drawback the so-called Power- to-Gas (P2G) concept has gained acceptance (Mazza et al., 2018). The scheme is based on using the excess renewable electricity for water electrolysis to produce oxygen (O2) and hydrogen (H2). H2 is the cleanest energy carrier, however, its widespread direct utilization is severely limited by the underdeveloped technological infrastructure in storage and transportation. Methane (CH4) is an obvious alternative, as it can equally be exploited as natural gas. The H2 from water electrolysis is used for biological or chemical conversion of CO2 to CH4, the process employing microbes for the CH4
conversion is called bio-power-to-methane (Angelidaki et al., 2018; Treu et al., 2018a; Nap et al., 2019) The CO2 to be reduced with H2 may originate from biogas, which contains 30–50% CO2 or exhaust gas of internal combustion engines.
Through coupling the excess REC electricity utilization with CO2
mitigation the economic and environmental value of bio-P2M improves (Lewandowska-Bernat, 2017).
The final steps of biogas formation in anaerobic digestion (AD) of organic matter is catalyzed by members of methanogenic archaea. Methanogens have been classified as methylotrophic, acetoclastic and hydrogenotrophic. Methylotrophic methanogens are known to use methyl compounds, such as methanol, dimethyl sulfide, trihalomethanes, chloromethanes, etc. Acetoclastic methanogens produce methane from acetate that is a major intermediate produced from anaerobic digestion of organic matter. Hydrogenotrophic methanogens use CO2 as an electron acceptor and H2 as an electron donor.
Hydrogenotrophic methanogens can produce bio-methane from a H2+CO2(4:1 molar ratio) (Kougias et al., 2017a). Our previous results suggested that moderatein situincrease of the H2supply in the reactors by bioaugmentation resulted in elevated CH4yields (Bagi et al., 2007; Kovács et al., 2013; Nzila, 2017).
The suitability of the biogas reactor effluent, i.e., the digestate, to carry out the bio-P2M conversion has been demonstrated.
With the help of microbes inhabiting the biogas producing community, the process can be effectively carried out (Bassani et al., 2015; Szuhaj et al., 2016; Treu et al., 2018a). The AD digestate microbial community offers the possibility of using a catalyst that is practically free of charge and can be replenished continuously. The exploitation of these benefits and maintaining a stable operation of the community in the bio-P2M reactor, however, requires a thorough knowledge of the members of the
complex microbial community and their role in the process in order to avoid malfunctions.
In this paper we therefore examine the microbial background of the biological bio-P2M process by following the rearrangements in the composition of a biogas producing microbial community originated from an industrial biogas plant.
This knowledge may lead to the design of reproducible and sustainable microbial systems and extensive management of the bio-P2M technology.
MATERIALS AND METHODS Fermentation Conditions
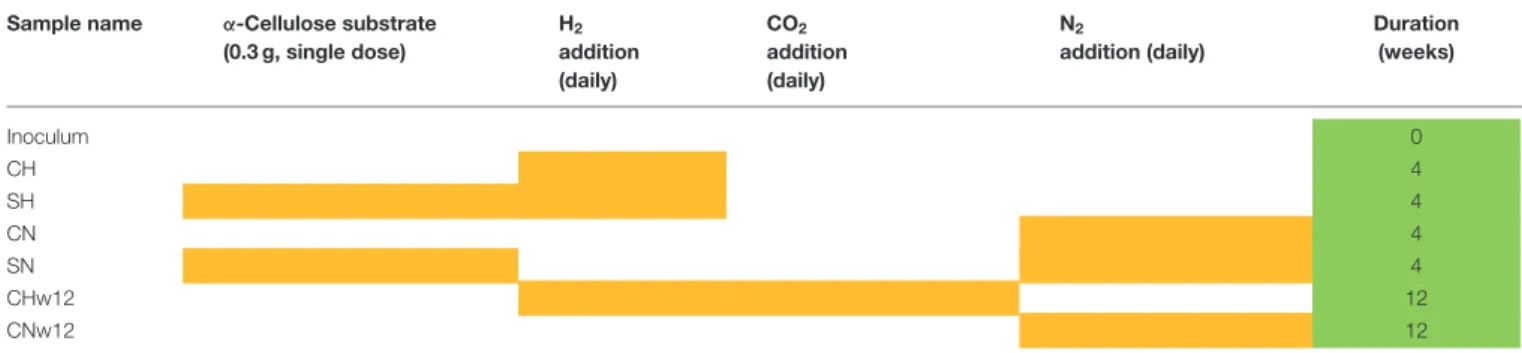
Batch fermentations were carried out in serum bottle reactors with 160 mL working volume in triplicates. Each reactor contained 40 mL inoculum from the effluent of an industrial mesophilic biogas plant (Zöldforrás Ltd., Szeged). The biogas facility operates with a substrate mix of pig manure and plant silage (maize and sweet sorghum) in a ratio of 20:80 based on their total organic solid content. The fresh inoculum was filtered upon arrival to exclude solid particles (>0.2 mm) and was kept at 37◦C for 10 days to diminish its residual biogas potential. Substrate (0.3 g,α-cellulose: C8002, Sigma) was added to reactors SH and SN (Table 1) in a single dose at the start of the experiment. Aluminum crimps and butyl septa were used for airtight sealing and the headspace was flushed with pure nitrogen gas to establish anaerobic condition. The headspace of the reactors CH, SH, and CHw12 received 0.81±0.16 mmol H2every day. 0.20±0.11 mmol CO2was also dosed to sample CHw12 after signs of CO2depletion, i.e., day 27–28 (Szuhaj et al., 2016). Controls (CN, SN, CNw12) received an equal volume of N2daily.Table 1indicates the gas and substrate composition of the reactors used in this study and the composition of the samples used for T-RFLP and metagenome sequencing, i.e., the inoculum, the samples supplied with H2 only (CH) or H2 and substrate (SH) and their corresponding controls, which received N2 in their head space during the daily gas replacement (CN and SN).
The samples for metagenome sequencing were withdrawn on day 28 of the experiment, based upon the fermenters undisturbed behavior at that point, the long term experiments (CNw12 and CHw12) were sampled on day 84. The reactors were incubated in a rotary shaker at 37◦C and 160 rpm. The evolved CH4
and consumed H2was determined by gas chromatography (GC) every day. The measured values were normalized employing the ideal gas law at normal temperature of 273 K and normal atmospheric pressure of 1,013 mbar. After the GC measurement, the gas phase was replaced with N2, using a manifold, and the pressure was adjusted to atmospheric level. This was followed by the injection of the pure H2 (+CO2 in case of CHw12) gas to the selected reactors using sterile disposable syringes and needles.
This created an overpressure of about 1.23 bar, which gradually diminished as the gases were converted to CH4.
Gas Composition Analysis
The gas composition of the headspace was analyzed by an Agilent 6890N GC (Agilent Technologies) equipped with an HP Molsieve 5 Å (30 m×0.53 mm×25µm) column and a TCD detector. The
TABLE 1 |Compositions of the reactors (yellow cells) and samples taken for T-RFLP and metagenome sequencing (green cells).
Sample name α-Cellulose substrate (0.3 g, single dose)
H2
addition (daily)
CO2
addition (daily)
N2
addition (daily)
Duration (weeks)
Inoculum 0
CH 4
SH 4
CN 4
SN 4
CHw12 12
CNw12 12
injector temperature was 150◦C, the measurement was made in splitless mode. The column was maintained at 60◦C, the carrier gas was argon HQ 5.0 (Linde) with a flow rate of 16.8 mL min−1. Three biological replicates were used for the measurements.
HPLC Analysis
Weekly withdrawn samples from the liquid phase of the reactors were used to determine the concentrations of volatile fatty acids.
Briefly, the samples were centrifuged at 13,000 rpm for 10 min, and the supernatant was filtered using a PES ultracentrifuge filter at 14,000 rpm for 20 min. The supernatant sample was injected into an HPLC (Hitachi LaChrome Elite) equipped with refractive index detector (L-2490). The separation was performed on an ICSep ICE-COREGEL-64H column. The temperature of the column and detector were 50 and 41◦C, respectively. The eluent was 0.01 M H2SO4(flow rate: 0.8 mL min−1). The method employed detected C2–C6 volatile fatty acids and the n- and iso-forms of C3–C6.
Other Analytical Parameters
The dry matter content was quantified by drying the biomass at 105◦C overnight and weighing the residual material. Additional heating at 550◦C gave the organic dry matter (oDM) content (Ács et al., 2015). pH was determined with a Radelkis OP-211/2 device equipped with an OP-0808P pH electrode.
VOA/TIC (Volatile organic acids/Total inorganic carbon) ratio was calculated with the use of a Pronova FOS/TAC 2000 Version 812-09.2008 automatic titrator.
The Metagenomic Sampling
A total of seven samples were investigated via IonTorrent whole genome sequencing and T-RFLP fingerprinting, which are compiled inTable 1.
Two additional sets of reactors were included in the metagenomic studies to better understand the long-term alterations in the microbial communities. The reactors, marked as CHw12 and CNw12 were run for 12 weeks similarly to an earlier long-term experimental arrangement (Szuhaj et al., 2016).
The counterpart SHw12 and SNw12 fermentations were not included in the metagenomic analysis as the organic substrate was supplied only once at the start of the fermentations. This substrate was utilized during the first 14–16 days (Figure 1),
FIGURE 1 |Methane production in the batch reactors. Batch reactors were operated as described in Materials and Methods. The compositions of the reactors were: CN=biogas effluent, daily headspace replacement with nitrogen, CH=biogas effluent, daily headspace replacement with H2, SN and SH=same as CN and CH, respectively, but supplied withα-cellulose substrate at the start. The long-term experiments were repetitions of the ones published inSzuhaj et al. (2016), that is why they are not reproduced here. The experimental errors of the triplicate samples are shown with the size of the symbols.
after that period these reactors behaved as CNw12 and CHw12, respectively.
DNA Extraction
Whole genomic DNA was isolated from the pellet of 1.5 mL sample centrifuged at 13,000 rpm for 10 min. The CTAB (cetyl trimethylammonium bromide) based method was used as described previously (Ács et al., 2015). The separately isolated DNA samples from the parallel reactors were pooled together in an equal proportion to reach a final amount of 1µg. These samples were used in the subsequent T-RFLP and metagenomic community analysis.
Terminal Restriction Fragment Length Polymorphism
PCR amplification (both in case of the community and the individual clones) and sequencing was conducted as described (Ács et al., 2013). Samples from biological replicates were pooled
for sequencing. The primer pair mcrA-F and mcrA-R (Luton et al., 2002) were used to detect the response of the methanogenic archaea to the H2addition with or without the organic substrate.
The restriction endonucleases MboI and BstNI were used.
Ion Torrent Next Generation Sequencing and Data Evaluation
Sequencing
The genomic DNA samples were sequenced using IonTorrent PGM platform (Life Technologies, Thermo Scientific) according to the recommendations of the manufacturer. Fragment libraries were generated from the samples using Ion Xpress Plus Fragment Library Kit, Ion Shear Plus Reagents Kit was implemented for adapter ligation and nick translation. Platinum PCR SuperMix, ION Library TaqMan qPCR and Ion PGM 200 Xpress template kits were used for library amplification, quantification and for the emulsion PCR, respectively. Sequencing was performed on Ion 318 chips, generating 246,000–367,000 high quality reads per sample with an average read length of 215 ± 86 bp and good completeness of the rarefaction curves (Supplementary Figure 2).
Raw Sequence Filtering
Galaxy Europe server was employed to pre-process the raw sequences (https://usegalaxy.eu). Low-quality reads were filtered by Prinseq (min. length: 150; min. score: 15; quality score threshold to trim positions: 20; sliding window used to calculated quality score: 1) (Schmieder and Edwards, 2011). Quality of raw and filtered sequences were checked with FastQC program. The key quality parameters were as follows: node count 2,638, total length 12,027,501 bp, N50 4,947 bp, shortest node 2,000 bp.
Read-Based Metagenomics
Filtered high quality sequences were further analyzed by Diamond software, applying LCA (Lowest Common Ancestor) algorithm (Buchfink et al., 2014). Diamond parameters were set as follows: Blast Mode: BlastX, Reference database: NCBI nr database. MEGAN6 was used to add taxon names to Diamond sequence classifications (Min Score: 80, Min support percent:
80, Min support: 15, Min complexity filter: 0.3, LCA algorithm:
weighted) (Huson et al., 2016).
Genome-Based Evaluation of the Sequencing Data Filtered sequences produced by Prinseq were co-assembled using Megahit (Minimum contig length: 1,000 bp, Minimum k-mer size: 21, Maximum k-mer size 141) (D. Li et al., 2015). After simplifying the header of contig FASTA file, using the Anvi’o script, Bowtie2 was employed to map back the original sequences to the contigs (Langmead and Salzberg, 2012). Then we used Anvi’o V5 following the “metagenomics” workflow (Eren et al., 2015). Briefly, during the first step contig database was generated, where open reading frames were identified by Prodigal and each contig k-mer frequencies were computed. Hidden Markov Modell (HMM) of single-copy genes were aligned by HMMER (Finn et al., 2011; Campbell et al., 2013; Rinke et al., 2013; Simão et al., 2015). We used InterProScan v5.31-70 and the metagenome classifier Kaiju for functional and taxonomic annotation of
contigs (Finn et al., 2014; Jones et al., 2014; Menzel et al., 2016; Agarwala et al., 2018). The outputs were imported into the contig database. BAM files made by Bowtie2 were used to profile contig database, this way sample-specific information was generated for the contigs (i.e., mean coverage). Three automated binning programs, namely CONCOCT, METABAT2, and MAXBIN2 were employed to reconstruct microbial genomes from the contigs (Minimum length: 2000) (Alneberg et al., 2013;
Kang et al., 2015; Wu et al., 2016). We also used the Anvi’o human-guided binning and “anvi-refine” options (Delmont and Eren, 2018). The binning results were incorporated to the contig database.
RESULTS
Biomethane Production, Hydrogen Utilization, and Analytical Parameters
Five-weeks long experiments were conducted in order to reach the exhaustion of the CO2 from the system. After start-up, the reactors showed increasing methane production. The control reactors (CN) produced 46.1±1.4 mL (1.81±0.05 mmol) CH4, this could be accounted for the residual biogas potential present in the inoculum. The samples containing addedα-cellulose (SN) produced 168.45±3.73 mL (6.62±0.15 mmol) CH4(Figure 1), i.e., nearly 100% conversation was achieved based upon the theoretical methane yield of the substrate (4.81 mmol,Table 2).
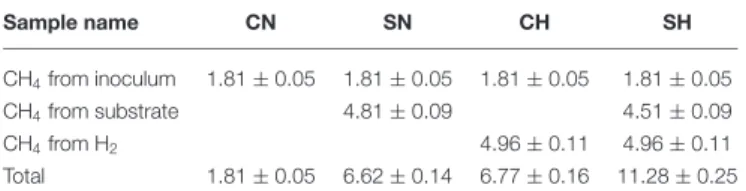
The distinct kinetics of the SN (fed withα-cellulose) and CH (fed with H2 +CO2) samples, indicates that H2dissolution is more limiting than substrate degradation, although the total CH4 production was the same in this particular case.Table 2shows the predicted origin of methane produced in the reactors.
Analytical parameters (TS, oTS, VOA/TIC, pH, NH+4) were measured at the beginning and at the conclusion of each fermentation. Initial TS and oTS were 5.82 and 74%, respectively. After digestion these values dropped slightly to 5.41 and 71%. The VOA/TIC ratio remained below 0.2 and the ammonium ion concentrations were below 4 g L−1throughout the experiments (data not shown). Due to the CO2consumption and the daily flushing of the head spaces with N2, a strong shift from an initial value of pH 7.4 to around pH 8.5–9.4 was observed. This could have been compensated with CO2
addition as demonstrated by Szuhaj et al. (2016) and others (Alimahmoodi and Mulligan, 2008; Salomoni et al., 2011; Lee et al., 2012; Garcia-Robledo et al., 2016).
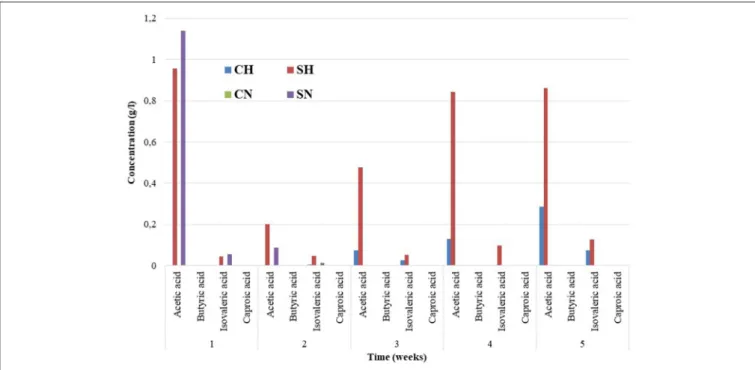
The accumulation of organic acids was measured every week (Figure 2). The inoculum contained organic acids below the detection limit. A pronounced increase in the acetic acid and isovaleric acid contents was apparent after the first
TABLE 2 |Source of the produced methane (mmol).
Sample name CN SN CH SH
CH4from inoculum 1.81±0.05 1.81±0.05 1.81±0.05 1.81±0.05
CH4from substrate 4.81±0.09 4.51±0.09
CH4from H2 4.96±0.11 4.96±0.11
Total 1.81±0.05 6.62±0.14 6.77±0.16 11.28±0.25
FIGURE 2 |Organic acid levels determined weekly in the reactors. The compositions of the reactors were as inFigure 1. The triplicate samples were pooled for the HPLC measurements. The long-term experiments were repetitions of the ones published inSzuhaj et al. (2016), that is why they are not reproduced here.
week in samples supplied initially with α-cellulose (SN and SH), which could be due to the rapid decomposition of the organic substrate and sluggish acetoclastic methanogenesis (Agneessens et al., 2018). The situation changed rapidly as the experiment continued and methanogens increased their activity and relative abundances. In the samples fed with H2 a gradual accumulation of VFAs was observed in time. We assume that the alternative biochemical pathway, i.e., homoacetogenesis could be responsible for this observation (Sun et al., 2013; Angelidaki et al., 2018; Treu et al., 2018b).
T-RFLP Analysis of Archaeal mcrA Gene
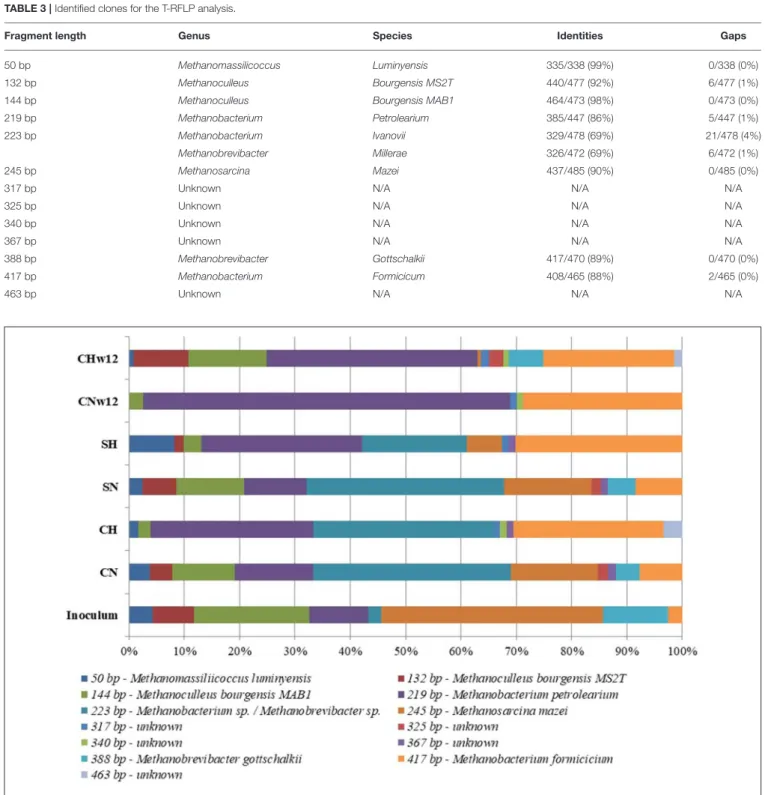
In the T-RFLP of methanogens the primers primers designed for the gene coding for the large subunit of methyl-coenzyme M reductase (mcrA)were used. A total of 13 terminal restriction fragments (T-RFs) were generated, eight of which were reliably identified at genus level (Table 3). The remainders were apparently not detectable in the inoculum, which was used for the clone library preparation. The patterns of the samples were distinct and the shift in the microbial community was clearly visible (Figure 3). The genusMethanosarcinapre-dominated the inoculum, followed by Methanoculleusof around 40 and 28%
relative abundances, respectively. The generaMethanobacterium and Methanobrevibacter were equally distributed in the inoculum sample (12%) followed by Methanomassiliicoccus and an unknown taxon. The methanogenic composition of samples CN and SN resembled that of the inoculum, although the proportions (especially the fragment at 223 bp, which we were not able to identify with full certainty, and at 254 bp—Methanosarcina mazei) were different, which is possibly
due to the substrate change. In the T-RFLP pattern of CH, the predominance of the genus Methanobacterium at the expenses of the genera Methanosarcina and Methanoculleus was evident. The pattern of SH resembled that of CH. In this case three putative species of the genus Methanobacterium represented more than 78% of the community (Barret et al., 2013; Wintsche et al., 2016; Liu et al., 2018).
The diversity of sample CNw12 was strikingly low.
Methanobacterium species were the most abundant archaea in this sample, which predominated the Archaea community from the early phase of the experiments. It is worth noting that the diversity in sample CHw12 was more pronounced than that of CNw12, containing five T-RFs of uncultured methanogens.
Four of these were present in sample CH in comparable amounts.
Apparently, the continuous H2 and CO2 input selected for a stable community capable of sustainable CH4production. This was in line with the previous observations (Szuhaj et al., 2016).
Alterations of the Microbiome Followed by Whole Metagenome Sequencing
The major taxonomical differences among the samples taken from the reactors subjected to various treatments (Table 1) were identified.
Clustering of the Metagenomes
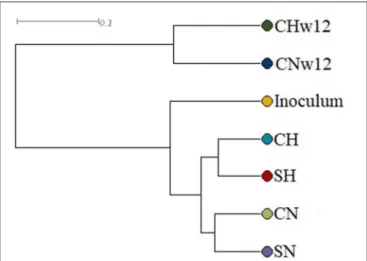
For the grouping of samples, UPGMA (Unweighted Pair Group Method with Arithmetic Mean) was used, which refers to the entire microbial communities and indicates an average connection model. Figure 4 shows that the microbial communities developed into well-separated lineages. The
TABLE 3 |Identified clones for the T-RFLP analysis.
Fragment length Genus Species Identities Gaps
50 bp Methanomassilicoccus Luminyensis 335/338 (99%) 0/338 (0%)
132 bp Methanoculleus Bourgensis MS2T 440/477 (92%) 6/477 (1%)
144 bp Methanoculleus Bourgensis MAB1 464/473 (98%) 0/473 (0%)
219 bp Methanobacterium Petrolearium 385/447 (86%) 5/447 (1%)
223 bp Methanobacterium Ivanovii 329/478 (69%) 21/478 (4%)
Methanobrevibacter Millerae 326/472 (69%) 6/472 (1%)
245 bp Methanosarcina Mazei 437/485 (90%) 0/485 (0%)
317 bp Unknown N/A N/A N/A
325 bp Unknown N/A N/A N/A
340 bp Unknown N/A N/A N/A
367 bp Unknown N/A N/A N/A
388 bp Methanobrevibacter Gottschalkii 417/470 (89%) 0/470 (0%)
417 bp Methanobacterium Formicicum 408/465 (88%) 2/465 (0%)
463 bp Unknown N/A N/A N/A
FIGURE 3 |Distribution of restriction patterns. Inoculum=biogas reactor effluent. The composition of the reactors were: CN=biogas effluent, daily headspace replacement with N2, CH=biogas effluent, daily headspace replacement with H2, SN and SH=same as CN and CH but supplied withα-cellulose substrate at the start. CNw12=biogas effluent, daily headspace replacement with N2for 12 weeks, CHw12 biogas effluent, daily headspace replacement with H2+CO2for 12 weeks.
microbiota of the initial inoculum, originating from a biogas facility fed with silage and pig slurry, underwent a substantial rearrangement upon receiving daily supply of H2or N2. An even more marked distinction can be observed between the microbiota
of the bio-P2M reactors run for 4 and 12 weeks, respectively.
The principal component analysis (Supplementary Figure 1) corroborated these conclusions, although in this test the CH, SH, and SN microbiomes mapped together and separated from CN.
The Bio-P2M Communities According to Read-Based Metagenome Analyses
Two general approaches were applied during the assessment of the taxonomical differences. On one hand, the abundances of the samples were compared to the inoculum at various taxonomic levels (pie diagrams presented in Figure 6 and Supplementary Figure 3). On the other hand, the differential shifts in community composition were visualized relative to the corresponding control reactor as reference (Figures 5, 7 and Supplementary Figure 4), i.e., the percentile differences between the N2-fed controls and their bio-P2M pairs, which received the H2 +CO2stoichiometric gas mixture daily and, in the case of samples plotted in the red columns, a single dosage ofα-cellulose at the start of the experiment. Hence, the horizontal columns may extend in either positive or negative directions. The taxa on the Y axes of these figures are arranged from top to down following their relative abundance in the inoculum.
FIGURE 4 |UPGMA grouping of the samples. The compositions of the reactors were as inFigure 3.
Bacterial community
At phylum level only a few pronounced differences were observed among the fermenters subjected to different treatments (Supplementary Figure 3). Not surprisingly the long-term fermenters had the most distorted and least diverse communities compared to the inoculum.
In an attempt to visualize the microbial rearrangements as a result of H2 (Sample CH) or substrate + H2 (sample SH) addition, we plotted the differences relative to the corresponding controls, i.e., CN and SN, respectively (Supplementary Figure 4).
A relative expansion of Firmicutes could be noted at the expense of most other phyla. Their relative abundances did not change very much during the first 4 weeks of the operation of the bio-P2M reactors (59 ± 4%), but raised to 80 ± 1%
upon sustained H2 +CO2 feeding (Supplementary Figure 3).
The abundances of the phyla Spirochaetes, Planctomycetes, Synergistetes, and Fibrobacteres decreased in the CH samples but elevated in the CHw12 reactors, relative to their respective controls (Supplementary Figure 4). Although, these represented only a small part of the overall community (2–4%) in case of the short-term samples, and a more distinctive portion (10–
13%) in the long-term samples (Supplementary Figure 3), their response to H2(and the subsequent CO2) addition is noteworthy and warrant further investigation. The most outstanding changes took place in the candidate phylum Cloacimonetes. Although they also represented a small fraction within the communities (≤3%) (Supplementary Figure 3), their response to H2addition was very pronounced (Supplementary Figure 4). Their overall share decreased in the long-term bio-P2M experiments, but their relative abundance increased 15-fold in the CHw12 reactor relative to its CNw12 control.
A comprehensive list of the genera identified in the inoculum and the percentile changes in their relative abundances in the various samples are compiled inSupplementary Table 1A.
18 of these genera exceeded the threshold value of 1.0%
abundance in the inoculum. They encompassed 72–77% of the
FIGURE 5 |Percentile changes of Bacteria relative abundances at genus level. The 18 genera, which were detected in>1% abundance. The changes between the reactors supplied with daily H2dose and their counterparts, flushed with N2, are compared.(A)Light blue=CH-CN,(B)Red=SH-SN, and(C)Dark blue= CHw12-CNw12, respectively.
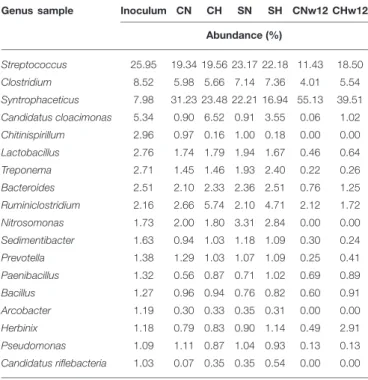
whole community. We focused our attention on this segment of the communities and their rearrangements under various operational conditions (Table 4).
Streptococcus species occurred frequently in all fermenters, their abundance, relative to the N2-supplied controls changed substantially only in the long-term bio-P2M experiment (Figure 5). Likewise, the genusClostridium, a well-known taxon of the microbiota in biogas reactors, were the second most abundant with increasing representation in the reactors running at balanced H2+CO2addition for an extended period of time.
The less abundant generaLactobacillus,Treponema,Bacteroides, Prevotella,Bacillus, and particularlyHerbinixbehaved similarly.
Long-term supply with H2 + CO2 apparently promoted the survival of these genera although they are not known to be able to metabolize these substrates except for some strains of the generaLactobacillusand Bacillus(Koeck et al., 2014; Bohn et al., 2017). It is more likely that members of these genera survived by utilizing the biomass of the deceased other bacteria in the inoculum digestate. The opposite trend can be seen in the case of the genera Syntrophaceticus,Ruminoclostridium, Sedimentibacter, and Candidatus Riflebacteria. Others, like the genera Paenibacillus, Arcobacter, or Pseudomonas did not alter their representation as a result of H2 + CO2
feeding, consequently they may play negligible role in the bio-P2M conversion (Figure 5). The most pronounced change in abundance as a result of H2-feeding was shown by the genus Candidatus Cloacimonas, which displayed a truly extraordinary abundance increase, relative to the controls containing N2 in
TABLE 4 |Abundances of the eighteen major genera in the samples expressed as % of the total bacterial abundance.
Genus sample Inoculum CN CH SN SH CNw12 CHw12 Abundance (%)
Streptococcus 25.95 19.34 19.56 23.17 22.18 11.43 18.50
Clostridium 8.52 5.98 5.66 7.14 7.36 4.01 5.54
Syntrophaceticus 7.98 31.23 23.48 22.21 16.94 55.13 39.51 Candidatus cloacimonas 5.34 0.90 6.52 0.91 3.55 0.06 1.02 Chitinispirillum 2.96 0.97 0.16 1.00 0.18 0.00 0.00
Lactobacillus 2.76 1.74 1.79 1.94 1.67 0.46 0.64
Treponema 2.71 1.45 1.46 1.93 2.40 0.22 0.26
Bacteroides 2.51 2.10 2.33 2.36 2.51 0.76 1.25
Ruminiclostridium 2.16 2.66 5.74 2.10 4.71 2.12 1.72
Nitrosomonas 1.73 2.00 1.80 3.31 2.84 0.00 0.00
Sedimentibacter 1.63 0.94 1.03 1.18 1.09 0.30 0.24
Prevotella 1.38 1.29 1.03 1.07 1.09 0.25 0.41
Paenibacillus 1.32 0.56 0.87 0.71 1.02 0.69 0.89
Bacillus 1.27 0.96 0.94 0.76 0.82 0.60 0.91
Arcobacter 1.19 0.30 0.33 0.35 0.31 0.00 0.00
Herbinix 1.18 0.79 0.83 0.90 1.14 0.49 2.91
Pseudomonas 1.09 1.11 0.87 1.04 0.93 0.13 0.13
Candidatus riflebacteria 1.03 0.07 0.35 0.35 0.54 0.00 0.00 6Abundance (%) 72.71 74.38 74.76 72.42 71.26 76.66 73.95
their headspace, both in our short term (7-fold seeFigure 5A) or long term (17-fold seeFigure 5C) bio-P2M experiments. Similar response was seen in the samples receivingα-cellulose substrate in addition to the gasesFigure 5BandSupplementary Table 1B) indicating that the effect was primarily due to the addition of H2. It is noteworthy, that their overall abundance decreased in time, i.e., from 5.34% in the inoculum to 1.02% in CHw12 and 0.06% in CNw12 (Supplementary Tables 1A,B), nevertheless their response to the sole addition of H2 +CO2really deserves further attention (see Discussion).
Archaeal community
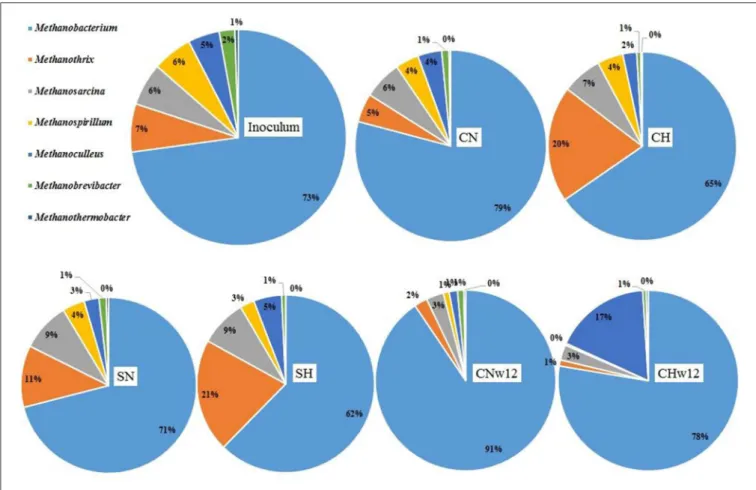
The representation of Archaea was low, ranging from 5.98 to 12.35% in the microbiome compared to Bacteria (88.91–
94.01%). TheArchaeacontent of the inoculum (9.28%) is typical for the mesophilic CSTR biogas communities (Pyzik et al., 2018). The overall representation of Archaea did not change considerable in our reactors except for a substantial loss in the long-term reactors supplied with N2(CNw12=5.98%) relative to the H2 + CO2-fed ones (CHw12 = 11.09%). Within this Archaeacommunity 7 genera had relative abundance≥0.5%. The distribution of these genera is presented in Figure 6. The pie chart is arranged similarly as in case of theBacteria. A closer inspection on archaeal genera, compared to that of the inoculum (Supplementary Table 1C), revealed an overall decrease in the diversity. The genusMethanobacterium predominated the archaeal community in all reactors as well as in the inoculum, comprising 62–91% of allArchaea(Figure 6). In the long-term sample (CHw12) they encompassed the Archaea community almost exclusively. Their prevalence decreased considerably in CHw12 where the genusMethanoculleus emerged in abundance (Supplementary Table 1C).
When the three fermentations receiving daily H2 (and in one case CO2) dosage (CH, SH, CHw12) were compared pairwise with their relevant controls, supplied with N2 daily, an interesting picture emerged (Figure 7). The second most abundant genus in the inoculum, Methanothrix responded strongly to H2 addition (Figure 7A) in the first part of the experiment with or without initial dosage of α-cellulose (Figures 7A,B), but the effect diminished in time (Figure 7C).
Similarly toMethanobacterium, the generaMethanosarcinaand Methanothermobacter did not change in their abundance much upon H2 (and CO2) injection in the headspace (Supplementary Table 1C). The hydrogenotrophic genera MethanospirillumandMethanobrevibacterapparently could not successfully sustain their life for an extended period of time when supplied with H2 +CO2. Contrary to all majorArchaea genera,Methanoculleuseffectively took advantage of long-term feeding solely with H2+CO2and increased its abundance more than 11-fold (Figure 7C) relative to its control CNw12.
The Genome-Centric Bio-P2M Microbiomes
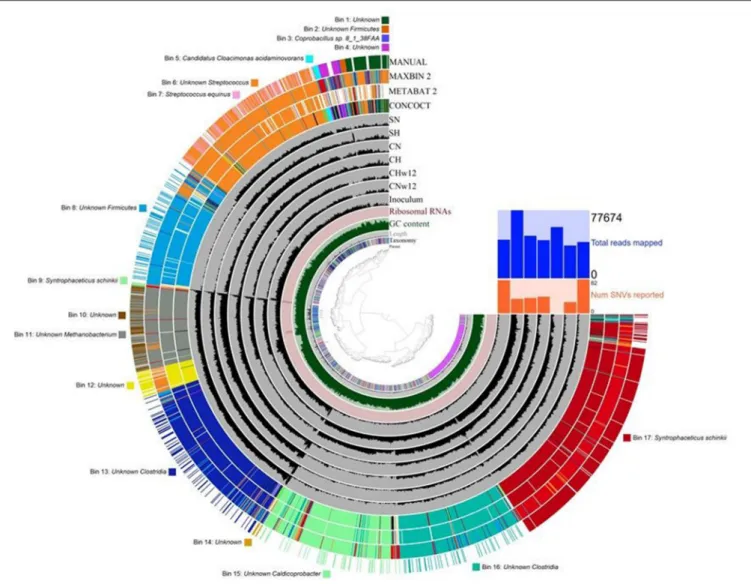
The sequencing data used above for read-based evaluation were subjected to genome-based analyses as well. Three automatic binning programs and Anvi’o human-guided binning option were tested (Figure 8). The bins obtained with these programs were basically similar with a few interesting features. 17
FIGURE 6 |Relative abundances of the Archaea genera. The compositions of the reactors were as inFigure 3.
FIGURE 7 |Percentile changes of Archaea relative abundances at genus level. The changes between the reactors supplied with daily H2dose and their counterparts, flushed with nitrogen, are compared.(A)Light blue=CH-CN,(B)Red=SH-SN, and(C)Dark blue=CHw12-CNw12, respectively.
bins were constructed using the human-guided automated binning programs that rely on co-abundance of sequences as well as compositional information, such as GC content, tetranucleotide frequencies and identification of single-copy genes. Some of the bins had insufficient content at deep taxonomic resolution, e.g., Bins 1, 4, 10, 12, 14 (Figure 8).
Others allowed the classification at phylum level, Bins 2 and 8 were linked to the phylum Firmicutes. In certain bins, a closer look allowed the recognition of the class Clostridia within Firmicutes (Bins 13 and 16). More interesting bins revealed their content at deeper taxonomic levels, such as the bacterial genera Streptococcus (Bin 6), Caldicoprobacter
FIGURE 8 |Results of the genome-based evaluation (binning) of sequencing data. The dendogram in the center displays the hierarchical clustering of contigs based on their sequence compositions. The layers from inside out are as follows: (1) The parent layer marks the splits originated from the same contigs with gray bars. (2) The Kaiju taxonomic layer shows the taxonomy for each open reading frame detected in a given split. (3) The length layer indicates the actual length of a given split. (4) GC-content layer. (5) Ribosomal RNA layer. (6) Gray layers represent every sample and each black bar is the coverage of a given split in a given sample. (7) Colored layers: CONCOCT, MAXBIN 2, METABAT 2 display the results of these automated binning methods, respectively, and the MANUAL layer indicates the manual refinement of the automated binning results. The bins and the corresponding taxa are listed around the figure. The compositions of the reactors were as inFigure 3.
(Bin 15), and the methanogenic archaeal Bin 11 belonging to the genusMethanobacterium. Finally, the completion and low redundancy of certain bins made the identification available at species level, such as Bins 3, 5, 7, 9, and 17. In these cases the taxonomic resolutions were apparently better than that of the read-based evaluation (see section Bacterial Community) of the same sequencing data. Coprobacillus sp. 8_1_38FAA (Bin 3),Streptococcus equinus(Bin 7),Syntrophaceticus schinkii(Bins 9 and 17), and Candidatus Cloacimonas acidaminovorans(Bin 5) were clearly identified. The binning software constructed two separate bins containing S. schinkii, which may point to the presence of two separate subpopulations of this strain in the bio-P2M communities. The detailed summary of gene calls obtained in the genome-centric evaluation is compiled in Supplementary Table 2.
Discussion
The Response of the Bacterial and Archaeal Community to Bio-P2M Conditions
The feasibility of bio-P2M has been substantiated by several previous studies employing pure or enriched microbial communities (Martin et al., 2013; Bassani et al., 2015; Kougias et al., 2017b; Mulat et al., 2017; Rachbauer et al., 2017; Angelidaki et al., 2018; Aryal et al., 2018) and digestate (Szuhaj et al., 2016). In this study we have analyzed the adaptation of the microbial community of a mesophilic biogas plant effluent to become efficient catalyst of the bio-P2M process, i.e., to convert
“excess green electricity” to bio-methane that is storable and transportable via the natural gas pipelines. The alterations of the “catalyst” microbial community during the first 4 weeks and sustained bio-P2M operation were followed in fed-batch
reactors receiving a daily dosage of H2 + CO2. Controls received N2 gas. Significant and characteristic changes took place under the bio-P2M condition, which may contribute to the understanding of the microbial events and the ways to test, manage and control the complex microbial community for efficient function.
Members of the kingdom Bacteria were not expected to directly participate in the bio-P2M conversion. Nevertheless, they responded to the changing conditions. This could be due partly to starvation and partly to the successful interaction of some members of the Bacteria community with potential methanogenicArchaeapartners.
The predominant genera in the inoculum were fairly well- preserved in the samples supplied daily with H2 (+CO2 in one case) or N2 for various lengths of time, irrespective of supplementing the communities with an initial cellulosic substrate or not. The general bacterial community structure of the inoculum showed a high degree of similarity to other studies conducted from similar starting materials (Wirth et al., 2012; Stolze et al., 2015). The predominance of the phyla Firmicutes, Proteobacteria, and Bacteroidetes was apparent in previous investigations (Wirth et al., 2015; Rachbauer et al., 2017), similarly to the present study (Supplementary Figure 3).
The general spread ofFirmicutescould be seen at the expense of other phyla. This is not surprising since this phylum is the most common one in biogas fermenters, thanks to a great number of diverse representatives of the orders Bacillales and Clostridiales, capable of catalyzing various biochemical reactions, thus facilitating the easy adaptation to various environments (Aryal et al., 2018; Buettner and Noll, 2018; Treu et al., 2018a) Nevertheless, the selection for the phylum Synergistetes upon long-term exposure to H2 + CO2 is remarkable. Synergistetes have been implicated in syntrophic acetate oxidation (Hattori, 2008; Müller et al., 2013; Westerholm et al., 2016) whereas acetate accumulation took place in the bio-P2M reactors both in relatively short-term (Figure 2) and long-term (Szuhaj et al., 2016) operation suggesting the shift of equilibrium toward homoacetogenesis.
As we refined the search to genus level,Streptococcusemerged being the predominant genus with around 11–25% share in the community (Table 4). They likely originated from the ensilaged substrate used at the biogas plant providing the inoculum (McDonald, 1982; Kampmann et al., 2014; Bohn et al., 2017).
The genera Clostridium, Syntrophaceticus, and Candidatus Cloacimonas were among the frequent taxa. H2 facilitated the prevalence of Candidatus Cloacimonas acidaminovorans up to 17-fold relative to the N2-fed controls (Figure 5).
This candidate strain was reconstructed and thoroughly characterized via metagenomics sequencing and metaproteome analysis (Pelletier et al., 2008). It is assumed to be involved in syntrophic oxidation of propionate (Li et al., 2014) and contains a full set of genes coding for at least one “Fe-only hydrogenase” (Pelletier et al., 2008). This “Fe-only hydrogenase,”
encoded by the hymABC structural and the hydEFGaccessory genes, is in fact probably a [FeFe]-hydrogenase (Degli Esposti et al., 2016), which is frequently found in anaerobic prokaryotes. “Fe-only hydrogenase” was detected so far only
in Archaea (Lubitz et al., 2014) and is intimately linked to methanogenesis. [FeFe]-hydrogenases typically function in vivo in the H2 evolution direction, which is not required in the bio-P2M reactor supplied semi-continuously with H2
gas. In addition, syntrophic oxidation of volatile fatty acids is thermodynamically only favorable under very low H2
partial pressure (Schnürer et al., 1999), whereas in our system the conditions apparently prefer the opposite reaction, i.e., homoacetogenesis. These considerations cannot explain the dramatic, H2-induced abundance of Candidatus Cloacimonas in our bio-P2M reactors. The rationalization of this observation remains puzzling. Members of the other long-term survivor genus Herbinix (Figure 5 and Supplementary Table 1A) so far have been isolated from thermophilic AD reactors (Koeck et al., 2014; Pap et al., 2015).
The presence ofPrevotellaspecies in swine manure has been demonstrated (Cook et al., 2010; Park et al., 2014), therefore they might have originated from the swine slurry component of the inoculum.
The seven methanogenic genera encompass 97–99% of all Archaea detected in the bio-P2M reactors (Figure 6). All of them are either hydrogenotrophic methanogens or capable of the hydrogenotrophic lifestyle (genus Methanosarcina).
This is not very surprising in light of the operating conditions prevailing in the bio-P2M reactors. Their distinctly different response to the addition of H2+CO2, however, was surprising.
The genus Methanobacterium covered the bulk of Archaea (Figure 6) like in trickle-bed (Rachbauer et al., 2017) or batch reactors (Wahid et al., 2019). During the long-term bio-P2M operation only the genus Methanoculleus responded positively by increasing its relative abundance relative to the N2-fed controls (Figure 7 and Supplementary Table 1C) corroborating earlier findings about outstanding performance of this genus in bio-P2M (Kougias et al., 2017a; Angelidaki et al., 2018; Treu et al., 2018a). It is tempting to speculate that either Methanoculleus is capable of fully supporting its survival and activity independently from the rest of the AD Bacteria and Archaea community, or Methanoculleus developed some sort of syntrophic relationship withCandidatus Cloacimonas to support their continued existence. The stagnation or decreasing relative abundances of the other methanogenic genera (Figure 7C) might indicate that they cannot function well when only H2 + CO2 is available for them.
The relationship between the observed alterations in the community and the relevance of these phenomena to the operational stability of the bio-P2M microbial community should be understood in future explorations.
Comparison of the T-RFLP Data With NGS Results
In addition to the similarities, the comparison of the datasets obtained from the two approaches revealed some differences due to the distinct methodologies. One possible explanation for the discrepancies might be the PCR amplification bias inherent in the T-RFLP technique
(Sipos et al., 2007; Schütte et al., 2008). An additional predisposition may arise from the equivocality of the analysis of the sequences. For example, the mcrA genes of MethanobacteriumandMethanothermobacterhave very similar sequences. Using the NCBI database the clone RF 223 bp was identified both as Methanobacterium petrolerium and Methanothermobacter thermautotrophicus strains. Finally, on-line libraries containing sufficient quantities of accurate mcrA sequences are still in development and one needs to take into account that the targeted sequence length was rather small (∼500 bp).
Nevertheless, strong similarities between the results of the two methodological approaches are worth noting. These are as follows: (i) The reduction of diversity, particularly in the long-term experiments, relative to the inoculum is apparent form both sets of data (Figures 3, 7). (ii) The genus Methanobacterium predominated the archaeal community according to both T-RFLP and metagenome sequencing. Moreover, the genome-centric metagenome evaluation identified one Archaea bin (Bin 11), which belonged to “unknown Methanobacterium.” (iii) All methanogenic T-RFLP clones, except for the methylotrophic Methanomassiliicoccus (RF 50 bp), found their corresponding metagenomics genera in the read-based metagenome analysis.
A similar T-RFLP community was found in the work of Ziganshin et al. (2016).
Taken together, we concluded that the results provided by the two methods mutually validated each other, although the NGS data resulted in a more precise picture of the actual microbial community at genus level.
CONCLUSIONS
This study confirmed the technological feasibility and efficacy of the biological route of the P2M process using a complex and inexpensive microbial community as catalyst. The alterations in the community, originated from a regular mesophilic biogas plant effluent, were followed for an extended time period with or without supplementing the discontinuous H2
(and CO2) dosage with a single initial dose of organic substrate. We employed T-RFLP and shotgun metagenome sequencing techniques to monitor the changes in the community composition. The organic substrate did modify the community structure, but the bio-P2M process could be carried out without added organic substrate for an extended period of time. We highlighted interesting taxonomical and abundance shifts. Although H2 (and/or CO2) is not expected to influence the growth of Bacteria, marked changes took place in this part of the community. These were presumably due to varying survival strategies and capabilities of the taxa. Although the outstanding genus Candidatus Cloacimonas was not among the most abundant taxa, immensely preferred H2 over N2 in the reactors. Major modification in the methanogenic archaeal community took place. The abundant genera were all capable of performing hydrogenotrophic methanogenesis, but only the genusMethanoculleusfound the bio-P2M conditions beneficial
in the long run. Further studies are required, preferably at a larger scale and in continuous mode of operation to better understand and optimize the exact process conditions and parameters.
We proposed an alternative, economically and technologically feasible way to integrate the bio-P2M technology into biogas production schemes by using the microbial community of the effluent from biogas plants on site. The findings substantiate that the surplus renewable H2 is efficiently handled by the mixed anaerobic microbes from the biogas reactor, offering an additional valorization possibility for the biogas plants.
DATA AVAILABILITY STATEMENT
The datasets generated for this study can be found on SRA under the code PRJNA562179. Link: https://www.ncbi.nlm.nih.gov/
bioproject/PRJNA562179. The T-RFLP sequences are attached as Supplementary Table 3.
AUTHOR CONTRIBUTIONS
KK conceived the study, participated in its design and evaluation.
NÁ and MS carried out the bio-P2M experiments, T-RFLP and took part in the evaluation of NGS data. GM and RW performed the Ion Torrent Sequencing and analyzed the metagenomic data.
KK, NÁ, ZB, and GR composed the manuscript. All the authors agreed in publishing the final version of this paper.
FUNDING
This study has been supported in part by the Hungarian National Research, Development and Innovation Fund projects GINOP-2.3.2-15-2016-00011, GINOP-2.2.1-15-2017-00081, GINOP-2.2.1-15-2017-00033, and EFOP-3.6.2-16-2017-00010.
RW, ZB, and GM received support from the Hungarian NKFIH fund projects PD121085, FK123902, and FK123899 financed under the OTKA PD16 and FK 16 funding schemes. This work was also supported by the János Bolyai Research Scholarship (for GM) of the Hungarian Academy of Sciences.
SUPPLEMENTARY MATERIAL
The Supplementary Material for this article can be found online at: https://www.frontiersin.org/articles/10.3389/fenrg.
2019.00132/full#supplementary-material
Supplementary Figure 1 |Principle coordinate analysis on the sequenced samples.
Supplementary Figure 2 |Rarefaction curve showing adequate sequencing depth for effective taxonomical resolution.
Supplementary Figure 3 |Relative abundances of the Bacteria phyla. The compositions of the reactors were as inFigure 3.
Supplementary Figure 4 |Percentile changes of Bacteria relative abundances at phylum level. The changes between the reactors supplied with daily H2dose and
their counterparts, flushed with N2, are compared. Light blue=CH-CN, Red= SH-SN, and Dark blue=CHw12-CNw12, respectively.
Supplementary Table 1A |Percentile changes in the abundances of Bacteria genera compared to the inoculum. Color codes are indicated at the top of the right-side column.
Supplementary Table 1B |Below the bar (<1% abundance in the inoculum) Bacteria genera in the samples fed daily with H2(+CO2), compared to their
relevant controls supplied daily with N2only. Color codes are indicated at the top of the right-side column.
Supplementary Table 1C |Percentile changes in Archaea genera abundances compared to the inoculum. Color codes are indicated at the bottom of the table.
Supplementary Table 2 |Gene calls of the genome-based evaluation.
Supplementary Table 3 |The T-RFLP clone sequences.
REFERENCES
Ács, N., Bagi, Z., Rákhely, G., Minárovics, J., Nagy, K., and Kovács, K. L.
(2015). Bioaugmentation of biogas production by a hydrogen-producing bacterium. Bioresour. Technol. 186, 286–293. doi: 10.1016/j.biortech.2015.
02.098
Ács, N., Kovács, E., Wirth, R., Bagi, Z., Strang, O., Herbel, Z., et al. (2013).
Changes in the Archaea microbial community when the biogasfermenters are fed with protein-rich substrates. Bioresour. Technol. 131, 1121–1127.
doi: 10.1016/j.biortech.2012.12.134
Agarwala, R., Barrett, T., Beck, J., Benson, D. A., Bollin, C., Bolton, E., et al. (2018).
Database resources of the National Center for Biotechnology Information.
Nucleic Acids Res.46, D8–D13. doi: 10.1093/nar/gkx1095
Agneessens, L. M., Ottosen, L. D. M., Andersen, M., Berg Olesen, C., Feilberg, A., and Kofoed, M. V. W. (2018). Parameters affecting acetate concentrations duringin-situbiological hydrogen methanation.Bioresour. Technol.258, 33–40.
doi: 10.1016/j.biortech.2018.02.102
Alimahmoodi, M., and Mulligan, C. N. (2008). Anaerobic bioconversion of carbon dioxide to biogas in an upflow anaerobic sludge blanket reactor. J. Air Waste Manage. Assoc. 58, 95–103. doi: 10.3155/1047-3289.
58.1.95
Alneberg, J., Bjarnason, B. S., de Bruijn, I., Schirmer, M., Quick, J., Ijaz, U. Z., et al.
(2013).CONCOCT: Clustering cONtigs on COverage and ComposiTion, 1–28.
Available online at: http://arxiv.org/abs/1312.4038.
Angelidaki, I., Treu, L., Tsapekos, P., Luo, G., Campanaro, S., Wenzel, H., et al.
(2018). Biogas upgrading and utilization: current status and perspectives.
Biotechnol. Adv.36, 452–466. doi: 10.1016/j.biotechadv.2018.01.011 Aryal, N., Kvist, T., Ammam, F., Pant, D., and Ottosen, L. D. M. (2018). An
overview of microbial biogas enrichment.Bioresour. Technol.264, 359–369.
doi: 10.1016/j.biortech.2018.06.013
Bagi, Z., Ács, N., Bálint, B., Horváth, L., Dobó, K., Perei, K. R., et al. (2007). Biotechnological intensification of biogas production.
Appl. Microbiol. Biotechnol. 76, 473–482. doi: 10.1007/s00253-007- 1009-6
Barret, M., Gagnon, N., Kalmokoff, M. L., Topp, E., Verastegui, Y., Brooks, S. P. J., et al. (2013). Identification of Methanoculleus spp. as active methanogens during anoxic incubations of swine manure storage tank samples. Appl. Environ. Microbiol. 79, 424–33. doi: 10.1128/AEM.02 268-12
Bassani, I., Kougias, P. G., Treu, L., and Angelidaki, I. (2015). Biogas upgrading via hydrogenotrophic methanogenesis in two-stage continuous stirred tank reactors at mesophilic and thermophilic conditions.Environ. Sci. Technol.49, 12585–12593. doi: 10.1021/acs.est.5b03451
Bohn, J., Yüksel-Dadak, A., Dröge, S., and König, H. (2017). Isolation of lactic acid-forming bacteria from biogas plants. J. Biotechnol. 244, 4–15.
doi: 10.1016/j.jbiotec.2016.12.015
Buchfink, B., Xie, C., and Huson, D. H. (2014). Fast and sensitive protein alignment using DIAMOND. Nat. Methods 12, 59–60. doi: 10.1038/
nmeth.3176
Buettner, C., and Noll, M. (2018). Differences in microbial key players in anaerobic degradation between biogas and sewage treatment plants.Int. Biodeterior.
Biodegradation133, 124–132. doi: 10.1016/j.ibiod.2018.06.012
Campbell, J. H., O’Donoghue, P., Campbell, A. G., Schwientek, P., Sczyrba, A., Woyke, T., et al. (2013). UGA is an additional glycine codon in uncultured SR1 bacteria from the human microbiota.Proc. Natl. Acad. Sci. U.S.A.110, 5540–5545. doi: 10.1073/pnas.1303090110
Cook, K. L., Rothrock, M. J., Lovanh, N., Sorrell, J. K., and Loughrin, J. H. (2010). Spatial and temporal changes in the microbial community in an anaerobic swine waste treatment lagoon. Anaerobe 16, 74–82.
doi: 10.1016/j.anaerobe.2009.06.003
Degli Esposti, M., Cortez, D., Lozano, L., Rasmussen, S., Nielsen, H.
B., and Martinez Romero, E. (2016). Alpha proteobacterial ancestry of the [Fe-Fe]-hydrogenases in anaerobic eukaryotes. Biol. Direct 11:34.
doi: 10.1186/s13062-016-0136-3
Delmont, T. O., and Eren, E. M. (2018). Linking pangenomes and metagenomes: the prochlorococcus metapangenome. PeerJ 2018, 1–23.
doi: 10.7717/peerj.4320
Eren, A. M., Esen, O. C., Quince, C., Vineis, J. H., Morrison, H. G., Sogin, M. L., et al. (2015). Anvi’o: an advanced analysis and visualization platformfor’omics data.PeerJ2015, 1–29. doi: 10.7717/peerj.1319
Finn, R. D., Bateman, A., Clements, J., Coggill, P., Eberhardt, R. Y., Eddy, S. R., et al. (2014). Pfam: the protein families database.Nucleic Acids Res.42, 222–230.
doi: 10.1093/nar/gkt1223
Finn, R. D., Clements, J., and Eddy, S. R. (2011). HMMER web server:
interactive sequence similarity searching. Nucleic Acids Res. 39, 29–37.
doi: 10.1093/nar/gkr367
Garcia-Robledo, E., Ottosen, L. D. M., Voigt, N. V., Kofoed, M. W., and Revsbech, N. P. (2016). Micro-scale H2-CO2 dynamics in a hydrogenotrophic methanogenic membrane reactor. Front. Microbiol.
7:276. doi: 10.3389/fmicb.2016.01276
Hattori, S. (2008). Syntrophic acetate-oxidizing microbes in methanogenic environments.Microbes Environ.23, 118–127. doi: 10.1264/jsme2.23.118 Huson, D. H., Beier, S., Flade, I., Górska, A., El-Hadidi, M., Mitra, S., et al.
(2016). MEGAN Community edition–interactive exploration and analysis of large-scale microbiome sequencing data.PLoS Comput. Biol.12:e1004957.
doi: 10.1371/journal.pcbi.1004957
Jones, P., Binns, D., Chang, H. Y., Fraser, M., Li, W., McAnulla, C., et al. (2014).
InterProScan 5: genome-scale protein function classification.Bioinformatics30, 1236–1240. doi: 10.1093/bioinformatics/btu031
Kampmann, K., Ratering, S., Geißler-Plaum, R., Schmidt, M., Zerr, W., and Schnell, S. (2014). Changes of the microbial population structure in an overloaded fed-batch biogas reactor digesting maize silage.Bioresour. Technol.
174, 108–117. doi: 10.1016/j.biortech.2014.09.150
Kang, D. D., Froula, J., Egan, R., and Wang, Z. (2015). MetaBAT, an efficient tool for accurately reconstructing single genomes from complex microbial communities.PeerJ2015, 1–15. doi: 10.7717/peerj.1165
Koeck, D. E., Wibberg, D., Maus, I., Winkler, A., Albersmeier, A., Zverlov, V.
V., et al. (2014). First draft genome sequence of the amylolytic Bacillus thermoamylovoranswild-type strain 1A1 isolated from a thermophilic biogas plant.J. Biotechnol.192, 154–155. doi: 10.1016/j.jbiotec.2014.09.017 Kougias, P. G., Campanaro, S., Treu, L., Zhu, X., and Angelidaki, I. (2017a). A
novel archaeal species belonging toMethanoculleus genusidentified viade-novo assembly and metagenomic binning process in biogas reactors.Anaerobe46, 23–32. doi: 10.1016/j.anaerobe.2017.02.009
Kougias, P. G., Treu, L., Benavente, D. P., Boe, K., Campanaro, S., and Angelidaki, I. (2017b).Ex-situbiogas upgrading and enhancement in different reactor systems.Bioresour. Technol.225, 429–437. doi: 10.1016/j.biortech.2016.11.124 Kovács, K. L., Ács, N., Kovács, E., Wirth, R., Rákhely, G., Strang, O., et al.
(2013). Improvement of biogas production by bioaugmentation.Biomed Res.
Int.2013:7. doi: 10.1155/2013/482653
Langmead, B., and Salzberg, S. L. (2012). Fast gapped-read alignment with Bowtie 2.Nat. Methods9, 357–359. doi: 10.1038/nmeth.1923