3D-printed electrospinning setup for the
1
preparation of loratadine nanofibers with
2
enhanced physicochemical properties
3
4
Rita Ambrusa, Areen Alshweiata, Ildikó Csókaa, George Ovarib, Ammar Esmailb, Norbert
5
Radacsib
6
7
aInstitute of Pharmaceutical Technology and Regulatory Affairs, University of Szeged,
8
Interdisciplinary Excellence Centre, Eötvös u. 6, H-6720 Szeged, Hungary
9
bThe School of Engineering, Institute for Materials and Processes, The University of
10
Edinburgh, Robert Stevenson Road, Edinburgh, EH9 3FB, UK
11 12
*Correspondence to Norbert Radacsi
13
The School of Engineering, Institute for Materials and Processes, The University of
14
Edinburgh, Robert Stevenson Road, Edinburgh, EH9 3FB, UK
15
Tel: +44 131 651 3571
16
E-mail: n.radacsi@ed.ac.uk
17 18 19 20 21 22 23 24
25 26
ABSTRACT
27
This study investigates the effects of drug-loaded nanofibers on the solubility of the poorly
28
water-soluble drug, loratadine. Amorphous morphologies of electrospun loratadine nanofibers
29
were prepared using a 3D-printed electrospinning setup. Polyvinylpyrrolidone was used as a
30
carrier in the solvent preparation method. The prepared nanofibers were characterized by
31
scanning electron microscopy, differential scanning calorimetry, X-ray diffraction analysis,
32
Fourier transform infrared spectroscopy, solubility and in vitro dissolution studies with kinetic
33
behavior evaluation. The scanning electron microscope images showed smooth nanofiber
34
surfaces with a mean diameter of 372 nm. Moreover, both differential scanning calorimetry
35
and X-ray diffraction analysis confirmed the amorphous state of the prepared nanofibers. FT-
36
IR results suggested that loratadine lost its original crystal structure by hydrogen bonding
37
interactions. The fabricated nanofibrous drug samples demonstrated a remarkable 26-fold
38
increase in solubility when compared to the pure drug in phosphate buffer at pH 7.4.
39
Furthermore, dissolution studies showed that 66% of the drug from the nanofibrous mat was
40
released in the first 10 min, which is significantly higher than the maximum of 4% drug
41
release of the reference samples within the same time. Thus, Loratadine nanofibers can be
42
considered as an alternative dosage form with improved physicochemical properties.
43
44
Keywords: Electrospinning, 3D printing, Nanofibers, Loratadine, Physicochemical analysis
45 46
1. INTRODUCTION
47
Loratadine (LOR) is a second-generation anti-histamine (H1) agent. It is frequently prescribed
48
to treat allergic disorders without a central nervous system depressant effects (Simons, 2002).
49
LOR belongs to class II of the biopharmaceutical classification system that exhibits a poor
50
water solubility (0.00303 mg mL-1) and high permeability (log P of 5) (Dagenais et al., 2009).
51
From the chemical point of view, LOR contains pyridine nitrogen atom that is responsible for
52
its pH-dependent solubility (Han et al., 2004). Its pKa value at 25 ºC has been reported as
53
4.85–6.00 (Dagenais et al., 2009; Han et al., 2004; Omar et al., 2007). Related to the
54
properties mentioned above, LOR shows low and variable bioavailability (Arya et al., 2012).
55
Many possibilities have been applied to enhance the dissolution and solubility of LOR, which
56
includes solid dispersion, inclusion with ß-cyclodextrin derivatives, micellar solubilization
57
and self-microemulsifying drug systems (Frizon et al., 2013; Li et al., 2015; Nacsa et al.,
58
2009, 2008).
59
In recent years, many efforts have been devoted to utilizing nanoparticle design for increasing
60
the bioavailability of drugs. Preparation of LOR nanoparticles has been shown to enhance its
61
dissolution and solubility (Alshweiat et al., 2018; Rodriguez Amado et al., 2017). The use of
62
nanoparticles to produce LOR with increased hydrophilic properties shows promise and has
63
opened the scope for new methods of preparation and administrations (Akhgari et al., 2016).
64
Nanofibers, due to their architecture, are considered to be a sophisticated solution to the
65
current inconveniences of drug delivery (Li et al., 2015). Drugs based on nanofibers show
66
faster dissolution kinetics than their micron-sized counterparts, as nanofibers have a
67
significantly higher surface area to volume ratio (Jiang et al., 2004).
68
Among different method of preparation, electrospinning is considered as the most efficient
69
process in nanofiber production. This process has been recognized as simple and versatile to
70
produce nanofibers with low cost (Huang et al., 2003). Radacsi et al. (Radacsi et al., 2018)
71
reported the benefits of electrospinning on scaling up to high yield. This feature makes
72
electrospinning attractive for the industry over the electrospray technique. Both methods are
73
based on electrohydrodynamic atomization and have been demonstrated to improve the
74
physicochemical properties of drug particles (Ambrus et al., 2013; Radacsi et al., 2019).
75
The poor water solubility of the active pharmaceutical ingredients (APIs) and candidates is
76
one of the major challenges of the pharmaceutical industry (Craig, 2002). The delivery of
77
these agents is associated with poor bioavailability (Amidon et al., 1995). As a novel drug
78
manufacturing method, electrospinning is mainly focused on enhancing the dissolution of
79
poorly water-soluble drugs. The enhanced dissolution of drugs in the nanofibers are related to
80
presence of the amorphous state, high specific surface area, increased wettability and
81
solubility, and lower precipitation (Nagy et al., 2012). This offers alternative drug delivery
82
methods, e.g. the electrospun drug films can be used for transdermal delivery, or it can
83
dissolve in the oral cavity (e.g. sublingual or buccal administration), which can be
84
advantageous for patients that cannot swallow (Shahriar et al., 2019). Furthermore, the
85
advanced bioavailability also reduces the side-effects of the drugs (Badawy et al., 1996).
86
Recently, academic and industrial efforts have concentrated on enhancing the dissolution of
87
the poorly water-soluble pharmaceutical agents by electrospinning technology. The
88
fabrication of itraconazole nanofibers using the co-polymer PVPVA64 as a carrier was done
89
by novel high-speed electrospinning method (Nagy et al., 2015). The produced amorphous
90
nanofibers showed rapid dissolution, 90% of the drug was dissolved within 10 min. The high-
91
speed electrospinning method has a significantly higher production rate than the conventional
92
electrispinning techniques, making it attractive for industrial pharmaceutical manufacturing.
93
In another study, electrospinning of itraconazole was performed with
94
hydroxypropylmethylcellulose as a carrier polymer (Verreck et al., 2003). The authors
95
highlighted the amorphous structure and the rapid and complete dissolution of the API,
96
itraconazole, from the prepared nanofibers.
97
Electrospinning has been utilized in poorly water-soluble analgesics. Ketoprofen showed a
98
significant dissolution from the prepared nanofibers with PVP K30 as a drug carrier and
99
filament-forming a polymer. The complete drug release was achieved within just 30 min.
100
However, the pure drug showed approximately 5% release after 2 h (Yu et al., 2010).
101
Moreover, niflumic acid loaded nanofibers into PVP (MW = 1,300,000) were incorporated
102
into capsules. The formulations showed a drug release of 69-91% after 15 min (Radacsi et al.,
103
2019). The high drug release from nanofibers was also achieved in acetaminophen. Yu et al
104
(Yu et al., 2010) found that 93.8% of poorly water-soluble acetaminophen was released in the
105
first 2 min from the PVP (Mw=360,000) drug-loaded nanofibers. Furthermore, ibuprofen has
106
been fabricated into nanofibers (Potrč et al., 2015). The nanofibers released 100% of the
107
ibuprofen in 4 h.
108
To prepare nanofibers of the poorly water-soluble plant sterol. Paaver and co-workers (Paaver
109
et al., 2016) fabricated β-sitosterol loaded chitosan nanofibers. The prepared nanofibers
110
exhibited freely water-soluble properties with a very short lag-time in releasing the β-
111
sitosterol. In a study by Li et al (Li et al., 2013), rapid and improved dissolution rates have
112
been achieved for caffeine and riboflavin nanofibers, using polyvinyl alcohol polymer as
113
filament-forming polymer and drug carrier. The nanofibers showed 100% and 40% release of
114
caffeine and riboflavin, respectively within 60 s.
115
In comparison to the conventional processes of solid dispersion fabrication, electrospinning
116
can produce nanofibers with enhanced dissolution compared to film casting (Potrč et al.,
117
2015) freeze-drying, vacuum drying, and heating drying (Yu et al., 2010).
118
Many studies discussed the effects of the material and process parameters of electrospinning
119
on the release of poorly water-soluble drugs from the nanofibers. These parameters include;
120
drug characteristics (Potrč et al., 2015), polymer type (Baskakova et al., 2016), drug and
121
polymer ratios (Brewster et al., 2004), solvents type and ratios (Paaver et al., 2016), in
122
addition to the electrospinning parameters of voltage (Verreck et al., 2003), and the distance
123
between the collector and the spinneret (Radacsi et al., 2019).
124
The material properties affect the properties of the solutions, such as viscosity and surface
125
tension thus morphology and size of the electrospun nanofibers (Fong et al., 1999). In general,
126
concentration is a critical factor determining the solution viscosity, whereas polymer and
127
solvent affect the value of the surface tension (Yang et al., 2004). Moreover, adjusting the
128
process parameters has significant effects on controlling the final structure of the electrospun
129
fibers (Ryu et al., 2003).
130
Polyvinylpyrrolidone (PVP) is a widely used polymer for preparing electrospun fibers. It
131
shows low toxicity, high biocompatibility and excellent solubility in most organic solvents
132
(Chuangchote et al., 2009). Furthermore, PVP with the Mw 1,300,000 g mol-1 has been the
133
most thoroughly investigated in reported studies related to electrospinning with PVP (Li and
134
Xia, 2003; Nuansing et al., 2006).
135
In the present study, a low-cost 3D-printed electrospinning setup is investigated as a new
136
formulation method for the fabrication of nanostructured LOR. From the production point of
137
view, this study considered the first application of a setup prepared by fused deposition
138
modelling printing method with 3D-printed components (Huang and Radacsi, 2019).
139
Concerning the pharmaceutical goal, this study aimed to produce nanofiber with enhanced
140
dissolution and high drug loading of the poorly water-soluble LOR. These properties enable
141
the incorporation of the nanofibers into different dosage form such as oral, buccal, topical,
142
and transdermal with improved bioavailability. The size and morphology of the produced
143
LOR-PVP nanofibers were characterized by scanning electron microscopy. The structure of
144
the products was investigated using differential scanning calorimetry, X-ray powder
145
diffraction and Fourier transform infrared. The solubility and in vitro release of the selected
146
product was studied in a phosphate buffer solution at pH 7.4 and was compared with the
147
corresponding physical mixture and a prepared reference sample.
148 149
2. Experimental
150
2.1 Materials
151
Loratadine (LOR) was purchased from Teva Ltd. (Budapest, Hungary). Polyvinylpyrrolidone
152
(PVP; Mw 1,300,000 g mol-1) was purchased from Alfa Aesar, UK. 99.99% purity ethanol
153
was obtained from Fisher Scientific, UK.
154
155
2.2. Solution preparation and electrospinning
156
LOR: PVP at 1:1 ratio was used to prepare the electrospinning samples containing PVP as a
157
carrier and ethanol as a solvent system. 0.77 g LOR was mixed with 0.77 g PVP, and this
158
powder mixture was dissolved in 50 mL ethanol. The electrical conductivity of the solution
159
was 2 μS cm-1. This solution was sucked into a 60 mL syringe (BD plastics). The nanofibers
160
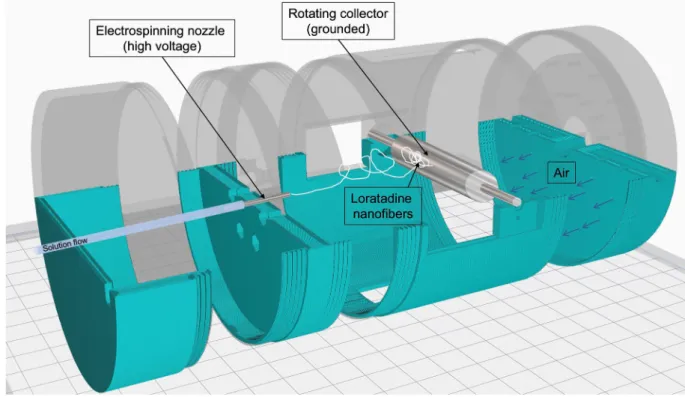
were produced in a 3D-printed electrospinning setup (Figure 1). The details of the 3D printing
161
process and the files of the electrospinning setup can be found in another work (Huang and
162
Radacsi, 2019). A 20G needle was applied at the tip of the syringe, and it was placed into the
163
syringe pump (Cole-Parmer, USA). The LOR solution was injected into the 3D-printed
164
chamber through a Teflon tube using the automatic pump with a pumping speed of
165
15 μL min-1. The Teflon tube (inner diameter 0.8 mm) was connected to a blunt 20G needle
166
that was placed inside the 3D-printed setup and was covered by a safety cap to prevent
167
electric shock. The blunt nozzle was charged by a +35 kV DC high-voltage power supply
168
(Information Unlimited, Amherst, USA) at its maximum voltage. The working distance (WD)
169
between the spinneret and the fiber collector was set to either 65 or 95 mm (95 mm was the
170
maximum distance possible in the setup without using extension parts). The fibers were
171
collected on an 80 mm wide grounded stainless steel drum, which was rotating with a speed
172
of 100 rpm. A constant stream of air (5.2 ms-1) was supplied into the chamber opposing the
173
direction of the electrospun fibers, in order to increase the evaporation rate of the solvent from
174
the electrospun jet and the fibers as they travelled across the chamber. Two different working
175
distances between the injection nozzle and the collection drum were tested in the experiments,
176
and all the other parameters were fixed. The experiments were performed at room temperature
177
at the relative humidity of 42-49%. Each run lasted for 15 minutes.
178
179
Figure 1. Schematic illustration of the 3D-printed modular electrospinning setup.
180 181
2.3 Preparation of the reference samples
182
The reference samples, physical mixture (PM) and the solvent evaporated sample (SE), were
183
prepared by two different methods to control the effect of polymer and re-crystallization
184
procedure on the physicochemical properties of LOR. In the first method the physical mixture
185
(PM) was prepared by Turbula mixer System (Schatz; Willy A. Bachofen AG
186
Maschinenfabrik, Basel, Switzerland) of LOR and PVP with 1:1 ratio at 50 rpm for 10 min
187
(PM). The second method involved the evaporative re-crystallization of the previously mixed
188
PM which was dissolved in 100 mL ethanol. The solvent was evaporated at 25 ºC. The
189
preparation methods of the nanofibers and reference samples are summarized in Table 1.
190 191
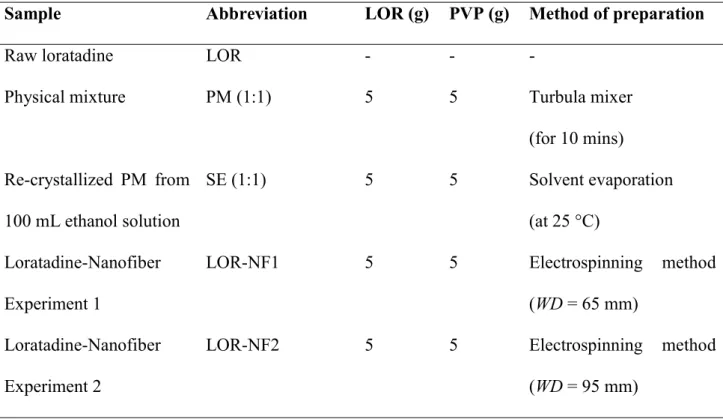
Table 1. Composition and method of preparation of loratadine nanofibers and reference samples.
Sample Abbreviation LOR (g) PVP (g) Method of preparation
Raw loratadine LOR - - -
Physical mixture PM (1:1) 5 5 Turbula mixer
(for 10 mins) Re-crystallized PM from
100 mL ethanol solution
SE (1:1) 5 5 Solvent evaporation
(at 25 °C) Loratadine-Nanofiber
Experiment 1
LOR-NF1 5 5 Electrospinning method
(WD = 65 mm) Loratadine-Nanofiber
Experiment 2
LOR-NF2 5 5 Electrospinning method
(WD = 95 mm)
192
2.4 Scanning electron microscopy (SEM)
193
The morphological appearance of the electrospun fibers was investigated by scanning electron
194
microscopy (SEM) (Hitachi S4700, Hitachi Scientific Ltd., Tokyo, Japan) at 10 kV. The
195
samples were coated with gold-palladium (90 seconds) by a sputter coater (Bio-Rad SC 502,
196
VG Microtech, Uckfield, UK). One hundred nanofibers were selected from each SEM image,
197
and the mean fiber diameter was measured by ImageJ 1.44p software (NIH, USA).
198 199
2.5 Differential scanning calorimetry (DSC)
200
Differential scanning calorimeter (Mettler Toledo TG 821e DSC; Mettler Inc.,
201
Schwerzenbach, Switzerland) was used to measure the thermal response of the samples.
202
Approximately 3 – 5 mg of the sample was precisely weighed into DSC sample pans, which
203
were hermetically sealed, then the lid was pierced. Each sample was measured in the
204
temperature interval of 25 °C – 300 °C at a heating rate of 5 °C min-1 under constant argon
205
flow of 150 mL min-1.
206 207
2.6 Fourier-transform infrared spectroscopy (FT-IR)
208
FTIR spectrum of each sample was obtained by using Fourier transform infrared spectroscopy
209
(Thermo Nicolet AVATAR 330, USA) equipped with GRAMS/AI Version 7.00 software.
210
The samples were ground with 150 mg dry KBr in a mortar and pestle, then compressed into a
211
disc at 10 t pressure. The discs were scanned 128 times at a resolution of 4 cm-1 over
212
4000-400 cm-1 wavenumber region.
213
214
2.7 X-ray powder diffraction (XRPD)
215
The crystalline phase of LOR, PM, SE, and LOR-NFs was characterized using an X-ray
216
powder diffraction (XRPD) BRUKER D8 Advance X-ray diffractometer (Bruker AXS
217
GmbH, Karlsruhe, Germany) with Cu K λI radiation (λ = 1.5406 Å) and a VÅNTEC-1
218
detector. The powder samples were scanned at 40 kV and 40 mA, with an angular range 3° to
219
40° 2θ, at a step time of 0.1 s and a step size of 0.02°r.
220
Eva software was used to separate the crystal and related amorphous peaks. Thus, the
221
software calculated the values of the integrated intensities of the amorphous and crystalline
222
contribution and the crystalline-only contribution. The crystallinity index values (Xc) of the
223
samples were calculated based on the following equation:
224 225
𝑋𝑐 = 𝐴 ⁄𝐴 + 𝐴 (1)
226
227
2.8 Dissolution studies
228
Modified paddle method (USP dissolution apparatus, type II Pharma Test, Hainburg,
229
Germany) was used to determine the rates of dissolution of LOR, PM, SE, and LOR-NFs.
230
Samples containing 1.11 mg of loratadine were placed in 100 mL of phosphate buffer solution
231
at pH 7.4. The paddles were rotated at 100 rpm at 37 °C. At predetermined time 5 m aliquot
232
was withdrawn, filtered and measured for loratadine content using UV spectrophotometry
233
(Unicam UV/VIS Spectrophotometer, Cambridge, UK) at max 248nm. The sampling was
234
performed for 120 min.
235 236
2.9 Model-independent kinetics of dissolution profiles
237
The dissolution behavior of the samples was characterized by calculating the dissolution
238
efficiency (DE) at different time points. The DE represents the percentage of the ratio of the
239
area up to time t divided by the area that described 100% dissolution at the same time (Khan,
240
1975):
241
%𝐷𝐸 = (∫ 𝑦 𝑋 𝑑𝑡) (𝑦 𝑋 𝑡) × 100% (2)
242
The relative dissolution (RD) at 60 min was calculated relative to LOR by using the following
243
formula:
244
𝑅𝐷60 𝑚𝑖𝑛 = % 𝐷𝐸60 𝑚𝑖𝑛 % 𝐷𝐸60 𝑚𝑖𝑛⁄ (3)
245 246
The area under the curve (AUC) was calculated by the trapezoidal method. AUC represents
247
the sum of all trapezia:
248
𝐴𝑈𝐶 = ∑ [(𝑡 − 𝑡 )(𝑦 + 𝑦 ) 2]⁄ (4)
249
Where ti represents the time point and yi is the percentage of sample dissolved at time ti. The
250
mean dissolution time (MDT) was calculated using the following formula (Costa, P., & Lobo,
251
2001)
252
𝑀𝐷𝑇 = ∑𝑛𝑖−1𝑡𝑚𝑖𝑑∆ 𝑀⁄∑𝑛𝑖−1∆ 𝑀 (5)
253
Where i is the dissolution sample number, n is the number of dissolution times, tmid is the time
254
at the midpoint between times ti and ti−1,and ΔM is the amount of the dissolved drug (mg)
255
between times ti and ti−1.
256 257
3. Results and discussion
258
3.1 Morphology and diameter of the LOR-NFs
259
Smooth LOR nanofibers without the presence of beads were obtained from the
260
electrospinning of PVP alcohol solutions (Figure 2c and 2d). The collection distance had a
261
significant effect on the diameter of the prepared nanofibers. 95 mm collection distance
262
resulted in the formation of smooth nanofibers with small diameter (372 ± 181 nm). The low
263
diameter indicates that the nanofibers were stretched enough and sufficiently dried before
264
deposition on the collector. On the other hand, large diameter and fused fibers were obtained
265
at the shorter collection distance (65 mm). The nanofibers in this experiment (LOR-NF1)
266
appeared to not well featured and fused as an indication of the incomplete drying.
267
Furthermore, the protruded fiber shows a large diameter (948 ± 234 nm) and plasticized shape
268
as another indication of not complete drying. The PM showed the characteristic crystal of
269
LOR that showed a crystal size larger than 2 μm (Figure 2a). The SE showed irregular shapes
270
of LOR crystal, both short rod and prisms were present. Moreover, the rod shape crystals
271
exhibited a diameter of 562.7 ± 379 nm. The image of SE (Figure 2b) also showed the
272
aggregation and variety of distribution of LOR within the matrix of PVP polymer.
273 274
Figure 2. Scanning electron microscopy images of the (a) physical mixture; (b) sample
275
prepared by solvent evaporation; (c) electrospun nanofibers using the working distance of 65
276
mm (LOR-NF1); (d) electrospun nanofibers using the working distance of 95 mm (LOR-
277
NF2). The SEM image (d) shows separated, more uniform and smaller diameter nanofibers
278
compared to (c).
279 280
3.2 Structural analysis (DSC, XRPD, and FT-IR)
281
The DSC thermogram of LOR exhibited a sharp endothermic peak at 136.65 °C
282
corresponding to its melting point. The filament-forming matrix polymer PVP showed a broad
283
endotherm between 50 and 100 °C with a peak at 90 °C related to dehydration. The PM and
284
SE showed the characteristic peak of LOR indicating the presence of LOR in its crystalline
285
status. However, these endothermic peaks showed a lower intensity compared to pure LOR
286
due to the reduction of crystallinity either by the dilution effect (PM) and/or the preparation
287
method (SE). DSC of LOR-NFs exhibited a broad peak at temperatures lower than 60 °C,
288
primarily caused by the thermal effect of moisture evaporation and also the glass transition.
289
Moreover, the endothermic peak of LOR has disappeared in the prepared NFs indicating that
290
LOR was no longer present as a crystalline, but had been converted into an amorphous state
291
(Figure 3) (Akhgari et al., 2016).
292 293
Figure 3. DSC thermograms of the raw materials, reference samples and the prepared
294
nanofibers. The reference samples (PM and SE) show the melting point of LOR while
295
electrospun nanofibers represent the amorphous nature of the LOR.
296 297
The X-ray diffraction patterns of the LOR, PVP, PM, LOR-NF1, and LOR-NF2 are presented
298
in Figure 4. LOR showed numerous peaks between 3-30 of the 2-θ scale indicated that LOR is
299
present as a crystalline material. PVP showed two broad halo peaks specified to amorphous
300
status. PM showed the same characteristic peaks of pure LOR while SE showed the lower
301
intensity of LOR peaks in addition to the absence of many peaks due to the reduction of the
302
crystallinity. LOR-NF1 and LOR-NF2 showed complete disappearance of LOR characteristic
303
peaks. However, the two halo peaks of PVP were observed in the electrospun fibers at the
304
same position and showed the same shape.
305 306
307
Figure 4. XRPD diffractograms of the raw materials, reference samples and the prepared
308
nanofibers. The electrospun nanofiber samples were amorphous, while the reference samples
309
(PM and SE) show the crystalline peaks of LOR.
310 311
The crystallinity index (XC) values were calculated to reveal the changes in the degree of
312
crystallinity of the LOR nanofibers and SE with respect to the PM (Gombás et al., 2002). The
313
crystallinity indices from XRPD and DSC further suggest the amorphous state of the prepared
314
LOR-NFs (Table 2). The nominal values of XC obtained from DSC curves were different from
315
that found by XRPD measurements for the samples. The differences in the measurements
316
were expected because of using comparative methods to obtain data rather than absolute ones
317
(Tserki et al., 2006). In the case of XRPD, the XRPD patterns were separated by the software
318
into crystalline and amorphous peaks, and the degree of crystallinity was estimated based on
319
equation (1). In spite of the qualitative analysis of the amorphous peaks by this method, the
320
same procedure was applied to all samples in order to get comparable values. On the other
321
hand, the values obtained by DSC were based on the heat of fusion. Both methods represented
322
the variation of crystallinity between the prepared samples.
323 324
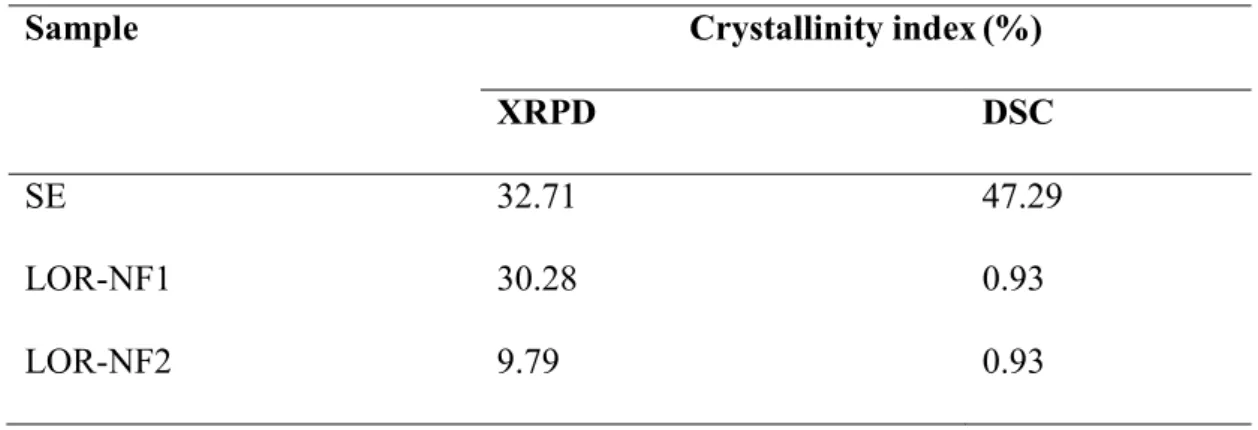
Table 2. The calculated crystallinity index (Xc) of the reference samples and the prepared nanofibers after DSC and XRPD measurements compared to LOR.
Sample Crystallinity index(%)
XRPD DSC
SE 32.71 47.29
LOR-NF1 30.28 0.93
LOR-NF2 9.79 0.93
325
FT-IR analysis was performed to check the compatibility and interactions between LOR and
326
the nanofiber matrix (Figure 5). The FTIR bands that are characteristic to LOR are located at
327
997 cm−1 for aryl C-Cl stretching and 1,227cm−1 for -C-N stretching of aryl N. In addition to
328
bands at 1560 and 1703 cm−1 corresponded to C-O bonds of the amide or ester groups. Bands
329
from 3000 to 2850 cm−1 correspond to the C-H bond (Alshweiat et al., 2018). On the other
330
hand, PVP showed its characteristic bands at 3448.3 cm−1 due to O-H stretching vibrations,
331
2924.4 cm−1 related to asymmetric stretching of CH2, 1652.3 cm−1 for C=O stretching and a
332
broad peak at 1289.4 cm−1 due to C-N stretching vibrations (Sriyanti et al., 2018). The FTIR
333
spectra of the physical mixture and the reference sample showed no obvious shift of the peaks
334
of the functional groups corresponding for hydrogen bonding. However, LOR-NF samples
335
showed shifted peaks of LOR and PVP. The main effects were observed in the O-H and C=O
336
regions. The hydroxyl peak of PVP at 3448.3 cm−1 shifted to 3512 cm−1 and the C=O
337
stretching peaks at 1652.3 cm−1 shifted to 1666.5 cm−1. The band of LOR shifted from 1702.8
338
to 1666.5 overlapping with the shifted peak of PVP. The peak shift of carbonyl stretching was
339
thought to be a result of hydrogen bond intermolecular interaction between LOR and PVP
340
(Zhao et al., 2017). Since the FTIR results showed only hydrogen bonding, but no covalent
341
bonding, LOR and PVP as nanofibers are indicated to be compatible with each other (Frizon
342
et al., 2013; John et al., 2002).
343 344
Figure 5. FT-IR spectra of the raw materials, reference samples and the prepared electrospun
345
nanofibers. The electrospun nanofiber samples and SE sample show an intermolecular
346
interaction between LOR and PVP via hydrogen bond formation.
347 348
According to the aforementioned characteristics of the LOR-NFs, only the LOR-NF2 showed
349
the complete separation of the fibers and nanofibers with small diameters. Therefore, it was
350
selected for further solubility and dissolution studies.
351 352
3.3 Solubility and Dissolution studies
353
LOR-NF2 showed a 26.2-fold increase of LOR solubility compared to the pure drug in
354
phosphate buffer solution, pH 7.4. The solubility of LOR-NF2 was 13.1 ± 0.26 µg mL-1
355
compared to 0.50 ± 0.11 μg mL-1 for LOR at 25 °C (Table 3). The dissolution behaviors of the
356
samples are shown in Figure 6. LOR-NF2 showed the highest release rate, more than 66% of
357
the drug was released in the first 10 min compared to less than 0.5% of the pure LOR. SE
358
samples also showed higher dissolution than LOR because of their contact with the
359
hydrophilic polymer. However, the PM exhibited a release behavior similar to LOR. The
360
improvement in the dissolution of LOR from the electrospun fibers was attributed to the
361
presence of LOR in the amorphous state. Loratadine has been reported to have higher kinetic
362
energy in the amorphous state, hence higher dissolution than its crystalline state. Moreover,
363
the three-dimensional structure of the electrospun fiber can offer a larger surface area,
364
therefore, water can diffuse more efficiently into the polymer to dissolve the drug. The
365
dissolution efficiency of LOR-NF2 was enhanced at all selected time points, as well as RD
366
value. The mean dissolution time of LOR-NF2 was decreased. These results confirmed that
367
the dissolution became fast due to the amorphous state of the drug in the nanofibers, presence
368
of the additives, and reduction of the particle size Table (4).
369 370
Table 3. Solubility (µg mL-1) of LOR and the prepared samples in phosphate buffer at pH 7.4 at a temperature of 25 °C.
Sample Solubility (µg mL-1)
LOR 0.50 ± 0.11
PM 6.45 ± 0.06
SE 7.58 ± 0.38
LOR-NF2 13.1 ± 0.11
371
Figure 6. Dissolution behavior of LOR, reference samples and the prepared electrospun
372
nanofiber with working distance 6.5 mm in phosphate buffer solution, pH 7.4. The nanofiber-
373
based sample has improved dissolution kinetics and higher dissolution rates than the raw LOR
374
or the reference samples (PM and SE).
375
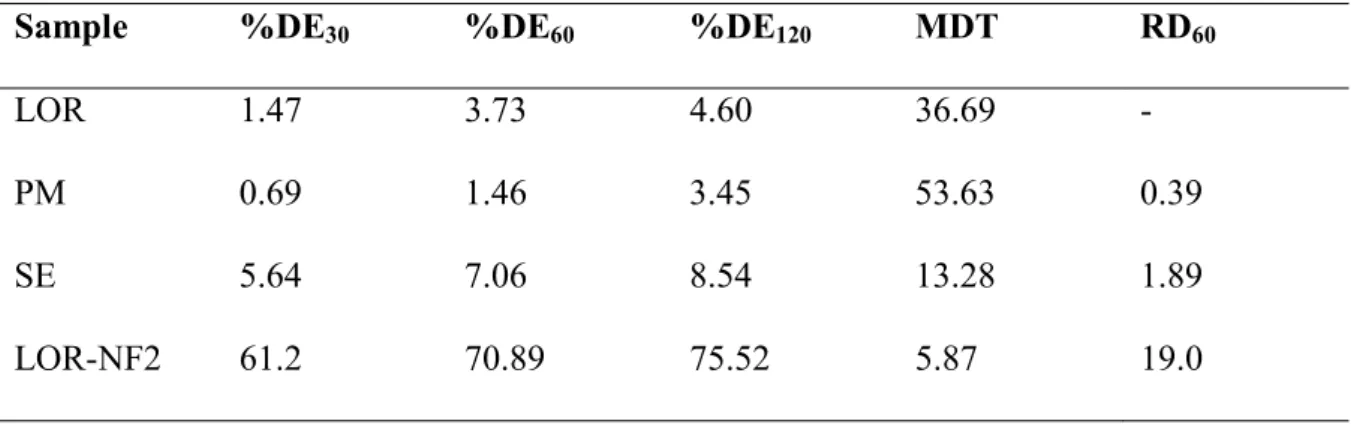
Table 4. Dissolution efficiency (DE) at different time points, mean dissolution time (MDT), and relative dissolution (RD), with respect to the raw LOR at 60 min of the samples.
Sample %DE30 %DE60 %DE120 MDT RD60
LOR 1.47 3.73 4.60 36.69 -
PM 0.69 1.46 3.45 53.63 0.39
SE 5.64 7.06 8.54 13.28 1.89
LOR-NF2 61.2 70.89 75.52 5.87 19.0
376
4. Conclusion
377
This study demonstrated home setup, low-cost, 3D-printed, electrospinning sources for
378
generation of nanofibers using a rotating metal drum as a collector. Nanofibers of LOR were
379
prepared in the hydrophilic PVP polymer and compared to the corresponding physical
380
mixture and conventional reference sample, that was prepared by the solvent evaporation
381
method. The distance between the nozzle and collecting drum was an influential process-
382
parameter; it affected the possibility of preparing separated nanofibers. Moreover, it affected
383
the diameters of the nanofibers. 65 mm distance was optimum to produce separated
384
nanofibers with diameters of 372 nm. The prepared nanofibers displayed an amorphous status
385
of LOR, and the spectroscopic studies indicated interactions between the drug and polymer.
386
As a result of the formation of the amorphous nanofibers, the solubility and dissolution of
LOR were enhanced. Solubility studies showed a marked increase in release rate compared to
388
the pure drug. LOR-NF2 showed a 26.2-fold increase in the solubility of LOR as compared to
389
the pure drug in phosphate buffer solution, pH 7.4. Moreover, more than 66% of the drug was
390
released in the first 10 min compared to less than 4% drug release from the conventional
391
reference sample (SE). Therefore, faster and higher dissolution was achieved for the poorly
392
water-soluble LOR by fabrication of electrospun nanofibers. The improved dissolution could
393
enable the designing of new alternative loratadine formulations, including buccal,
394
transdermal, and topical dosage forms.
395 396
Declaration of interests
397
The authors declare no conflicts of interests.
398 399
Authors’ contributions
400
AR designed the experiment and managed the analysis. AA carried out the analysis,
401
interpreted the results, and wrote the manuscript. CI helped in interpreting of the results. GO
402
and AE performed the electrospinning experiments. NR came up with the experimental design
403
and supervised the overall project.
404 405
Acknowledgements
406
The authors would like to thank Jing Huang of The University of Edinburgh for her assistance
407
with the preparation for the experiments. We thank Michel Vong, and Yunxi Gao for their
408
feedback on the paper. We would also like to thank Fergus Dingwall for his appreciated
409
laboratory assistance. The authors acknowledge the Ministry of Human Capacities, Hungary,
410
grant number 20391-3/2018/FEKUSTRAT, for funding.
411 412
References
413
Akhgari, A., Dezfuli, A.G., Rezaei, M., Kiarsi, M., Abbaspour, M., 2016. The design and
414
evaluation of a fast-dissolving drug delivery system for loratadine using the
415
electrospinning method. Jundishapur J. Nat. Pharm. Prod. 11.
416
https://doi.org/10.17795/jjnpp-33613
417
Alshweiat, A., Katona, G., Csóka, I., Ambrus, R., 2018. Design and characterization of
418
loratadine nanosuspension prepared by ultrasonic-assisted precipitation. Eur. J. Pharm.
419
Sci. https://doi.org/10.1016/j.ejps.2018.06.010
420
Ambrus, R., Radacsi, N., Szunyogh, T., van der Heijden, A.E.M., ter Horst, J.H., Szabó-
421
Révész, P., 2013. Analysis of submicron-sized niflumic acid crystals prepared by
422
electrospray crystallization. J. Pharm. Biomed. Anal. 76, 1–7.
423
https://doi.org/10.1016/j.jpba.2012.12.001
424
Amidon, G.L., Lennernäs, H., Shah, V.P., Crison, J.R., 1995. A Theoretical Basis for a
425
Biopharmaceutic Drug Classification: The Correlation of in Vitro Drug Product
426
Dissolution and in Vivo Bioavailability. Pharm. Res. 12, 413–420.
427
https://doi.org/10.1023/A:1016212804288
428
Arya, A., Sharma, V., Pathak, K., 2012. Pharmaceutical evaluation and dynamic vapor
429
sorption studies of fast dissolving intraoral films of Loratadine. Pharm. Dev. Technol.
430
7450, 1–10. https://doi.org/10.3109/10837450.2012.685659
431
Badawy, S.I.F., Ghorab, M.M., Adeyeye, C.M., 1996. Characterization and bioavailability of
432
danazol-hydroxypropyl β-cyclodextrin coprecipitates. Int. J. Pharm. 128 128, 45–54.
433
Baskakova, A., Awwad, S., Gill, H., Khaw, P.T., Brocchini, S., Zhilyakova, E., Williams,
434
G.R., Hospital, M.E., 2016. Electrospun formulations of acyclovir , ciprofloxacin and
435
cyanocobalamin for ocular drug delivery. Int. J. Pharm. 502, 208–228.
436
Brewster, M.E., Verreck, G., Chun, I., Rosenblatt, J., Mensch, J., Dijck, A. Van, Noppe, M.,
437
Arie, A., 2004. The use of polymer-based electrospun nanofibers containing amorphous
438
drug dispersions for the delivery of poorly water-soluble pharmaceuticals.
439
Chuangchote, S., Sagawa, T., Yoshikawa, S., 2009. Electrospinning of Poly ( vinyl
440
pyrrolidone ): Effects of Solvents on Electrospinnability for the Fabrication of Poly ( p -
441
phenylene vinylene ) and TiO 2 Nanofibers. J. Appl. Polym. Sci. 114, 2777–2791.
442
https://doi.org/DOI 10.1002/app.30637
443
Costa, P., & Lobo, J.M.S., 2001. Modelling and Comparison of Dissolution Profiles. Eur. J.
444
Pharm. Sci. 13, 123–133. https://doi.org/10.1016/S0928-0987(01)00095-1
445
Craig, D.Q.M., 2002. The mechanisms of drug release from solid dispersions in water-soluble
446
polymers. Int. J. Pharm. https://doi.org/10.1016/S0378-5173(01)00891-2
447
Dagenais, C., Avdeef, A., Tsinman, O., Dudley, A., Beliveau, R., 2009. P-glycoprotein
448
deficient mouse in situ blood-brain barrier permeability and its prediction using an in
449
combo PAMPA model. Eur. J. Pharm. Sci. 38, 121–137.
450
https://doi.org/10.1016/j.ejps.2009.06.009
451
Fong, H., Chun, I., Reneker, D.H., 1999. Beaded nanofibers formed during electrospinning.
452
Polym. 40 1585–4592.
453
Frizon, F., Eloy, J. de O., Donaduzzi, C.M., Mitsui, M.L., Marchetti, J.M., 2013. Dissolution
454
rate enhancement of loratadine in polyvinylpyrrolidone K-30 solid dispersions by solvent
455
methods. Powder Technol. 235, 532–539. https://doi.org/10.1016/j.powtec.2012.10.019
456
Gombás, Á., Szabó-Révész, P., Kata, M., Regdon, G., Eros, I., 2002. Quantitative
457
determination of crystallinity of α-lactose monohydrate by DSC. J. Therm. Anal.
458
Calorim. 68, 503–510. https://doi.org/10.1023/A:1016039819247
459
Han, M.Z.I.K., Aus, D.R., Filipovi, P., 2004. Classification of Loratadine Based on the
460
Biopharmaceutics Drug Classification Concept and Possible in Vitro – in Vivo
461
Correlation. Biol. Pharm. Bull 27, 1630–1635. https://doi.org/10.1248/bpb.27.1630
462
Huang, J., Radacsi, N., 2019. Low-cost FDM 3D-printed modular
463
electrospray/electrospinning setup for biomedical applications. 3D Print. Med.
464
Submitted, 2019.
465
Huang, Z.M., Zhang, Y.Z., Kotaki, M., Ramakrishna, S., 2003. A review on polymer
466
nanofibers by electrospinning and their applications in nanocomposites. Compos. Sci.
467
Technol. 63, 2223–2253. https://doi.org/10.1016/S0266-3538(03)00178-7
468
Jiang, H., Fang, D., Hsiao, B., Chu, B., Chen, W., 2004. Preparation and characterization of
469
ibuprofen-loaded poly(lactide-co-glycolide)/poly(ethylene glycol)-g-chitosan electrospun
470
membranes. J. Biomater. Sci. Polym. Ed. 15, 279–296.
471
John, J., Mani, R., Bhattacharya, M., 2002. Evaluation of compatibility and properties of
472
biodegradable polyester blends. J. Polym. Sci. Part A Polym. Chem. 40, 2003–2014.
473
https://doi.org/10.1002/pola.10297
474
Khan, K.A., 1975. The concept of dissolution efficiency. J. Pharm. Pharmacol. 27, 48–49.
475
https://doi.org/10.1111/j.2042-7158.1975.tb09378.x
476
Li, D., Xia, Y., 2003. Fabrication of Titania Nanofibers by Electrospinning. Nano Lett. 3,
477
554–560.
478
Li, H., Tan, Y., Yang, L., Gao, L., Wang, T., Yang, X., Quan, D., 2015. Dissolution
479
evaluation in vitro and bioavailability in vivo of self-microemulsifying drug delivery
480
systems for pH-sensitive drug loratadine. J. Microencapsul. 32, 175–180.
481
https://doi.org/10.3109/02652048.2014.985340
482
Li, X., Kanjwal, M.A., Lin, L., Chronakis, I.S., 2013. Electrospun polyvinyl-alcohol
483
nanofibers as oral fast-dissolving delivery system of caffeine and riboflavin. Colloids
484
Surfaces B Biointerfaces 103, 182–188. https://doi.org/10.1016/j.colsurfb.2012.10.016
485
Nacsa, Á., Ambrus, R., Berkesi, O., Szabó-Révész, P., Aigner, Z., 2008. Water-soluble
486
loratadine inclusion complex: Analytical control of the preparation by microwave
487
irradiation. J. Pharm. Biomed. Anal. 48, 1020–1023.
488
https://doi.org/10.1016/j.jpba.2008.07.001
489
Nacsa, Á., Berkesi, O., Szabó-Révész, P., Aigner, Z., 2009. Achievement of pH-independence
490
of poorly-soluble, ionizable loratadine by inclusion complex formation with dimethyl-ß-
491
cyclodextrin. J. Incl. Phenom. Macrocycl. Chem. 64, 249–254.
492
https://doi.org/10.1007/s10847-009-9558-1
493
Nagy, Z.K., Balogh, A., Démuth, B., Pataki, H., Vigh, T., Szabó, B., Molnár, K., Schmidt,
494
B.T., Horák, P., Marosi, G., Verreck, G., Van Assche, I., Brewster, M.E., 2015. High
495
speed electrospinning for scaled-up production of amorphous solid dispersion of
496
itraconazole. Int. J. Pharm. 480, 137–142. https://doi.org/10.1016/j.ijpharm.2015.01.025
497
Nagy, Z.K., Balogh, A., Vajna, B., Farkas, A., Patyi, G., Kramarics, Á., Marosi, G., 2012.
498
Comparison of Electrospun and Extruded Soluplus®-Based Solid Dosage Forms of
499
Improved Dissolution. J. Pharm. Sci. 101, 322–332. https://doi.org/10.1002/jps.22731
500
Nuansing, W., Ninmuang, S., Jarernboon, W., Maensiri, S., Seraphin, S., 2006. Structural
501
characterization and morphology of electrospun TiO2nanofibers. Mater. Sci. Eng. B
502
Solid-State Mater. Adv. Technol. 131, 147–155.
503
https://doi.org/10.1016/j.mseb.2006.04.030
504
Omar, L., El-Barghouthi, M.I., Masoud, N.A., Abdoh, A.A., Al Omari, M.M., Zughul, M.B.,
505
Badwan, A.A., 2007. Inclusion complexation of loratadine with natural and modified
506
cyclodextrins: Phase solubility and thermodynamic studies. J. Solution Chem. 36, 605–
507
616. https://doi.org/10.1007/s10953-007-9136-3
508
Paaver, U., Laidmäe, I., Santos, H.A., Yliruusi, J., 2016. Development of a novel electrospun
509
nanofibrous delivery system for poorly water-soluble β -sitosterol. Asian J. Pharm. Sci.
510
11, 500–506. https://doi.org/10.1016/j.ajps.2016.04.005
511
Potrč, T., Baumgartner, S., Roškar, R., Planinšek, O., Lavrič, Z., Kristl, J., Kocbek, P., 2015.
512
Electrospun polycaprolactone nanofibers as a potential oromucosal delivery system for
513
poorly water-soluble drugs. Eur. J. Pharm. Sci. 75, 101–113.
514
https://doi.org/10.1016/j.ejps.2015.04.004
515
Radacsi, N., Campos, F.D., Chisholm, C.R.I., Giapis, K.P., 2018. Spontaneous formation of
516
nanoparticles on electrospun nanofibres. Nat. Commun. 9, 3–10.
517
https://doi.org/10.1038/s41467-018-07243-5
518
Radacsi, N., Giapis, K.P., Ovari, G., Szabó-Révész, P., Ambrus, R., 2019. Electrospun
519
nanofiber-based niflumic acid capsules with superior physicochemical properties. J.
520
Pharm. Biomed. Anal. 166, 371–378. https://doi.org/10.1016/j.jpba.2019.01.037
521
Rodriguez Amado, J.R., Prada, A.L., Duarte, J.L., Keita, H., da Silva, H.R., Ferreira, A.M.,
522
Sosa, E.H., Carvalho, J.C.T., 2017. Development, stability and in vitro delivery profile of
523
new loratadine-loaded nanoparticles. Saudi Pharm. J. 25, 1158–1168.
524
https://doi.org/10.1016/j.jsps.2017.07.008
525
Ryu, Y.J., Kim, H.Y., Lee, K.H., Park, H.C., Lee, D.R., 2003. Transport properties of
526
electrospun nylon 6 nonwoven mats. Eur. Polym. J. 39, 1883–1889.
527
https://doi.org/10.1016/S0014-3057(03)00096-X
528
Shahriar, S., Mondal, J., Hasan, M., Revuri, V., Lee, D., Lee, Y.-K., 2019. Electrospinning
529
Nanofibers for Therapeutics Delivery. Nanomaterials 9, 532.
530
https://doi.org/10.3390/nano9040532
531
Simons, F.E.R., 2002. Comparative pharmacology of H1 antihistamines: clinical relevance.
532
Am. J. Med. 113 Suppl, 38S–46S. https://doi.org/10.1016/S0002-9343(02)01436-5
533
Sriyanti, I., Edikresnha, D., Rahma, A., Munir, M.M., Rachmawati, H., Khairurrijal, K., 2018.
534
Mangosteen pericarp extract embedded in electrospun PVP nanofiber mats:
535
Physicochemical properties and release mechanism of α-mangostin. Int. J. Nanomedicine
536
13, 4927–4941. https://doi.org/10.2147/IJN.S167670
537
Tserki, V., Matzinos, P., Pavlidou, E., Vachliotis, D., Panayiotou, C., 2006. Biodegradable
538
aliphatic polyesters . Part I . Properties and biodegradation of poly ( butylene succinate-
539
co -butylene adipate ) 91. https://doi.org/10.1016/j.polymdegradstab.2005.04.035
540
Verreck, G., Chun, I., Peeters, J., Rosenblatt, J., Brewster, M.E., 2003. Preparation and
541
characterization of nanofibers containing amorphous drug dispersions generated by
542
electrostatic spinning. Pharm. Res. 20, 810–817.
543
https://doi.org/10.1023/A:1023450006281
544
Yang, Q., Zhenyu, L.I., Hong, Y., Zhao, Y., Qiu, S., Wang, C.E., Wei, Y., 2004. Influence of
545
solvents on the formation of ultrathin uniform poly(vinyl pyrrolidone) nanofibers with
546
electrospinning. J. Polym. Sci. Part B Polym. Phys. 42, 3721–3726.
547
https://doi.org/10.1002/polb.20222
548
Yu, D., Branford-White, C., White, K., Li, X.-L., Zhu, L.-M., 2010. Dissolution Improvement
549
of Electrospun Nanofiber-Based Solid Dispersions for Acetaminophen. AAPS
550
PharmSciTech 11, 809–817. https://doi.org/10.1208/s12249-010-9438-4
551
Yu, D.G., Branford-White, C., Shen, X.X., Zhang, X.F., Zhu, L.M., 2010. Solid dispersions
552
of ketoprofen in drug-loaded electrospun nanofibers. J. Dispers. Sci. Technol. 31, 902–
553
908. https://doi.org/10.1080/01932690903223948
554
Zhao, Y., Song, X., Sun, J., He, Z., Sun, M., Zhang, S., Wang, J., 2017. Molecular mechanism
555
of polymer-assisting supersaturation of poorly water-soluble loratadine based on
556
experimental observations and molecular dynamic simulations. Drug Deliv. Transl. Res.
557
7, 738–749. https://doi.org/10.1007/s13346-017-0401-8
558 559