Beyond Structural Equation Modeling: model properties and effect size from a Bayesian viewpoint. An example of complex phenotype - genotype associations in depression
Despite the rapid evolution of measurement technologies in biomedicine and genetics, most of the recent studies aiming to explore the genetic background of multifactorial diseases were only moderately successful. One of the causes of this phenomenon is that the bottle- neck of genetic research is no longer the measurement process related to various laboratory technologies, but rather the analysis and interpretation of results. The commonly applied univariate methods are inadequate for exploring complex dependency patterns of multifac- torial diseases which includes nearly all common diseases, such as depression, hypertension, and asthma. A comprehensive investigation requires multivariate modeling methods that enable the analysis of interactions between factors, and allow a more detailed interpretation of studies measuring complex phenotype descriptors. In this paper we discuss various aspects of multivariate modeling through a case study analyzing the effect of the single nucleotide polymorphism rs6295 in the HTR1A gene on depression and impulsivity. We overview basic concepts related to multivariate modeling and compare the properties of two investigated modeling techniques: Structural Equation Modeling and Bayesian network based learning algorithms. The resulting models demonstrate the advantages of the Bayesian approach in terms of model properties and effect size as it allows coherent handling of the weakly sig- nificant effect of rs6295. Results also confirm the mediating role of impulsivity between the SNP rs6295 of HTR1A and depression.
(Neuropsychopharmacol Hung 2012; 14(4): 273-284; doi: 10.5706/nph201212009)
Keywords: Bayesian network based learning algorithm, structural equation modeling, effect size, multivariate statistical methods, systems based modeling, depression, impulsivity
g
aborh
ullam1, g
abriellaJ
uhasz2, g
yorgyb
agdy2 aNdp
etera
Ntal11 Department of Measurement and Information Systems, Budapest University of Technology and Economics, Budapest, Hungary
2 Department of Pharmacodynamics, Semmelweis University, Budapest, Hungary
IntroductIon
After a wide-spread use in social sciences (Spirtes et al., 2000) the application of graphical models became increasingly popular in the fields of biomedicine and genomics, when the need for modeling potentially complex dependency structures between genomic, environmental, and clinical factors and disease state indicators emerged. In case of depression, the influ- ence of genetic factors on the total risk of developing the illness is estimated between 30-40% (Bagdy, 2011).
The majority of the risk is attributed to non-genetic factors such as the social-economic state, family back- ground and negative life events (Wray et al., 2012).
Despite this known fact, the majority of Genome- wide association studies (GWAS) applied a single target – simple phenotype approach which neglected the complex background of multifactorial diseases (Sullivan et al., 2009; Consortium, 2012; McMahon et al., 2010; Shyn et al., 2011). The applied univariate statistical methods (e.g. pairwise association tests) were simple and computationally efficient. However, the interpretation of the results was problematic in many cases due to the strict thresholds on signifi- cance levels which were used to account for multiple hypothesis testing.
A more comprehensive investigation of depression requires multivariate methods enabling the analysis
of interactions between factors, e.g. the relevance of genetic factors with respect to negative life events and the severity of depression. Such methods allow a finer interpretation of studies measuring complex phenotype descriptors e.g. various scores measuring impulsivity or other personality traits.
In this paper we investigate different aspects of modeling the effect of the single nucleotide poly- morphism rs6295 in the HTR1A gene on depression, measured by the Zung self-rating depression scale (ZSDS), and impulsivity (Benko et al., 2010). After an overview on the basic concepts related to multi- variate modeling, we provide a brief comparison of Bayesian statistics and traditional hypothesis testing.
In Section 2 we describe the analyzed data set and the main characteristics of the two investigated modeling techniques: Structural Equation Modeling (SEM) and Bayesian network-based learning algorithms. In Sec- tion 3 corresponding results of HTR1A – impulsivity – depression models are presented. Finally, in Section 4 we compare the properties of SEM and Bayesian network-based learning methods, and discuss the advantages of multivariate modeling.
An overview on multivariate modeling : predictive versus system-based modeling
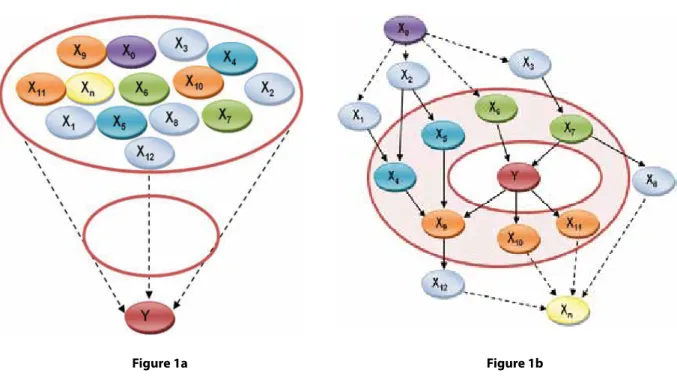
Multivariate methods can be divided into two main classes: conditional modeling-based methods (mod- eling the dependency of an outcome1) and systems- based modeling methods (modeling the complete system of dependencies of multiple factors2). The conditional modeling approach, e.g. logistic regres- sion, aims to identify highly predictive factors without the explicit commitment to the exploration of their possible roles in the causal mechanisms (depend- ency patterns) concerning a target. Although this approach allows the analysis of interactions, e.g. add- ing interaction terms to a logistic regression model, it does not provide a detailed characterization of the relationships involved in the model. For example, stress is a major factor that influences several aspects of depressive disorders through different mediating factors. Given a depression-related data set the signifi- cance of stress can be identified by using conditional modeling. However, the nature of the relationship between depression and stress (denoted as Y and X0
in Figure 1a), e.g. whether it is a direct dependency relationship or a transitive relationship mediated by other factors, will remain hidden or confounded. This can be a significant drawback in exploratory analysis, particularly when the causal role of factors is not well known.
On the other hand, systems-based modeling meth- ods share the common goal of identifying dependency relationships between variables such as phenotypes, genetic features, and environmental aspects. This dependency pattern can be visualized by a directed graph, in which variables are represented by nodes, dependency relationships are represented by directed edges. Assuming additional conditions this graph may coincide with the causal model which describes mechanisms governing the analyzed domain, i.e. the factors influencing the incidence and severity of the disease. Figure 1b shows a hypothetical dependency structure demonstrating the possible relationship types centered on a selected target: direct causes, direct effects, interactions and transitive relation- ships. Assuming depression state as the target Y, direct causes (denoted as X6 and X7 using green nodes) are factors that trigger a depressive state or influence its severity. Coping skill for example may serve as a direct cause as it determines the handling of nega- tive life events. Direct effects (denoted as X9, X10 and X11 using orange nodes) are factors directly affected by the presence of a depressive state. Remarkable examples are mood (as negative change of mood), activity (as decreased mental activity) and anxiety (as increased level of anxiety). Contrary to these direct relationships, interacting factors (denoted as X4, X5 using teal blue nodes) have a mediated relationship with the target. In this case serotonin level can be considered as an interacting factor (X4) with depres- sion (Y) via processing of sad emotions (X9). This can be interpreted in the following way: a decreased level of serotonin can be caused by alterations in the metabolism of serotonin that is independent of de- pression (e.g. drug treatment with Reserpin), how- ever via altered sad emotion processing the change in serotonin level is related to depression. Transitive relationships are also indirect with respect to the tar- get, i.e. in the model there is directed path between the target and the factor, but the factor is not adjacent.
The direct relationships and interactions form the strongly relevant set of factors with respect to the target. The mechanisms described by the strongly relevant set shields the target from the direct influence of other factors. Therefore, the identification of this set provides valuable information on the structurally
1 Besides “outcome”, the terms “output”, “target”, and “dependent”
(variable) are also used in the literature.
2 Besides “factor”, the terms “input”, “predictor” and somewhat mislead- ingly “independent” (variable) are also used in the literature.
Beyond Structural Equation Modeling... orIgInal paper
encoded aspects of relevance. However, transitive relationships can also be important, because they might be more accessible in terms of measurement.
Another aspect of transitive relationships is that some of them are strong enough to be detected by asso- ciation tests. Particularly, a root cause or a common effect (denoted by X0 and Xn respectively) may be a valuable source for diagnosis. In case of modeling depression stress can be considered as a root cause (X0), affecting several factors on multiple paths, and suicide as a common effect (Xn) influenced by several depression-related factors.
Bayesian versus frequentist (traditional) statistical approach
The main problem with systems-based modeling methods is that the identification of a complete model based on a given data set is statistically and computationally not feasible in most practical cases, mostly due to insufficient sample size. There are two straightforward approaches to this problem: (1) in- vestigate how well the model fits the data given a fixed model structure, or (2) learn probable models from data and draw conclusions based on them. Struc- tural Equation Modeling (SEM) methodology uses this former approach and relies on expert knowledge to create a model. In contrast, the latter approach applies a Bayesian viewpoint concerning multiple possible models. That is, instead of selecting one par- ticular model, the distribution of possible models is investigated, i.e. the probability of various models is assessed. By using a technique called ‘model aver- aging’ the relevant part of models can be identified.
In this approach, a factor that is present in most pos- sible models, (e.g. in 92%) will have a high ‘posterior probability’ (0.92). Consequently, if a factor appears in some (60%) or in only a few (8%) models then its posterior probability is respectively lower (e.g. 0.6 and 0.08). Table 1 summarizes the main differences between the frequentist (including hypothesis testing) and the Bayesian paradigms. One of the most impor- tant differences is that the Bayesian approach provides a hypothesis free exploration of the domain, whereas a general initial hypothesis is needed in the frequen- tist case. This initial hypothesis typically assumes a worst case model contrary to the Bayesian approach, which allows averaging over models for a given data set by using informative3 or uninformative priors4. A further practical difference is related to the method
of model validation. In case of the frequentist frame- work a null hypothesis is rejected if the significance
level corresponding to a computed statistic is lower than an arbitrary threshold. In contrast, the posterior probabilities of the Bayesian framework provide a direct measure of relevance for a given hypothesis related to a corresponding model structure. That is, instead of discarding potentially useful information, Bayesian methods provide means for aggregating and interpreting weakly significant results.
Bayesian network-based learning algorithms such as Bayesian network-based Bayesian Multilevel Analysis of relevance (BN-BMLA) (Antal et al., 2008;
Antal, 2010) follow this Bayesian principle and allow the identification of strongly relevant factors.
MaterIals and Methods Subjects
1139 unrelated Hungarian volunteers were recruited for the study. Subjects whose DNA sample was not successfully genotyped and subjects with missing questionnaire data were excluded from all statisti- cal tests. Finally 953 subjects remained, 655 women (68.7%) and 298 men (31.3%). The participants were aged 18–60 years, the mean age was 31.309±10.688 years. Participants were recruited from universities, general practices, and a community-based population.
The inclusion of subjects was unrelated to any positive psychiatric anamnesis. Each subject was given an oral and written summary of the goals and procedures of the project. Before entering the study a formal written consent was given by each of the subjects. All subjects were Hungarian and of Caucasian origin. The study protocol (Lazary et al., 2008) was approved by the Central Ethics Committee in charge of genetic studies with human subjects.
Measured factors
Background information was obtained from all par- ticipants using an adapted questionnaire originally de- veloped by the Epidemiology Unit at the University of Manchester. The self-rating questionnaire collected de- tailed information about socioeconomic background, and medical history including personal and family psychiatric history. The depressive state of subjects was measured by ZSDS score (Zung, 1965), denoted
3 Using informative priors (a priori probabilities) for models means that some models are judged more probable a priori than others.
4 In case of uninformative priors there is no distinction between the a priori probability of models.
Figure 1: (a) illustration of the conditional modeling approach ignoring structural properties, (b) illustration of systems-based modeling displaying possible structural relationship types. Y denotes the target, whereas X0, X1, …, Xn refer to various measured factors. Relationship types are shown with different colors (1b): X0 – common cause (purple), Xn – common effect (yellow), X6,X7 – direct cause (green), X9-X11 – direct effect (orange), X4,X5 – interaction term (teal blue), X1-X3,X8,X12 – other elements (light blue). Nodes that are direct causes, direct effects or interaction terms form a set of strongly relevant set of factors (depicted graphically as a red ring), which statistically isolates the target from other factors.
Figure 1a Figure 1b
Frequentist Bayesian
Prior knowledge General model structure Several possible models with prior probabilities
Hypothesis Null hypothesis N/A
Model validation Indirect (proving by refutation) Direct
Method of evaluation Model selection (build your own model) Model averaging
Score Likelihood ratio test Bayes factor
Result p-value (reject or accept null hypothesis) Posterior probabilities
Variance Confidence interval Credible region
Basis of decision Significance level Optimal decision based on expected utility
Problems Multiple testing problem Computational
Table 1 The comparison of traditional (frequentist) and Bayesian approaches based on modeling properties. Prior knowledge – the type of a priori information used, Hypothesis –requires a preliminary (null) hypothesis, Model validation – the way of validation, Method of evaluation – the way of treating results, Score – the score used for the evaluation of models, Result – the output of modeling, Variance – a measure by which variance is defined, Basis of decision – the base of deciding on a final model, Problems – specific problems of the approach. N/A stands for not applicable.
Beyond Structural Equation Modeling... orIgInal paper
later as Zung Total. Analyzed factors included the second-order factors of the Barratt Impulsiveness Scale (BIS-11) which are non-planning, motor and cognitive impulsiveness scores (Patton et al., 1995), recent negative life events (Brugha et al., 1990; Caspi et al., 2003), childhood adversity score (Juhasz et al., 2011; Gatt et al., 2009), gender (Kendler et al., 2002;
Kendler et al., 2006; 2011), and the genotype informa- tion of rs6295 in gene HTR1A. The HTR1A gene is located on the long arm of chromosome 5 (5q11.2–13) (Kobilka et al., 1987) and rs6295 C(-1019)G is a func- tional polymorphism in the promoter region of the gene (Wu et al., 1999). Previous studies indicate that the rs6295 polymorphism of the HTR1A gene is as- sociated with several psychiatric disorders (Mekli et al., 2011), and also with personality traits, such as im- pulsivity (Benko et al., 2010). Other polymorphisms of the gene HTR1A were also investigated in studies related to aggression and impulsivity (Nanasi et al., 2011; Varga et al., 2011).
Statistical analysis by systems-based multivariate modeling
The traditional univariate approach towards assessing the significance of measured factors is to use pairwise association tests, such as the χ2 test for testing statis- tical dependency. In this case, if one is interested in describing the relationships of a selected target, e.g.
in our case the ZSDS score, then each factor has to be tested against the null hypothesis of independence with respect to the selected target. When the com- puted score of the statistic is above a certain thresh- old related to a chosen significance level, e.g. α=0.05 typically, then the null hypothesis is rejected and the investigated pair is found dependent.
A more sophisticated approach is to use a multi- variate modeling scheme such as regression, decision tree, or systems-based methods e.g. SEM or Bayesian network-based learning algorithms. SEM is centered on evaluating a chosen hypothesis embodied in a special graph containing observed and potentially unobserved (latent) variables (Rózsa et al., 2006). The model is assessed in terms of how well it fits the data set. Given a well-founded hypothesis the refined tools of SEM may provide a thorough validation.
In case of a known causal structure SEM provides a straightforward way of defining cause-effect rela- tionships (Pearl, 2000). The causal structure is encod- ed by a directed graph which contains the variables of interest as nodes, and relationships are represented by edges between them, directed from cause to effect.
The causal structure created using SEM can be translated into a set of structural equations that define these relationships for each variable Xi. The aim of a structural equation is to define the mechanism that assigns a certain value xi for variable Xi given a value configuration (pai) of its direct causes PAi and an error term ei, which represents errors due to omitted factors.
Note that in the causal graph structure PAi are the parents of Xi. The equation is stated in a standard linear equation form in most practical cases.
xi =
Σ
αikxk + ei, i = 1, ...n , k<iwhere parameter αik is nonzero in all cases where Xk is in PAi, i.e.
it is a direct cause of Xi. This in turn enables the exact computa- tion of a direct causal effect of an arbitrary variable Xi on any other variable Xj. If there are multiple causal pathways between Xi and Xj then a total causal effect can also be computed.
On the other hand, Bayesian network-based methods apply a different approach that focuses on identifying relevant variables with respect to a selected target.
This approach enables an initial hypothesis free ex- ploration of the domain.
A Bayesian network BN(G, θ) consists of a directed acyclic graph structure G and its parameterization θ, which repre- sents the conditional probability distributions that describe the dependency relationships between the modeled variables.
The structural properties of Bayesian networks, e.g. edges, subgraphs, provide a rich, graph-based language that encodes several aspects of dependency relationships. The strongly rel- evant (Kohavi et al, , 1997) set of variables (see Figure 1a) for example can be identified by a special structural property centered on the target (Y)5. The importance of the strongly relevant set SRY of a target Y is that given SRY no further knowl- edge can be gained from other variables on Y. In other words, if the goal is to identify the factors that influence Y, then it is enough to learn SRY from the data set D instead of the whole network structure. In terms of conditional probabilities the learning of structural property S from the data set D means the estimation of its a posteriori probability P(S|D), i.e. the strength with which the data confirms its existence. The dif- ficulty with this a posteriori probability (‘posterior’) is that S as a structural property depends on a given structure G, that is
P(S | D) =
Σ
P(G | D)S(G), Gwhere P(G|D) is an a posteriori probability of a structure G given data set D is the data set, and S(G) is 1 if S is present in G and 0 otherwise (Friedman et al, , 2003). In order to estimate
5 This structural property is based on the graphical model and it is called Markov blanket graph of Y. The factors represented by its nodes form a Markov blanket set of Y, which has a special statistical property of isolating all other factors from Y (Pearl, 2000). Furthermore, all ele- ments of this set are strongly relevant (Kohavi et al., 1997) with respect to Y. For the sake of simplicity, we refer to this set in the remainder of the paper as the strongly relevant set of variables.
P(G|D) the essential element of Bayesian learning is applied, the Bayes rule:
P(G | D) P(D | G)P(G)
This means that the posterior P(G|D) can be estimated by the term P(D|G) which is the marginal likelihood of the data given structure G, and the term P(G) the prior probability of a structure G. Note that in practical cases a uniform prior over structures is used, i.e. P(G) is the same for all possible structures. Given a number of conditions (Cooper et al, , 1992) the marginal likelihood is efficiently computable. However, the computation of the posterior is computationally intractable due to the astronomically high number of possible structures (which is super-exponential in the number of variables). There- fore, in order to estimate the posteriors, various approximation methods have to be applied, e.g. Markov chain Monte Carlo simulation (Liu, 2001).
Furthermore, the Bayesian network-based framework allowed the creation of a new Bayesian, multivari- ate, structure-related effect size measure (Hullam et al, , 2012), the Bayesian relevant set-based odds ratio (BRS-OR).
This measure is a result of a hybrid approach that averages over parameters and structures. In order to compute BRS-OR(X, Y, SY) related to a specific target Y, the corresponding relevant sets SY (sets of relevant variables with respect to the target Y) are required. For each set SYi, based on the members of the set, a Bayesian odds ratio is estimated RS-OR(X, Y, SYi) and then it is weighted according to the joint posterior of the set p(SYi).
Finally, BRS-OR is computed by aggregating the odds ratios related to each relevant set. Odds ratios related to sets with high posteriors of relevance may dominate the aggregate odds ratio of BRS-OR, whereas sets with low posteriors may have a negligible effect. In case the overall posterior of investigated sets is low, then the BRS-OR is bound to be close to 1.
results and dIscussIon
Using traditional univariate association tests in or- der to create a model of the relationships between the variables is generally insufficient, because it fails to identify higher order interactions of factors and other synergistic effects. Furthermore, it provides no validation for the model itself. Table 2 summarizes the uncorrected p-values for a selected number of association tests. These results indicate that rs6295 is associated with the BIS Cognitive score only, whereas Zung score is associated with all factors.
The advantage of such an approach is its statisti- cal robustness (e.g. low sample size, noise tolerance), low computational requirements, and ease of inter- pretation, however the drawbacks are numerous as
well. First of all, as more and more factors are tested, the significance level has to be corrected (i.e. lowered) to cope with multiple hypothesis testing. In case of such a small model, this may not be a strict limitation, in case of GWAS studies however, in which thousands or even more factors are measured, this feature alone may prohibit the successful analysis of results.
A further disadvantage is that the interactions among the variables are not taken into consideration which prevents the analysis of complex phenotype descriptors, i.e. assessing the joint role of measured phenotypes. The use of linear or logistic regression may alleviate some of these concerns, although the strict rules of correction for multiple hypotheses test- ing also have to be applied.
A SEM structure was created based on expert knowledge to validate the hypothesis on the effect of rs6295 on impulsivity measured by BIS scores and depression measured by the Zung score. The observa- tion that there is no apparent statistical dependency between rs6295 and the Zung score was also included into the model. Apart from the original variables in the data set an endogenous non-observed vari- able BIS was added to the model, representing the aggregated BIS score. Figure 2 displays the result- ing model with omitted error terms, although cor- relation through error terms is indicated by dashed lines. Model weights of relationships are summa- rized in Table 3. These results indicate a relatively strong relationship between Zung total and factors recent negative life events (0.8) and childhood ad- versity (0.7). In contrast, the path coefficient be- tween Zung and the joint BIS score is only moderate (0.54). Furthermore, the correlation of rs6295 with BIS Cognitive score via error terms is only -0.08.
Although the individual evaluation of relationships is a possibility, the strength of SEM is the evaluation of the multivariate model.
Figure 2 also shows some of the model metrics measuring the fitting of model to the data. CMIN is a Chi-square statistic which compares the tested model and also the independence model (i.e. the model con- taining no edges) with the complete model (i.e. the model which contains all the possible edges between variables). CMIN/DF is the relative chi-square which shows the change of fitness of the model with respect to the number of excluded edges. In case of our model the CMIN/DF is 1.215 which can be considered ac- ceptable, as it is below the frequently chosen thresh- old of 2 (which indicates that too many edges were discarded). Other goodness of fit measures, such as Normed Fit Index (NFI) or the Comparative Fit Index
Beyond Structural Equation Modeling... orIgInal paper
Figure 2: A hypothetical SEM model of the effect of rs6295 on depression and impulsivity. Observed and non-observed factors are represented by rectangular and circular nodes respectively. Causal relationships between factors are denoted by edges directed from cause to effect, corresponding regression weights are also indicated. Error terms are omitted, whereas correlation between factors through error terms are indicated by dashed edges, related correlation coefficients are underlined. The box on the right hand side displays model fitting metrics. CMIN/DF denotes the relative chi-square, CFI denotes the Comparative Fit Index and RMSEA stands for the Root Mean Square Error of Approximation.
Association tests (p-value) BIS Cognitive BIS Non-planning BIS Motor Zung Total
Gender 0.517 0.408 0.681 3.44E-08
Recent negative life events 8.09E-08 0.017 0.001 3.08E-05
Childhood adversity 0.013 2.76E-05 0.010 4.79E-07
rs6295_htr1a 0.005 0.116 0.820 0.131
Zung Total 2.4E-10 3.17E-14 0.009 -
Table 2 Association tests of factors related to modeling the effect of rs6295 on depression and impulsivity. Significant p-values (p<0.05) are shown in bold font.
Standardized regression weights
A→B Estimate A→B Estimate
BIS → Recent negative life events 0.18 BIS → Zung Total 0.54 BIS → BIS Nonplanning 0.61 Gender → Zung Total 0.20 BIS → BIS Motor 0.80 Childhood adversity → Zung Total 0.07
BIS → BIS Cognitive 0.57 Recent negative life events → Zung Total 0.08
Table 3 Standardized regression weights related to the relationships of the hypothetical SEM model. Relationships are represented as cause(A)→effect(B) pairs, and BIS denotes the aggregate BIS score.
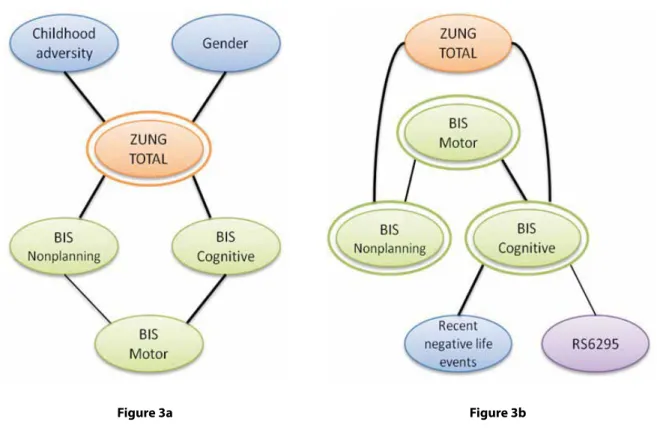
for strong relevance. In contrast, both the posteriors of rs6295 (0.011) and of recent negative life events (0.005) are low which means that neither rs6295 nor recent negative life events have a direct influence on Zung Total.
However, when strong relevance with respect to BIS scores is considered, the factor recent negative life events has a high posterior (0.997), whereas gender (0.056) and childhood adversity (0.057) appear to be non-relevant in this case. Remarkably, rs6295 ap- pears slightly relevant with respect to the BIS scores.
Although its posterior is moderately low (0.247), it is considerably higher than the posteriors of non- relevant factors. A possible explanation of this phe- nomenon is that, as a genetic factor it may have several unobserved mediating factors along the causal chain that influence its effect. Phenotypic factors in contrast, may have a more direct, non-mediated effect on the measured phenotypic descriptors, such as BIS scores in this case. This notion is also reflected in terms of effect size measures (e.g. odds ratios) as relevant phenotypic factors generally have higher odds ratios than relevant genetic factors.
(CFI), compare the tested model to the independence model. CFI is the difference between noncentral chi- squares of two models divided by the chi-square for the independence model. Within the range from 0 to 1 a value higher than .95 indicates good fit. Therefore, the CFI= 0.996 is appropriate. The Root Mean Square Error of Approximation (RMSEA) estimates decrease of fit compared to the complete model. RMSEA of .05 or less indicates good fit just as in the case of our data set (RMSEA=0.015).
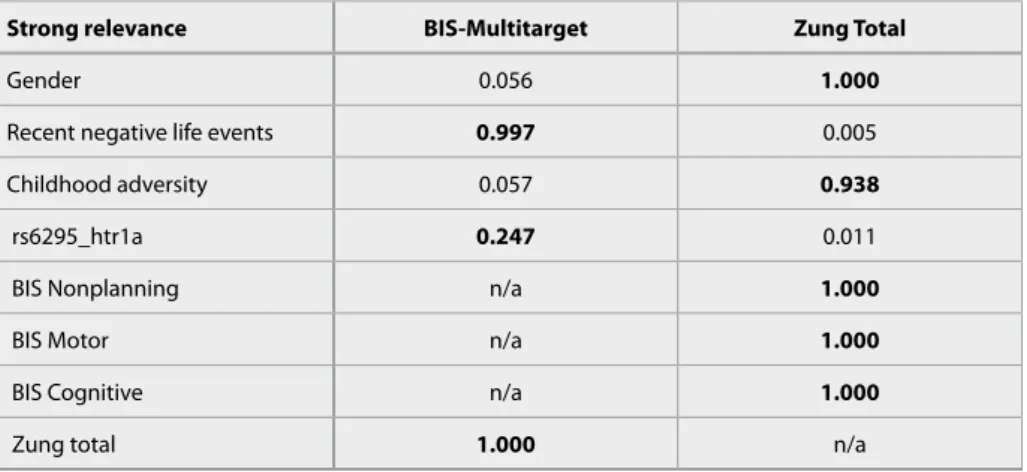
Besides the SEM model, Bayesian network-based algorithms were used to learn the strongly relevant sets of key targets (Zung Total, BIS Motor, BIS Cog- nitive and BIS Nonplanning). The probability of strong relevance for each of the factors is detailed in Table 4. Corresponding strongly relevant subgraphs (factors and their relationships) are shown in Figure 3a and 3b. Figure 3a displays the relevant factors with respect to Zung Total, whereas Figure 3b dis- plays relevant factors with respect to the joint set of BIS scores. In case of Zung Total apart from all BIS scores, the factors gender (1.0) and childhood adversity (0.938) have an extremely high posterior
Figure 3 Strongly relevant set of variables identified by a Bayesian network-based learning algorithm BN-BMLA. 3a (left): strongly relevant set of Zung Total, 3b (right): joint strongly relevant set of BIS Cognitive, Motor and Nonplanning. Nodes represent factors and edges represent dependency relationships between them. (The directedness of the edges is omitted.)
Figure 3a Figure 3b
Beyond Structural Equation Modeling... orIgInal paper
Another aspect of these results is that they indicate a relationship between rs6295 and impulsivity, but show no signs of a direct relationship between rs6295 and depression. Rather, it is more possible that such a relationship is mediated by several factors beside impulsivity.
In order to further characterize the relationships of rs6295 we investigated various effect size meas- ures. Apart from the traditional odds ratio which is structure independent, we applied a new Bayesian multivariate structure-related effect size measure (Hullam et al., 2012), the Bayesian relevant set based odds ratio (BRS-OR).
We used BN-BMLA to assess the possible sets of relevant variables. Both the traditional odds ratio and
the BRS-OR related to rs6295 with respect to Zung total score and BIS Cognitive score is shown in Table 5.
Odds ratios of rs6295 with respect to BIS Cogni- tive score confirm the relationship between rs6295 and impulsivity. BRS-OR takes the structural proper- ties (i.e. structural uncertainty) into account (recall that the posterior of rs6295 with respect to BIS was 0.247) and displays a correctional effect towards the neutral odds ratio (1). For example in case of rs6295 0 (CC) vs. 2 (GG) with respect to BIS Cognitive score 0 vs. 1 the traditional odds ratio (OR) is 1.969, and the Bayesian odds ratio (BRS-OR) is 1.230 which is still remarkable.
In case of Zung total the correctional effect is even more apparent, since the structural uncertainty is
Strong relevance BIS-Multitarget Zung Total
Gender 0.056 1.000
Recent negative life events 0.997 0.005
Childhood adversity 0.057 0.938
rs6295_htr1a 0.247 0.011
BIS Nonplanning n/a 1.000
BIS Motor n/a 1.000
BIS Cognitive n/a 1.000
Zung total 1.000 n/a
Table 4 Posterior probability of strong relevance for targets BIS Cognitive, Motor and Nonplaning and for target Zung total. Notable posteriors are displayed in bold font. BIS multitarget denotes the joint targets of BIS Cognitive, Motor and Nonplaning
Odds ratios
rs6295_htr1a
0 (CC) vs. 1 (GC) 0 (CC) vs. 2 (GG)
OR CI-L CI-U RS-OR BRS-
OR OR CI-L CI-U RS-OR BRS-
OR Zung(0) vs. Zung(1) 0.818 0.575 1.164 0.817 0.999 0.895 0.601 1.333 0.895 0.999 Zung(0) vs. Zung(2) 0.627 0.342 1.150 0.626 0.997 0.358 0.156 0.821 0.358 0.995 BIS(0) vs. BIS(1) 1.245 0.796 1.946 1.246 1.058 1.969 1.211 3.200 1.971 1.230 BIS(0) vs. BIS(2) 1.770 1.116 2.809 1.775 1.184 2.011 1.200 3.370 2.016 1.241 Table 5 Effect size measures related to rs6295 with respect to Zung total and BIS Cognitive score. OR denotes the standard odds ratio, CI-L and CI-U denote the lower and the upper bounds of the 95% confidence interval of OR, RS-OR denotes an intermediate, unweighted Bayesian relevant set-based odds ratio, BRS-OR denotes the Bayesian relevant set-based odds ratio. Both Zung and BIS Cognitive scores were binned to three categories denoted as Zung(0), Zung(1), Zung(2), and BIS(0), BIS(1), BIS(2) respectively.
considerably high, i.e. the posterior for strong rel- evance of rs6295 with respect to Zung total is very low (0.011). The remarkably small odds ratios in case of Zung total category 0 vs. 2 (0.627 and 0.358 for rs6295 0 vs.1 and 0 vs. 2 respectively) are probably due to a sample size issue, as the number of patients having a high Zung score (category 2) is less than 6.3% of the total population. Bayesian odds ratios are close to 1 in all four cases related to Zung total which indicates that rs6295 has no direct effect on Zung total. This also supports the notion that the relationship between rs6295 and depression is more complex and possibly mediated by impulsivity and other factors not observed in this study.
conclusIon
Both of the discussed systems-based modeling tech- niques provided a set of valuable tools enabling a rich interpretation of the results and a thorough explora- tion of the domain. The applied approach of SEM and Bayesian network-based learning algorithms was rather different which consequently lead to different strengths and weaknesses.
One of the main drawbacks of SEM is that it re- quires an initial hypothesis which can be difficult to ob- tain, especially in early stages of exploratory research.
Since SEM is not equipped to learn models from data, one must rely on other methods or on the knowledge of an expert to construct models. Further disadvan- tages of SEM include strong distributional assump- tions regarding the variables, and also the number of variables in a model is limited (due to conver- gence issues). The strength of SEM is accurate model evaluation which becomes apparent only if an appro- priate model is constructed based on a priori knowl- edge, or if the number of plausible models are limited.
Despite the fact that the whole methodology of SEM was devised in order to quantitatively describe causal relationships and to assess effect strength, the constraints on its applicability prohibits its wide- spread usage. In most gene association studies there is no a priori causal structure, or the number of pos- sible a priori structures makes this approach infeasible.
Bayesian network-based methods on the other hand, are based on learning from data. The aim of learning ranges from learning simple properties to the learning of complete models. This approach enables an initial hypothesis free exploration of the domain which can be a major advantage if models with reasonably high scores are found, but it can also be a drawback if there are thousands of similar
models with low scores. Two distinctive advantages of Bayesian network-based methods is the possibility of exploring interactions and other more complex relationships between variables based on data, and the capability of handling complex phenotypic de- scriptors, i.e. multiple target variables giving a rich description of the investigated disease. Furthermore, effect size measures can also be augmented by Baye- sian methods providing a richer characterization of relationships and an automated correction for the presence of multiple predictors. In terms of flexibility, Bayesian network-based methods are the opposite of SEM methods. This flexibility however, comes at con- siderable computational cost, and the interpretation of the output of Bayesian network-based methods is challenging in many cases.
references
1. Antal, P. (2010) Génprioritizálástól az oksági következtetésig.
Neuropsychopharmacologia Hungarica 12(1 Supplement):
13th Hungarian Congress of Neuropsychopharmacology, 2010, Tihany, Hungary.
2. Antal, P., Millinghoffer, A., Hullam, G., Szalai, C., Falus, A.
(2008) A bayesian view of challenges in feature selection:
Feature aggregation, multiple targets, redundancy and inter- action. IN Yvan Saeys, H. L., Iñaki Inza, Louis Wehenkel and Yves Van De Peer (Ed.) New challenges for feature selection in data mining and knowledge discovery (FSDM). September 15, 2008, Antwerp, Belgium, JMLR Workshop and Conference Proceedings.
3. Bagdy, G. (2011) Genetika, epigenetika és társai:okosabbak lettünk? Neuropsychopharmacologia Hungarica 13(2 Supple- ment): 14th Hungarian Congress of Neuropsychopharmacol- ogy, 2011, Tihany, Hungary:p. 17.
4. Benko, A., Lazary, J., Molnar, E., Gonda, X., Tothfalusi, L., Pap, D., Mirnics, Z., Kurimay, T., Chase, D., Juhasz, G., Anderson, I., Deakin, J., Bagdy, G. (2010) Significant Association Between the C(-1019)G Functional Polymorphism of the HTR1A Gene and Impulsivity. American Journal of Medical Genetics Part B-Neuropsychiatric Genetics, 153B:592-599.
5. Brugha, T., Cragg, D. (1990) The List of Threatening Experi- ences - The Reliability and Validity of a Brief Life Events Ques- tionnaire. Acta Psychiatrica Scandinavica, 82:77-81.
6. Caspi, A., Sugden, K., Moffitt, T., Taylor, A., Craig, I., Harrington, H., McClay, J., Mill, J., Martin, J., Braithwaite, A., Poulton, R.
(2003) Influence of life stress on depression: Moderation by a polymorphism in the 5-HTT gene. Science, 301:386-389.
Corresponding author: Gábor Hullám, Department of Measurement and Information Systems, Budapest University of Technology and Economics, 1521 Budapest, Pf. 91., Hungary.
e-mail: gaborhu@mit.bme.hu
Acknowledgements. This work was supported by the National Innovation Office (NIH) NKTH-TECH 08-A1/2-2008-0120 (Genagrid).
Beyond Structural Equation Modeling... orIgInal paper
7. Consortium, M. D. D. W. G. o. t. P. G. (2012) A mega-analysis of genome-wide association studies for major depressive disor- der. Molecular Psychiatry:1–15.
8. Cooper, G., Herskovits, E. (1992) A Bayesian Method for the Induction of Probabilistic Networks from Data. Machine Learning, 9:309-347.
9. Friedman, N., Koller, D. (2003) Being Bayesian about network structure. A Bayesian approach to structure discovery in Baye- sian networks. Machine Learning, 50:95-125.
10. Gatt, J., Nemeroff, C., Dobson-Stone, C., Paul, R., Bryant, R., Schofield, P., Gordon, E., Kemp, A., Williams, L. (2009) Inter- actions between BDNF Val66Met polymorphism and early life stress predict brain and arousal pathways to syndromal depres- sion and anxiety. Molecular Psychiatry, 14:681-695.
11. Hullam, G., Antal, P. (2012) Estimation of effect size posterior using model averaging over Bayesian network structures and parameters. The Sixth European Workshop on Probabilistic Graphical Models (PGM2012). Granada, Spain, (in press).
12. Juhasz, G., Dunham, J., McKie, S., Thomas, E., Downey, D., Chase, D., Lloyd-Williams, K., Toth, Z., Platt, H., Mekli, K., Payton, A., Elliott, R., Williams, S., Anderson, I., Deakin, J.
(2011) The CREB1-BDNF-NTRK2 Pathway in Depression:
Multiple Gene-Cognition-Environment Interactions. Biologi- cal Psychiatry, 69:762-771.
13. Kendler, K., Gardner, C. (2011) A longitudinal etiologic model for symptoms of anxiety and depression in women. Psycho- logical Medicine, 41:2035-2045.
14. Kendler, K., Gardner, C., Prescott, C. (2002) Toward a compre- hensive developmental model for major depression in women.
American Journal of Psychiatry, 159:1133-1145.
15. Kendler, K., Gardner, C., Prescott, C. (2006) Toward a com- prehensive developmental model for major depression in men.
American Journal of Psychiatry, 163:115-124.
16. Kobilka, B., Frielle, T., Collins, S., Yangfeng, T., Kobilka, T., Francke, U., Lefkowitz, R., Caron, M. (1987) An Intronless Gene Encod- ing a Potential Member of the Family of Receptors Coupled to Guanine-Nucleotide Regulatory Proteins. Nature, 329:75-79.
17. Kohavi, R., John, G. (1997) Wrappers for feature subset selec- tion. Artificial Intelligence, 97:273-324.
18. Lazary, J., Lazary, A., Gonda, X., Benko, A., Molnar, E., Juhasz, G., Bagdy, G. (2008) New evidence for the association of the serotonin transporter gene (SLC6A4) haplotypes, threatening life events, and depressive phenotype. Biological Psychiatry, 64:498-504.
19. Liu, J. S. Monte Carlo strategies in scientific computing.
Springer, New York, 2001.
20. McMahon, F., Akula, N., Schulze, T., Muglia, P., Tozzi, F., Detera- Wadleigh, S., Steele, C., Breuer, R., Strohmaier, J., Wendland, J., Mattheisen, M., Muhleisen, T., Maier, W., Nothen, M., Cichon, S., Farmer, A., Vincent, J., Holsboer, F., Preisig, M., Rietschel, M., BiGS, B. D. G. S. (2010) Meta-analysis of genome-wide as- sociation data identifies a risk locus for major mood disorders on 3p21.1. Nature Genetics, 42:128-U52.
21. Mekli, K., Payton, A., Miyajima, F., Platt, H., Thomas, E., Downey, D., Lloyd-Williams, K., Chase, D., Toth, Z., Elliott, R., Oilier, W., Anderson, I., Deakin, J., Bagdy, G., Juhasz, G.
(2011) The HTR1A and HTR1B receptor genes influence stress-
related information processing. European Neuropsychophar- macology, 21:129-139.
22. Nanasi, T., Szekely, A., Ronai, Z., Varga, G., Sasvari-Szekely, M. (2011) Az agresszió és néhány szerotonerg polimorfizmus genetikai asszociációvizsgálata. Neuropsychopharmacologia Hungarica 13(2 Supplement): 14th Hungarian Congress of Neuropsychopharmacology, 2011, Tihany, Hungary:p. 36.
23. Patton, J., Stanford, M., Barratt, E. (1995) Factor structure of the Barratt Impulsiveness Scale. Journal of Clinical Psychology, 51:768-774.
24. Pearl, J. Causality : models, reasoning, and inference. Cam- bridge University Press, Cambridge, U.K. ; New York, 2000.
25. Rózsa, S., Nagybányai Nagy, O., Oláh, A. (Eds.) (2006) A pszi- chológiai mérés alapjai : Elmélet, módszer és gyakorlati alka- lmazás, Budapest, Bölcsész Konzorcium.
26. Shyn, S., Shi, J., Kraft, J., Potash, J., Knowles, J., Weissman, M., Garriock, H., Yokoyama, J., McGrath, P., Peters, E., Scheftner, W., Coryell, W., Lawson, W., Jancic, D., Gejman, P., Sanders, A., Holmans, P., Slager, S., Levinson, D., Hamilton, S. (2011) Novel loci for major depression identified by genome-wide association study of Sequenced Treatment Alternatives to Re- lieve Depression and meta-analysis of three studies. Molecular Psychiatry, 16:202-215.
27. Spirtes, P., Glymour, C. N., Scheines, R. Causation, prediction, and search. MIT Press, Cambridge, Mass., 2000.
28. Sullivan, P., de Geus, E., Willemsen, G., James, M., Smit, J., Zandbelt, T., Arolt, V., Baune, B., Blackwood, D., Cichon, S., Coventry, W., Domschke, K., Farmer, A., Fava, M., Gordon, S., He, Q., Heath, A., Heutink, P., Holsboer, F., Hoogendijk, W., Hottenga, J., Hu, Y., Kohli, M., Lin, D., Lucae, S., MacIntyre, D., Maier, W., McGhee, K., McGuffin, P., Montgomery, G., Muir, W., Nolen, W., Nothen, M., Perlis, R., Pirlo, K., Posthuma, D., Rietschel, M., Rizzu, P., Schosser, A., Smit, A., Smoller, J., Tzeng, J., van Dyck, R., Verhage, M., Zitman, F., Martin, N., Wray, N., Boomsma, D., Penninx, B. (2009) Genome-wide association for major depressive disorder: a possible role for the presynaptic protein piccolo. Molecular Psychiatry, 14:359-375.
29. Varga, G., Szekely, A., Sasvári-Szekely, M. (2011) Monoamin polimorfizmusok és az impulzivitás összefüggései. Neuropsy- chopharmacologia Hungarica 13(2 Supplement): 14th Hun- garian Congress of Neuropsychopharmacology, 2011, Tihany, Hungary:46-47.
30. Wray, N., Pergadia, M., Blackwood, D., Penninx, B., Gordon, S., Nyholt, D., Ripke, S., MacIntyre, D., McGhee, K., Maclean, A., Smit, J., Hottenga, J., Willemsen, G., Middeldorp, C., de Geus, E., Lewis, C., McGuffin, P., Hickie, I., van den Oord, E., Liu, J., Macgregor, S., McEvoy, B., Byrne, E., Medland, S., Statham, D., Henders, A., Heath, A., Montgomery, G., Martin, N., Booms- ma, D., Madden, P., Sullivan, P. (2012) Genome-wide asso- ciation study of major depressive disorder: new results, meta- analysis, and lessons learned. Molecular Psychiatry, 17:36-48.
31. Wu, S., Comings, D. (1999) A common C-1018G polymorph ism in the human 5-HT1A receptor gene. Psychiatric Genetics, 9:105-106.
32. Zung, W. (1965) A self-rating depression scale. Archives of General Psychiatry, 12:63-70.
A multifaktoriális betegségek genetikai hátterét vizsgáló kutatások mindezideáig csak mérsé- kelt sikerekkel jártak, annak ellenére, hogy a biomedicina és a genetika laboratóriumi módszerei óriási fejlődésen mentek keresztül. Ennek egyik oka lehet, hogy a genetikai vizsgálatok során gyűjtött hatalmas mennyiségű adat elemzése és az eredmények értelmezése nem tud lépést tartani a mérési technológiák fejlődésével. Az általánosan alkalmazott egyváltozós módsze- rek nem megfelelőek a multifaktoriális betegségekre jellemző komplex függőségi minták feltárására, amely azonban elengedhetetlen a gyakori betegségek, mint például a depresszió, az asztma és a magasvérnyomás rizikófaktorainak megismeréséhez. Az átfogó vizsgálathoz többváltozós modellezési módszerek alkalmazása szükséges, amelyek lehetővé teszik a fak- torok közötti interakciók elemzését, illetve komplex fenotípusok részletesebb értelmezését.
A cikkben a többváltozós modellezés különböző aspektusait mutatjuk be a HTR1A génben található rs6295 egynukleotidos polimorfizmus depresszióra és impulzivitásra kifejtett hatásait vizsgálva. Ismertetjük a többváltozós modellezéshez kapcsolódó alapfogalmakat, és összeha- sonlítjuk az általunk alkalmazott két modellezési technika, a strukturális egyenlet modellezés és a Bayes-háló alapú tanuló algoritmusok tulajdonságait. Az eredményül kapott modellek a modell-tulajdonságok és a hatáserősségek alapján a bayesi megközelítés előnyeit mutatják, mivel ez a módszer lehetővé teszi az rs6295 gyengén szignifikáns hatásának koherens kezelését.
Az eredmények megerősítik az impulzivitás közvetítő szerepét a HTR1A rs6295 polimorfizmus és a depresszió között.
Kulcsszavak: Bayes-háló alapú tanuló algoritmus, strukturális egyenlet modellezés, hatáserős- ség, többváltozós statisztikai módszerek, rendszeralapú modellezése, depresszió, impulzivitás