R E S E A R C H A R T I C L E Open Access
Analysis of networks of host proteins in the early time points following HIV
transduction
Éva Csősz1* , Ferenc Tóth2, Mohamed Mahdi2, George Tsaprailis3,4, Miklós Emri5†and József Tőzsér1,2*†
Abstract
Background:Utilization of quantitative proteomics data on the network level is still a challenge in proteomics data analysis. Currently existing models use sophisticated, sometimes hard to implement analysis techniques. Our aim was to generate a relatively simple strategy for quantitative proteomics data analysis in order to utilize as much of the data generated in a proteomics experiment as possible.
Results:In this study, we applied label-free proteomics, and generated a network model utilizing both qualitative, and quantitative data, in order to examine the early host response to Human Immunodeficiency Virus type 1 (HIV- 1). A weighted network model was generated based on the amount of proteins measured by mass spectrometry, and analysis of weighted networks and functional sub-networks revealed upregulation of proteins involved in translation, transcription, and DNA condensation in the early phase of the viral life-cycle.
Conclusion:A relatively simple strategy for network analysis was created and applied to examine the effect of HIV- 1 on host cellular proteome. We believe that our model may prove beneficial in creating algorithms, allowing for both quantitative and qualitative studies of proteome change in various biological and pathological processes by quantitative mass spectrometry.
Keywords:Weighted network, Quantitative proteomics, Host response, HIV-1
Background
Utilization of state-of the art proteomics methods can generate thousands of data points, and extensive infor- mation on proteins present in the sample can be ob- tained. High-resolution shotgun proteomics can provide both qualitative and quantitative information about pro- teins, and can be applied in an unbiased way to study the complete proteome [1, 2]. Despite the high amount of data available, it is sometimes difficult to acquire rele- vant biological information, in which case sophisticated analytical methods and capable software are needed [3].
Network analysis is widely used in biological data ana- lysis for examination of transcriptomic, proteomic or metabolomic datasets [4–6], and for analyzing interactions
between various molecules [7, 8]. In the cellular environ- ment, most of the proteins exert their biological function as part of a complex, or in the form of interactions with other proteins, therefore, application of protein-protein interaction (PPI) analysis methods is advantageous [9].
PPI networks can provide a new layer of information, allowing for the utilization of currently available data, in addition to possibly unravelling hidden biological phe- nomena [10,11].
New concepts on network analysis are emerging help- ing the understanding of biological complexity [12], however, in most cases, only the presence or absence of the protein is considered, the available quantitative data can hardly be incorporated into the network analyses.
The replication cycle of human immunodeficiency virus-1 (HIV-1) is a complex, multi-step, and highly reg- ulated process. The cycle typically begins with viral at- tachment to cell surface receptors, and ending with the production of infectious virions. Due to the multiple processes involved, the replication cycle has been
© The Author(s). 2019Open AccessThis article is distributed under the terms of the Creative Commons Attribution 4.0 International License (http://creativecommons.org/licenses/by/4.0/), which permits unrestricted use, distribution, and reproduction in any medium, provided you give appropriate credit to the original author(s) and the source, provide a link to the Creative Commons license, and indicate if changes were made. The Creative Commons Public Domain Dedication waiver (http://creativecommons.org/publicdomain/zero/1.0/) applies to the data made available in this article, unless otherwise stated.
* Correspondence:cseva@med.unideb.hu;tozser@med.unideb.hu
†Miklós Emri and József Tőzsér contributed equally to this work.
1Proteomics Core Facility, Department of Biochemistry and Molecular Biology, Faculty of Medicine, University of Debrecen, Egyetem ter 1., Debrecen 4032, Hungary
Full list of author information is available at the end of the article
classically divided into two distinct phases; the early and late phase. The early phase encompasses cell binding, fu- sion, internalization, uncoating, reverse transcription, as well as integration of the viral cDNA into the host gen- ome. On the other hand, transcription of viral genome, export of viral RNA, assembly of virions at the plasma membrane, as well as budding and maturation of the re- leased virions are parts of the late phase of the replica- tion cycle [13,14]. While late phase events are relatively well characterized, the precise mechanism and regula- tion of early phase steps remain poorly understood.
Genomics and proteomics studies were carried out to investigate how HIV-1 hijacks the host cellular machinery, avoiding being sensed by host immune responses. siRNA screens were implemented to study the cellular genes and proteins required for HIV-1 infection [9, 15, 16], HIV-1 protein – host protein protein-protein interaction net- works were generated, and the data were deposited in HIV-1 Human Interaction Database [17].
In case of HIV infection, the network-based examina- tions have identified perturbed host cellular systems;
such as the proteasome and transcriptional regulation, and have revealed that HIV-1 preferably interacts with highly connected and central cellular proteins [18–20].
In this study, we have generated the protein expression profiles of cells during early HIV-1 infection using pro- tein mass spectrometry, and integrated the acquired data with knowledge-based protein-protein interaction net- work to understand how cellular network is perturbed by HIV.
Results
Our aim was to analyze the proteomic landscape of the early stage of HIV-1 based lentiviral vector transduction.
293 T cells were infected with VSV-G pseudotyped HIV- 1 vector, and 0, 4 and 12 h post-infection, cell lysates were harvested. Label-free proteomics was applied to examine protein-level changes. Duplicate samples for three time points were collected (0, 4, and 12 h post- transduction) in case of virus transduced samples and in case of control, mock transduced samples. The collected 6 virus treated and 6 control samples were analyzed in duplicates, allowing for the measurement of two tech- nical and two biological replicates for each time point.
The mass spectrometry proteomics data have been de- posited into the ProteomeXchange Consortium [21] via the PRIDE partner repository with the dataset identifier PXD010436 andhttps://doi.org/10.6019/PXD010436.
Identified proteins (Additional file 1) were manually curated, and in the case of non-human or non-viral identifications, the sequences were verified. In many in- stances, they were mistakenly designated as non-human proteins, in which case it was corrected. In few in- stances, the non-human proteins could not be matched
to any of the human or viral proteins, and consequently, these sequences were omitted from further analyses. The data for Rhodobacter capsulatus cytochrome c, bovine pancreatic trypsin inhibitor, bovine serum albumin and pig trypsin were kept to serve as reference for quantita- tive analyses, but were not used for further computa- tions. The relative amount of proteins was computed based on spectral counting and in case of each protein the mean of the results of the four analyses correspond- ing to each condition was calculated (Additional file2).
Statistical analysis
Firstly, a qualitative analysis was carried out to detect newly expressed or down-regulated proteins in the first 4 or 12 h after HIV-1 pseudovirion transduction. Only those proteins were considered for statistical analysis which could be quantified in at least 2 out of 4 replicates, and were not quantified in other conditions. HIST1H1E, HNRNPL, PRRC2A and TRIM28 were quantified only at H04, and there were no proteins quantified solely in H12 time point (Additional files1,2). HIST1H1E interacts with linker DNA between nucleosomes, and functions in DNA condensation, HNRNPL and TRIM28 play a role in trans- lation and transcription, while PRRC2A plays a role in in- flammatory processes.
Some of the proteins were quantified in all time points except H12. These include ALYREF, CCDC86, CSDA, COX5A, HN1, MYL6, PPIF, SEPT2, SRSF6, TCOF1, and TPM3 (Additional file 1). These proteins participate in RNA binding (ALYREF, CCDC86, SRSF6, TCOF1), DNA binding (CSDA), protein folding (PPIF), energy gener- ation (COX5A), signalization (HN1) and cytoskeleton assembly (MYL6, SEPT2, TPM3).
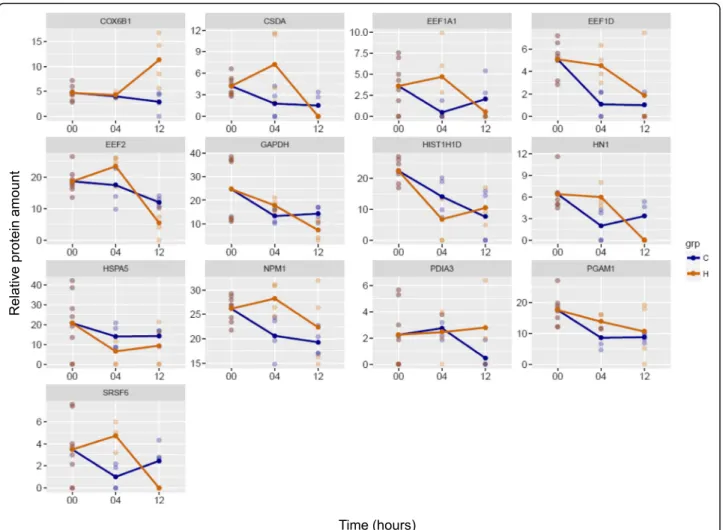
In order to examine changes in the amount of proteins, statistical analysis was carried out (Additional file3). The amount of CSDA, EEF1A1, EEF1D, HN1, NPM1, PGAM1 and SRSF6 increased significantly, while that of HIST1H1D and HSPA5 significantly decreased in H04 (Fig.1). It is interesting to note that after peaking in H04, CSDA, HN1 and SRSF6 were not quantified in H12. In H12, compared to C12, the amount of COX6B1 and PDIA3 increased, while that of EEF2 and GAPDH de- creased significantly (Fig. 1). When the function of pro- teins showing statistically significant changes was examined, we observed an increase in the amount of pro- teins implicated in RNA binding in H04, and an overall decrease in their amount in H12.
Network analysis
To broaden our insight, and to better understand the possible functional associations of protein changes upon HIV-1 pseudovirion transduction, we have searched for the available protein-protein interactions of the quanti- fied proteins in our datasets. For evaluation of the
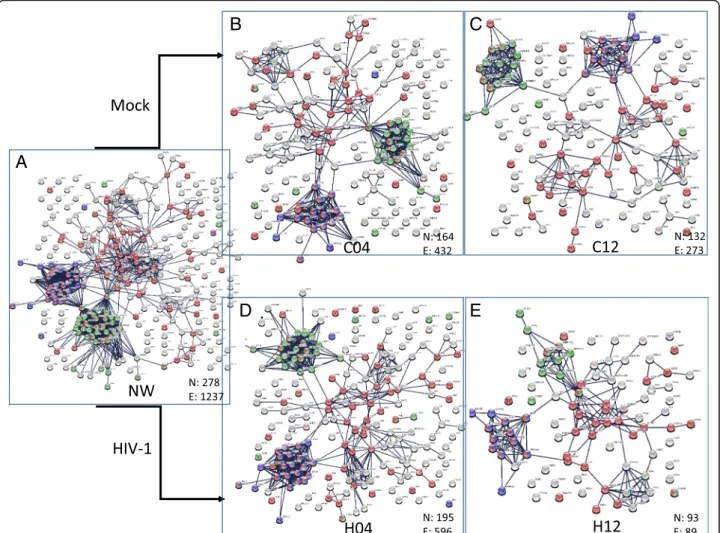
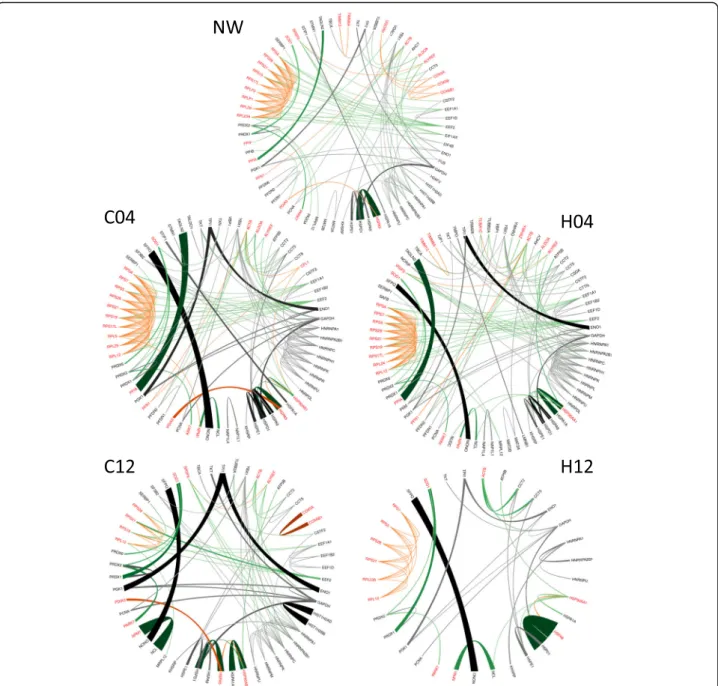
interactions, the STRING database was used, which con- tains information on known and predicted, direct phys- ical, and indirect functional protein-protein interactions [22]. Only interactions which were of high confidence (interaction score in STRING database > 0.95) were used. Initially, five binary interaction networks were gen- erated: NW0 combined proteins from mock- and virion- treated cell lysates collected at 0 time-point, C04 and C12 networks contained proteins from the mock-treated cells collected 4 h and 12 h post-infection, respectively, and the H04 and H12 networks contained proteins from the HIV-1 transduced cells collected at 4 and 12 h time- points, respectively (Fig. 2). The number of nodes and the number of edges of the networks show a decreasing trend over time, with a marked shrinkage in H12.
These binary networks provide information solely on the possibility of interaction between two proteins (Fig.2, Fig.3a, b), hence, in order to gain more realistic informa- tion, protein amounts measured by spectral counting were implemented into the network using a simple statistical
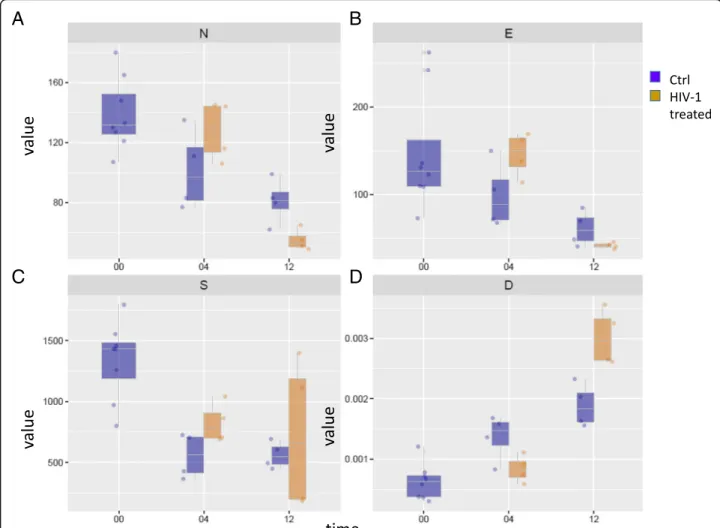
model. In this way, binary edges were transformed into es- timated protein pair’s interaction intensities in the sample, which is proportional to the amounts of proteins partici- pating in the interaction, and inversely proportional to the number of interactions (Fig. 3c). The weighted networks were examined, and the number of nodes (N), edges (E), network strength (S), edge density (D) and functional and non-functional edge ratio (R) were calculated (Fig.4).
The number of nodes decreased significantly in H12, indicating network shrinkage in H12, observed in the binary network (Fig.4a). The number of edges and net- work strength did not change in a statistically significant manner (Fig.4b, c), however, edge density decreased sig- nificantly in H04 while increasing significantly in H12 (Fig. 4d). These changes indicate the presence of a less interactive network in H04, and a smaller; yet more ac- tive, PPI network in H12 (Fig.4a, d).
Next, we were eager to analyze the functionality of the networks, and hence, we generated functional sub- networks of proteins belonging to GO terms. All the
Fig. 1Relative protein amounts showing statistically significant changes in HIV-1 treated samples compared to controls. The x axis shows the time-points of sample collection in hours, and the y axis shows the relative protein amounts. Blue color refers to control (C), and yellow color to the HIV-1 treated sample (H)
Molecular Function, Biological Process and Cellular Com- ponent GO terms listed as enriched by STRING in C04, H04, C12 and H12; where at least 10 protein per GO function in any of the networks were present, were con- sidered. To visualize network changes, the GO.0044765 term was chosen randomly (Fig. 3d), and the change of this sub-network was visualized in all time points (Fig.5).
Proteins present in a given GO term listed as enriched by STRING were considered as being part of the functional sub-network (f), whereas proteins not being part of the specific GO term, were considered as non-functional (n) proteins. Three types of interactions were analyzed: i) inter- actions between proteins belonging to functional sub- networks (f), ii) interactions between proteins not belong- ing to functional sub-network (n), and iii) interactions
between functional and non-functional proteins (c–cross) (Fig.3d). In order to better understand the changes, a stat- istical approach was applied, and the following network pa- rameters were calculated: in case of each functional (f) network of proteins belonging to a specific GO term, the Nf, Ef, Sf, Df, and Rf, while for non-functional (n) proteins the Nn, En, Sn, Dn, and Rn network parameters were cal- culated. In case of interactions between the functional and non-functional proteins (c) the Ec, Sc, Dc, and Rc network parameters were calculated (Additional file4).
According to our hypothesis, those GO functions or functional sub-networks might be responsible for the changes induced by HIV-1, where the parameters in the functional network change significantly, whereas in the non-functional network, no statistically significant changes
A
B
D E
C
Fig. 2Protein-protein interaction network of the proteins quantified in each condition. The PPI networks were generated by STRING (confidence 0.95) using the list of quantified proteins presented in Additional file2in case of each condition. The number of nodes (N) and the number of edges (E) according to STRING in case of each network is indicated.a. PPI network of proteins in the 0 h time point (NW),b. PPI network of proteins in the 4 h time point in control, mock-transduced cells (C04).cPPI network of proteins in the 12 h time point in control, mock- transduced cells (C12).d. PPI network of proteins in the 4 h time point in HIV vector-transduced cells (H04).e. PPI network of proteins in the 12 h time point in HIV vector- transduced cells (H12). Red dots represent proteins belonging to transport GO term, blue dots indicate proteins having a role in translation, while green dots indicate proteins with a role in RNA splicing according to the functional enrichment analysis provided by STRING
are shown. At the same time, those GO functions where the parameters in the functional network do not change in a statistically significant manner, yet do so in the non- functional sub-networks, are thought to not explain the changes related to HIV-1 transduction.
After statistical analysis and FDR correction of the re- sults (Additional file5), in case of some GO terms, sta- tistically significant differences were observed. No significant difference in edge and strength values were observed in any of the functional sub-networks (Ef and Sf ), and the number of nodes was significantly reduced in H12 only in the case of 5 functional sub-networks (Additional file 6). Considering edge density (D) and
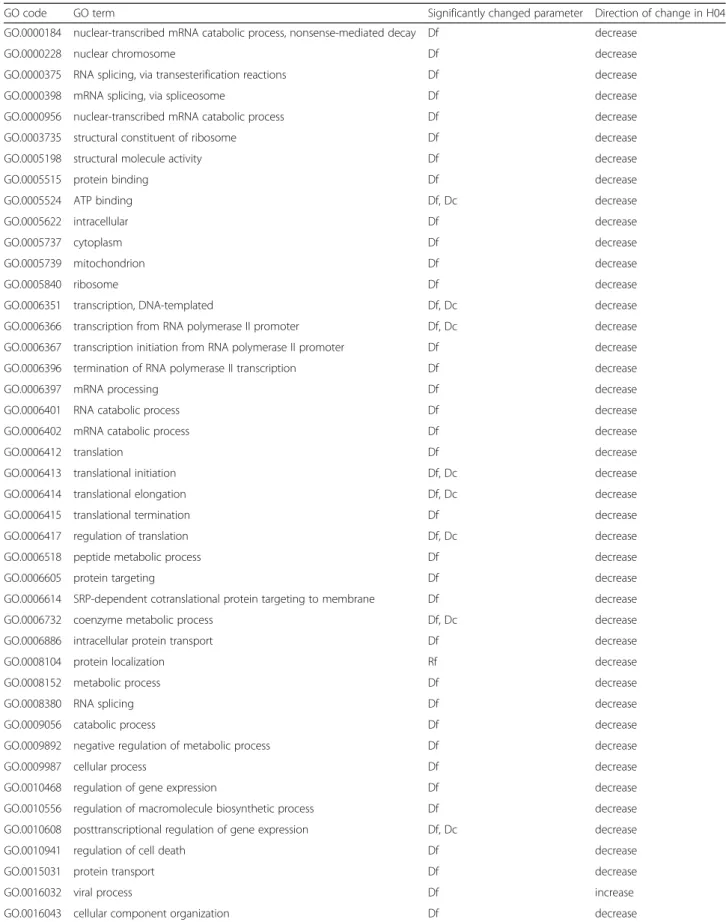
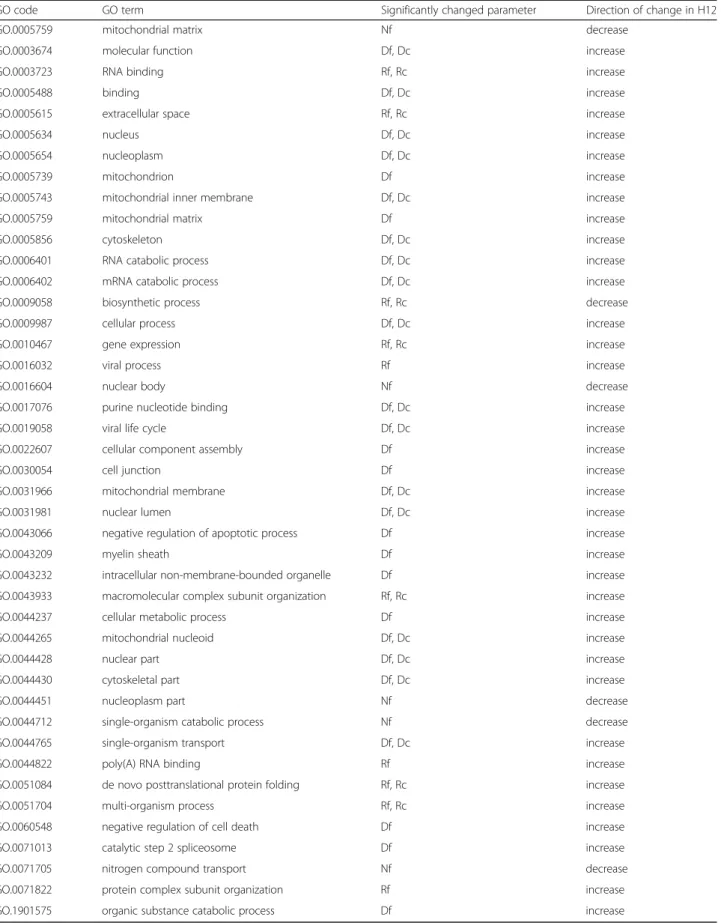
ratio (R), only those GO terms were further considered where (i) the significant difference was present only in the functional sub-network (Df and Rf, respectively) and (ii) where the significant difference was present both in the functional sub-network (Df and Rf ) and in the cross network (Dc and Rc) (Additional file 6). According to our hypothesis, proteins belonging to the GO terms listed in Table 1 and Table 2, are responsible for the changes of cellular proteome observed in the H04 and H12 networks in response to HIV-1 transduction. In H04 sample, an increase in the node number (proteins present in the network) was observed, however, this in- crease was not significant. In the same time, a global
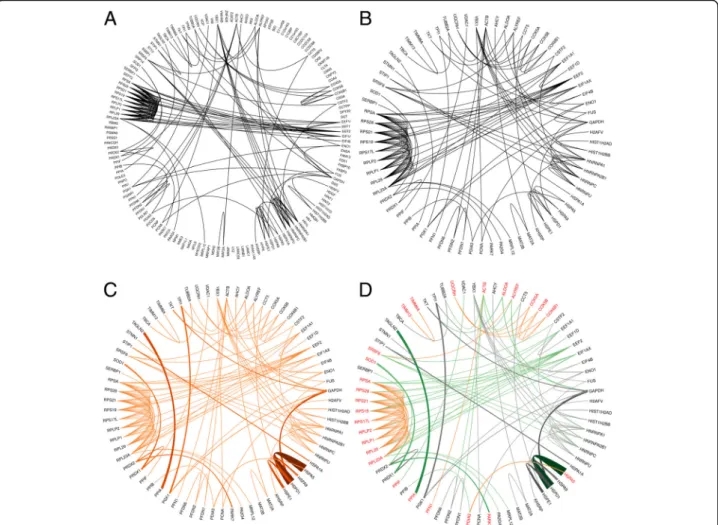
Fig. 3Network generation pipeline. Representative network drawn by circlize, showing data for sample1 and interactions generated by STRING.
a. Binary network containing all the identified proteins arranged in alphabetical order on the external ring of the circular plot. Thin black curves show the possible interactions generated by STRING.b. Binary network containing only the proteins with interactions. The isolated proteins (i.e.
without any connection) were eliminated. Thin black curves show the possible interactions generated by STRING.c. Weighted network containing the interacting proteins. Orange lines represent interactions, the higher the intensity of the color and thickness of the line the higher the interaction strength.d. Weighted network with functional feature. A randomly selected GO function (GO:0044765) is used to illustrate the functional network. Red proteins are part of the functional sub-network, while black proteins are not, being considered as non-functional proteins. The weighted interactions are color-coded according to the protein-pair classification: functional–functional interactions are orange, non-functional–non-functional interactions are gray, and functional–non-functional interactions are green. The interaction strength is represented by the intensity of the color and thickness of the line: the higher the intensity of the color and the thickness of the line, the higher the interaction strength
decrease in interactivity; represented by the number of edges, was noticed. Proteins which might be responsible for this reduced interactivity belong to the RNA processing-related functions (splicing, RNA synthesis, RNA catabolism, translation, transcription), regulation of cell death, regulation of cellular response to stress, viral life cycle (viral gene expression, viral transcription, viral life cycle) and protein localization, and some very gen- eral GO terms; such as protein binding, cellular macro- molecular biosynthetic process, purine nucleotide binding, organic substance transport, etc. (Table 1). In spite of the reduced global interactivity, some functional sub-networks; such as viral process, protein kinase bind- ing, multi-organism process, de novo protein folding and protein complex subunit organization, show signifi- cantly increased interactivity (Table1).
In H12, a statistically significant reduction of the node numbers and shrinkage of the network; along with a sig- nificant increase in interactivity, was observed (Fig. 4).
The proteins responsible for the increased interactivity
(increased Df and Rf values) belong to RNA binding, RNA catabolic process, viral life cycle, viral process, negative regulation of cell death, de novo posttranslational protein folding, protein complex subunit organization, and cellu- lar metabolic process, etc. (Table2). The cell junction and the myelin sheet GO terms also appear in H12, however, when proteins belonging to these GO terms were exam- ined, it was found that they are part of more general GO terms from the list; such as intracellular non-membrane- bounded organelle or nucleus, extracellular space, etc. In case of biosynthetic process functional sub-network (GO.0009058), a decrease in the Rf was observed.
Discussion
Genome-wide RNA interference-based screens were carried out to evaluate more than 20,000 human gene products to determine their alteration in HIV infec- tion [23, 24]. A previous study showed an overall downregulation of cellular genes encoding for nuclear proteins, and genes involved in DNA replication and
A B
C D
Fig. 4Network parameters.a. Number of nodes (N),b. number of edges (E),c. network strength (S),d. strength or edge density (D) in case of networks observed in the examined conditions. The y axis show the mean value characteristic for each parameter, and the x axis indicates the time points. Blue color refers to control, while the yellow color to the HIV-1 treated conditions
protein synthesis in the early stages of the early phase of viral infection [25], in a pattern that was confirmed by our analysis (Table 1). Upregulation of cellular genes was only found to occur at a later time point, peaking at 22 h post-infection, additionally, analysis on T cells showed that the most profound changes in
cellular proteome appear 24 h after infection, at time points related to the late phase of infection [26].
It was found that up to 300 host cellular genes were involved in the life cycle of HIV-1, and while the identity of the genes was divergent among different studies, they were found more or less to belong to similar pathways
Fig. 5Network changes visualized in case of a representative functional sub-network. The representative figure shows the changes in weighted networks in case of proteins belonging to randomly selected GO:0044765 GO term. NW represents the weighted PPI network of interacting proteins in the 0 h time point, C04 and C12 correspond to PPI networks of interacting proteins in the 4 h and 12 h time point, respectively, in control, mock-transduced cells. H04 and H12 represent the weighted PPI network of interacting proteins in the 4 h and 12 h time point, respectively, in HIV vector-transduced cells. Red proteins are part of the functional sub-network, while black proteins are non-functional proteins.
The weighted interactions are color-coded according to the protein-pair classification: functional–functional interactions are orange, non- functional–non-functional interactions are gray, and functional–non-functional interactions are green. The interaction strength is represented by the intensity of the color and thickness of the line: the higher the intensity of the color and the thickness of the line, the higher the interaction strength
Table 1List of GO terms with significantly different changes in the functional sub-network in H04
GO code GO term Significantly changed parameter Direction of change in H04
GO.0000184 nuclear-transcribed mRNA catabolic process, nonsense-mediated decay Df decrease
GO.0000228 nuclear chromosome Df decrease
GO.0000375 RNA splicing, via transesterification reactions Df decrease
GO.0000398 mRNA splicing, via spliceosome Df decrease
GO.0000956 nuclear-transcribed mRNA catabolic process Df decrease
GO.0003735 structural constituent of ribosome Df decrease
GO.0005198 structural molecule activity Df decrease
GO.0005515 protein binding Df decrease
GO.0005524 ATP binding Df, Dc decrease
GO.0005622 intracellular Df decrease
GO.0005737 cytoplasm Df decrease
GO.0005739 mitochondrion Df decrease
GO.0005840 ribosome Df decrease
GO.0006351 transcription, DNA-templated Df, Dc decrease
GO.0006366 transcription from RNA polymerase II promoter Df, Dc decrease
GO.0006367 transcription initiation from RNA polymerase II promoter Df decrease
GO.0006396 termination of RNA polymerase II transcription Df decrease
GO.0006397 mRNA processing Df decrease
GO.0006401 RNA catabolic process Df decrease
GO.0006402 mRNA catabolic process Df decrease
GO.0006412 translation Df decrease
GO.0006413 translational initiation Df, Dc decrease
GO.0006414 translational elongation Df, Dc decrease
GO.0006415 translational termination Df decrease
GO.0006417 regulation of translation Df, Dc decrease
GO.0006518 peptide metabolic process Df decrease
GO.0006605 protein targeting Df decrease
GO.0006614 SRP-dependent cotranslational protein targeting to membrane Df decrease
GO.0006732 coenzyme metabolic process Df, Dc decrease
GO.0006886 intracellular protein transport Df decrease
GO.0008104 protein localization Rf decrease
GO.0008152 metabolic process Df decrease
GO.0008380 RNA splicing Df decrease
GO.0009056 catabolic process Df decrease
GO.0009892 negative regulation of metabolic process Df decrease
GO.0009987 cellular process Df decrease
GO.0010468 regulation of gene expression Df decrease
GO.0010556 regulation of macromolecule biosynthetic process Df decrease
GO.0010608 posttranscriptional regulation of gene expression Df, Dc decrease
GO.0010941 regulation of cell death Df decrease
GO.0015031 protein transport Df decrease
GO.0016032 viral process Df increase
GO.0016043 cellular component organization Df decrease
GO.0016070 RNA metabolic process Df, Dc decrease
Table 1List of GO terms with significantly different changes in the functional sub-network in H04(Continued)
GO code GO term Significantly changed parameter Direction of change in H04
GO.0016071 mRNA metabolic process Df decrease
GO.0016482 cytoplasmic transport Df decrease
GO.0016604 nuclear body Df, Dc decrease
GO.0017076 purine nucleotide binding Df, Dc decrease
GO.0018130 heterocycle biosynthetic process Df, Dc decrease
GO.0019058 viral life cycle Df decrease
GO.0019080 viral gene expression Df decrease
GO.0019083 viral transcription Df decrease
GO.0019222 regulation of metabolic process Df decrease
GO.0019438 aromatic compound biosynthetic process Df, Dc decrease
GO.0019538 aromatic compound biosynthetic process Df decrease
GO.0019899 enzyme binding Df decrease
GO.0019900 kinase binding Df, Dc increase
GO.0019901 protein kinase binding Df increase
GO.0022607 cellular component assembly Df decrease
GO.0022626 cytosolic ribosome Df decrease
GO.0030554 adenyl nucleotide binding Df, Dc decrease
GO.0031625 ubiquitin protein ligase binding Df, Dc decrease
GO.0031974 membrane-enclosed lumen Df decrease
GO.0032550 purine ribonucleoside binding Df, Dc decrease
GO.0032553 ribonucleotide binding Df, Dc decrease
GO.0032555 purine ribonucleotide binding Df, Dc decrease
GO.0032774 RNA biosynthetic process Df, Dc decrease
GO.0034248 regulation of cellular amide metabolic process Df decrease
GO.0034613 cellular protein localization Rf decrease
GO.0034622 cellular macromolecular complex assembly Df decrease
GO.0034645 cellular macromolecule biosynthetic process Df decrease
GO.0034654 nucleobase-containing compound biosynthetic process Df, Dc decrease
GO.0034655 nucleobase-containing compound catabolic process Df decrease
GO.0035639 purine ribonucleoside triphosphate binding Df, Dc decrease
GO.0036094 small molecule binding Df, Dc decrease
GO.0042981 regulation of apoptotic process Df decrease
GO.0043065 positive regulation of apoptotic process Df decrease
GO.0043066 negative regulation of apoptotic process Df, Dc decrease
GO.0043226 organelle Df decrease
GO.0043227 membrane-bounded organelle Df, Dc decrease
GO.0043229 intracellular organelle Df decrease
GO.0043231 intracellular membrane-bounded organelle Df decrease
GO.0043233 organelle lumen Df decrease
GO.0044085 cellular component biogenesis Df decrease
GO.0044237 cellular metabolic process Df decrease
GO.0044238 primary metabolic process Df decrease
GO.0044248 cellular catabolic process Df decrease
GO.0044249 cellular biosynthetic process Df decrease
[27,28]. Network analysis is widely used in the examin- ation of protein-protein interactions, providing informa- tion regarding protein changes on a different level, giving a more ample view of the alterations and pertur- bations of the biological systems as a result of a particu- lar treatment. During analysis of PPIs, the presence or
absence of a protein is evaluated, and the interactions, in light of existing evidence (ex. experimental data, litera- ture search, computational methods), are displayed [29, 30]. STRING is a widely used, constantly updated, and expanding database of PPIs [22], used for the examin- ation of verified, or potential interactions among Table 1List of GO terms with significantly different changes in the functional sub-network in H04(Continued)
GO code GO term Significantly changed parameter Direction of change in H04
GO.0044260 cellular macromolecule metabolic process Df decrease
GO.0044265 cellular macromolecule catabolic process Df decrease
GO.0044267 cellular protein metabolic process Df decrease
GO.0044271 cellular nitrogen compound biosynthetic process Df, Dc decrease
GO.0044391 ribosomal subunit Df decrease
GO.0044422 organelle part Df decrease
GO.0044424 intracellular part Df decrease
GO.0044444 cytoplasmic part Df decrease
GO.0044446 intracellular organelle part Df decrease
GO.0044451 nucleoplasm part Df, Dc decrease
GO.0044454 nuclear chromosome part Df decrease
GO.0044802 single-organism membrane organization Df, Dc decrease
GO.0045184 establishment of protein localization Df decrease
GO.0046907 intracellular transport Df, Dc decrease
GO.0051084 de novo posttranslational protein folding Df increase
GO.0051704 multi-organism process Df, Dc increase
GO.0060255 regulation of macromolecule metabolic process Df decrease
GO.0060548 negative regulation of cell death Df, Dc decrease
GO.0065003 macromolecular complex assembly Df decrease
GO.0070013 intracellular organelle lumen Df decrease
GO.0070972 protein localization to endoplasmic reticulum Rf decrease
GO.0071013 catalytic step 2 spliceosome Df decrease
GO.0071702 organic substance transport Df, Dc decrease
GO.0071704 organic substance metabolic process Df decrease
GO.0071705 nitrogen compound transport Df, Dc decrease
GO.0071822 protein complex subunit organization Df increase
GO.0071840 cellular component organization or biogenesis Df decrease
GO.0072594 establishment of protein localization to organelle Df decrease
GO.0080090 regulation of primary metabolic process Df decrease
GO.0080135 regulation of cellular response to stress Df, Dc decrease
GO.0090304 nucleic acid metabolic process Df, Dc decrease
GO.0097367 carbohydrate derivative binding Df, Dc decrease
GO.1901362 organic cyclic compound biosynthetic process Df, Dc decrease
GO.1901566 organonitrogen compound biosynthetic process Df decrease
GO.1901575 organic substance catabolic process Df decrease
GO.1901576 organic substance biosynthetic process Df decrease
GO.1902580 single-organism cellular localization Df decrease
In case of each GO term where statistically significant changes were observed in network parameters in HIV-1 treated cells at 4 h time-point the GO identifier, the changed parameter and the direction of change is indicated
Table 2List of GO terms with significantly different changes in the functional sub-networks in H12
GO code GO term Significantly changed parameter Direction of change in H12
GO.0005759 mitochondrial matrix Nf decrease
GO.0003674 molecular function Df, Dc increase
GO.0003723 RNA binding Rf, Rc increase
GO.0005488 binding Df, Dc increase
GO.0005615 extracellular space Rf, Rc increase
GO.0005634 nucleus Df, Dc increase
GO.0005654 nucleoplasm Df, Dc increase
GO.0005739 mitochondrion Df increase
GO.0005743 mitochondrial inner membrane Df, Dc increase
GO.0005759 mitochondrial matrix Df increase
GO.0005856 cytoskeleton Df, Dc increase
GO.0006401 RNA catabolic process Df, Dc increase
GO.0006402 mRNA catabolic process Df, Dc increase
GO.0009058 biosynthetic process Rf, Rc decrease
GO.0009987 cellular process Df, Dc increase
GO.0010467 gene expression Rf, Rc increase
GO.0016032 viral process Rf increase
GO.0016604 nuclear body Nf decrease
GO.0017076 purine nucleotide binding Df, Dc increase
GO.0019058 viral life cycle Df, Dc increase
GO.0022607 cellular component assembly Df increase
GO.0030054 cell junction Df increase
GO.0031966 mitochondrial membrane Df, Dc increase
GO.0031981 nuclear lumen Df, Dc increase
GO.0043066 negative regulation of apoptotic process Df increase
GO.0043209 myelin sheath Df increase
GO.0043232 intracellular non-membrane-bounded organelle Df increase
GO.0043933 macromolecular complex subunit organization Rf, Rc increase
GO.0044237 cellular metabolic process Df increase
GO.0044265 mitochondrial nucleoid Df, Dc increase
GO.0044428 nuclear part Df, Dc increase
GO.0044430 cytoskeletal part Df, Dc increase
GO.0044451 nucleoplasm part Nf decrease
GO.0044712 single-organism catabolic process Nf decrease
GO.0044765 single-organism transport Df, Dc increase
GO.0044822 poly(A) RNA binding Rf increase
GO.0051084 de novo posttranslational protein folding Rf, Rc increase
GO.0051704 multi-organism process Rf, Rc increase
GO.0060548 negative regulation of cell death Df increase
GO.0071013 catalytic step 2 spliceosome Df increase
GO.0071705 nitrogen compound transport Nf decrease
GO.0071822 protein complex subunit organization Rf increase
GO.1901575 organic substance catabolic process Df increase
In case of each GO term where statistically significant changes were observed in network parameters in HIV-1 treated cells at 12 h time-point the GO identifier, the changed parameter and the direction of change is indicated
proteins of interests. These networks are rich in infor- mation on protein clusters and functions based on Gene Ontology (GO), however, enrichment of GO terms does not handle protein amounts, therefore, reflecting theor- etical, rather than actual parameters. Meanwhile, the use of highly accurate mass spectrometry techniques provide analytical data that is wealthy in quantity as well as qual- ity. There were few attempts made to introduce the quantitative data into the network analysis [31, 32]. In order to implement quantitative data into the PPI net- works, instead of the widely used binary networks, a weighted network often utilized in information science [33] was used in this study. Taking into account the pro- tein amount reflected by the normalized total spectra, instead of the probabilistic assumption [32], we choose a simple statistical model. In our model, the protein pair’s interaction is proportional to their amount in the sam- ple, and inversely proportional to the number of possible interactions listed in the PPI network generated by STRING for proteins present in the sample. After in- cluding the interaction density values as network edge weights; calculated by our method, we could determine a sort of weighed network parameters for the statistical investigation of network alterations.
In our study, we aimed at characterizing the cellular proteome changes in the early stage of HIV-1 infection, within the 0–12 h time interval. Generation of weighted networks, and analysis of functional sub-networks re- vealed that the dynamics of protein level changes in sub- networks is different in HIV-1 transduced samples 12 h post-infection. Expectedly, in the very early stages of in- fection, proteins involved in translation, transcription and DNA condensation were upregulated, notably HIST1H1E, HNRNPL, PRRC2A and TRIM28. Some other proteins; such as ALYREF, CCDC86, CSDA, COX5A, HN1, MYL6, PPIF, SEPT2, SRSF6, TCOF1, and TPM3, prominently associated with RNA binding, cyto- skeleton assembly, and signaling were quantified in all time points except H12.
Examining the binary networks, two protein clusters could be observed. One comprising proteins having a role in translation and ribosome biogenesis, and the other containing proteins from the hnRNP family with a role in RNA splicing (Fig. 2). The functional sub- network containing the ribosome component proteins did not show a statistically significant change, and with this, we can demonstrate on protein level the same find- ings observed by Kleinman et.al. at gene level, who could not observe statistically significant difference in case of genes having a role in ribosome biogenesis at 12 h time point [34]. Regarding the other cluster containing mainly hnRNP proteins, we could not observe a statistically sig- nificant change in network parameters among the differ- ent time points. However, literature data show that host
RNA splicing is altered upon HIV-1 infection, and the level of class A/B and H of hnRNP proteins changes; ini- tially decreased 6–12 days post infection, thereafter in- creased [35]. At the same time, it was shown that some proteins of this cluster; such as HNRNPH1, HNRNPU and SRSF6, are so called HIV-1 dependency factors [36]
and are required by HIV-1. These data are derived from later time-points, as most of the experiments do not examine such early events at 4 h or 12 h post infection.
Considering the results of the analyses, based on the weighted networks, we could identify increased cellular metabolic processes comprising increased RNA binding and catabolism, cellular component assembly, along with increased viral process and inhibition of apoptosis (in- creased negative regulation of apoptotic process). RNA binding was shown to be increased upon RNA virus in- fection; Garcia-Moreno et al. observed an increased ac- tivity of RNA-binding proteins upon sindbis virus (SINV) infection at 18 h time point [37]. At the same time, they observed an increased binding of RNA bind- ing proteins to viral RNAs. This implies a massive down- regulation of the host mRNAs 18 h post infection, involving mainly the housekeeping genes [37]. In case of HIV-1 infection, global siRNA studies indicate that a sta- tistically significant portion of the host factors partici- pate in mRNA transport [18].
Cells infected with HIV-1 usually die by apoptosis, hence prevention of apoptosis might help maintain the viral reservoir in the host [18, 38]. It was shown that a fraction of infected immune cells survive, highlighting the importance of escaping from apoptosis in the devel- opment of viral reservoirs [38]. A mixed pattern of up- regulation and downregulation of genes involved in antiviral defense and cell death signaling were observed by Mohammadi et al. at early time points [24]. Inhibition of apoptosis increases the virus production in HIV-1 in- fected cells [39], and modulation of this system might be a good possibility for a therapeutic intervention [40].
Based on our data on the weighted networks, HSPA8 shows an increased interactivity in H12 datasets (Fig.5a).
HSPA8 and other members of the Hsp70 family play a key role during viral infection either as receptors for the virus, as chaperons aiding the protein folding, or as transporters between organelles [18,41,42].
Hijacking of the host system by HIV-1 is a complex phenomenon with early and late events. In the early phases of the viral infection, the virus utilizes cellular RNA and protein production machinery for its replication.
It was observed that by 15 h post infection, all viral tran- scripts were produced by the cells, and 18 h after infec- tion, the virus budding commences [24]. Chang et al.;.
using next generation sequencing, observed a considerable viral mRNA level in infected cells 12 h post-infection [43].
In this sense, examining the host response 48 h [15,44] or
6 days post-infection [45] cannot provide us with informa- tion on the very early events. Observations made by Klein- mann et al. analyzing the dataset generated by Chang et al., show that at 12 h post infection, the gene expression profiles are similar to the mock samples, and clear distinc- tions could only be made after 24 h, highlighting the ne- cessity of more sensitive methods for the examination of early events of HIV-1 infection.
It is challenging to properly compare our results to those presented in the scientific literature, since the commonly used starting time point examined is 48 h post infection, in case of HIV-1. However, considering the findings presented by different groups; either on HIV-1 or other RNA virus infections, our findings are in good agreement with previous studies analyzing transcriptomic and proteomic changes upon virus in- fection in these very early time points. The use of non-primary HIV-1 cell targets; such as HEK, and pseudotyped virions, and the application of data- dependent sampling [46], may indeed limit interpret- ation of the results. The utilization of other cell types and data acquisition methods with higher reproduci- bility; such as parallel reaction monitoring [2] or data independent acquisition [47], might give more accur- ate input data. In spite of the above limitations, we believe that this model of proteomic data evaluation serves as a good starting point for further develop- ment of algorithms implementing not only qualitative, but also quantitative data generated in a given prote- omic experiment, and that such a combination will undoubtedly aid in the understanding and deciphering of complex biological phenomena.
Conclusion
A weighted network model facilitating the use of both qualitative and quantitative data, acquired in a label- free proteomics experiment was generated and applied to examine the early host response to HIV-1. Upregu- lation of proteins involved in translation, transcription and DNA condensation in the early phase of the viral life-cycle could be observed, highlighting the utility of our weighted PPI network data analysis approach.
More studies are required to further demonstrate the utility of this new data-driven weighted network based analysis, and it should be noted that the current model has a serious limitation. The strength of different protein-protein interactions in the edge weight calculation; due to the lack of information, is not yet included. However, the applied weight-model can easily be extended to use this type of information as soon as any public database becomes available. We hope that this approach can open new ways for creat- ing algorithms, allowing for both quantitative and qualitative studies of proteome change in various
biological and pathological processes by quantitative mass spectrometry.
Methods
Production of viral particles
Viral particles were produced with some modifications of a previously utilized protocol [48]. Briefly, recombin- ant viruses were produced by transient transfection of 293 T cells (ATCC® CRL3216™) using pWOX-CMV-GFP (transfer vector plasmid), pMDLg/pRRE (packaging plas- mid), pRSV.rev (Rev-coding plasmid), and pMD. G (VSV-G envelope protein-coding plasmid). Vectors were a kind gift from D. Trono (University of Geneva Medical School, Geneva, Switzerland) [49], and were subse- quently modified by our research group [48]. Salmon sperm DNA (Sigma-Aldrich) was also added. Media containing virus particles was concentrated by Ultracel- 100 K Amicon Ultra Centrifugal Filter (Millipore), and stored in −70 °C. Quantity of pseudovirions produced was assessed by measurement of reverse transcriptase (RT) activity using a colorimetric kit (Sigma-Aldrich, Roche).
Transduction and sample collection
293 T cells in T-25 cell culture flasks were either mock- treated or transduced at 50% confluency with 5 ng RT equivalent of the HIV-based pseudovirions, in the pres- ence of 4μg/ml polybrene (Sigma-Aldrich), in 1 ml total volume, and incubated at 37 C°. After 0, 4, and 12 h, cells were trypsinized for 10 min, then washed tree times with ice-cold PBS to remove non-fused pseudovirion particles. The final pellet was suspended in 4 ml lysis buffer (150 mM sodium chloride, 1.0% Triton X-100, 0.5% sodium deoxycholate, 0.1% sodium dodecyl sulfate (SDS), and 50 mM Tris) pH 8.0, supplemented with cOmplete protease inhibitor cocktail (Sigma-Aldrich), incubated for 30 min at room temperature, centrifuged, and the supernatant was mixed with 24 ml cold (−20 C°) acetone and stored at−20 C° overnight.
Mass spectrometry analysis
The cleared cell lysates were acetone-precipitated with six volumes of cold acetone overnight. The precipitates were re-dissolved in 25 mM ammonium bicarbonate (Sigma-Aldrich) and digested in-solution with trypsin [50]. The tryptic fragments were used for replicate LC- MS/MS analyses at University of Arizona in Tucson, AZ, USA.
500 ng per 5μL injected protein lysate spiked with 300 fmol of Rhodobacter capsulatus cytochrome c T33 V mutant, was analyzed using a LTQ Orbitrap Velos mass spectrometer (Thermo Fisher Scientific) equipped with an Advion nanomate ESI source (Advion), after Omix (Agilent Technologies) C18 sample clean-up according
to the manufacturer’s instructions. Peptides were eluted from a C18 precolumn (100-μm × 2 cm, Thermo Fisher Scientific) onto an analytical column (75-μm × 10 cm, C18, Thermo Fisher Scientific) using a 165 min gradient of solvent A (water, 0.1% formic acid) and solvent B (acetonitrile, 0.1% formic acid). The flow rate was 500 nl/minute. Data-dependent analysis (DDA) was per- formed by the Xcalibur v 2.1.0 software [51] using a sur- vey mass scan at 60,000 resolution in the Orbitrap analyzer scanning mass/charge 350–1600, followed by collision-induced dissociation tandem mass spectrom- etry (MS/MS) at 35 normalized collision energy of the 14 most intense ions in the linear ion trap analyzer. Pre- cursor ions were selected by the monoisotopic precursor selection setting with selection or rejection of ions held to a +/−10 ppm window. Singly charged ions were excluded from MS/MS. Dynamic exclusion was set to place any se- lected m/z on an exclusion list for 45 s after a single MS/
MS. Tandem mass spectra were searched against the Uni- protKB/Swiss-Prot release available on December 12, 2014 without species restriction. At the time of the search, this database contained 459,734 entries. All MS/MS spectra were searched using Thermo Proteome Discoverer 1.3 (Thermo Fisher Scientific) considering fully tryptic peptides with up to 2 missed cleavage sites. Variable modifications considered during the search included methionine oxida- tion (15.995 Da), and cysteine carbamidomethylation (57.021 Da). The parent ion mass tolerance was 10 ppm, while the fragment tolerance was 0.8 Da. Proteins were identified at 99% confidence with XCorr score cut-offs [52]
as determined by a reversed database search. The protein and peptide identification results were validated with Scaf- fold v4.4.6. (Proteome Software Inc.) [1]. Peptide identifica- tions were accepted if they had greater than 89%
probability to achieve an FDR less than 0.1% by the Scaffold Local FDR algorithm. Protein identifications were accepted if they had greater than 99% probability and contained at least 2 identified peptides. Protein probabilities were assigned by the ProteinProphet algorithm [53]. Proteins that contained similar peptides and could not be differenti- ated based on MS/MS analysis alone were grouped to sat- isfy the principles of parsimony. Proteins sharing significant peptide evidence were grouped into clusters.
Protein quantification was done based on spectral count- ing; the quantitative values were generated by the Scaffold program based on the normalized total spectra. In case of protein clusters, each peptide was used only once for quan- tification for the first human protein in the cluster, as listed by Scaffold. All quantitative data were used for statistical analyses; none of the data points were removed.
Statistical analysis of proteomics data
For both statistical and network analysis, we used in- house developed R-software based on STRING [54–57],
circlize (https://jokergoo.github.io/circlize_book/book/), MASS [55], lsmeans [56], matrixStats [57], reshape2 [58]
and ggplot2 [59] packages. Assuming that data from technical repetitions are often characterized by Poisson distribution [60], and the large variances of biological replicas can be modelled by negative binomial distribu- tion [61], we used modified general linear models to de- scribe group-level differences in measured protein data in the 4 and 12 h time points. For each protein; after fit- ting negative binomial generalized linear model [55], we performed a post-hoc analysis [62] to characterize time- dependent mean differences by z score, and correctedp values for multiple comparisons.
Network analysis
Gene names of the identified human proteins were sub- jected to STRING database [22] and five PPI networks were generated. The NW0 combined proteins from mock- and HIV-1 plasmid-treated cell lysates collected at 0 time-point, the C04 and C12 networks contained proteins from the mock cells collected 4 and 12 h post- infection, respectively, while the H04 and H12 networks contained proteins from the HIV-1 treated cells col- lected at 4 and 12 h time-points, respectively. Very high confidence interactions (interaction score > 0.95) in be- tween the query proteins were used for the generation of each binary network. In these networks, the nodes were the proteins and the edges indicated the interactions be- tween proteins as they were present in STRING. For network generation, the SRING R-package and the STRING database was applied, and the 0.95 combined score value to generate the binary networks Bt,s (B0, B4h,C, B4h,H, B12h,C, B12h,H) corresponding to the protein sets. In these networks, the binary edges indicated only the possibility of the interactions, taking no notice of the quantity.
To estimate the real interaction density, binary net- works (Bt,s) generated by STRING were further modi- fied, and the amount of proteins measured by spectral counting was used to add wij weights to the edges. In this way, the existence of edges provides information on the existence of interaction, and the strength of protein pair’s interactions were estimated by this edge-weight model:
wi j¼ni ki
nj
kj ð1Þ
where wij represents the interaction density between protein Pi and Pj; ni, nj means the quantity while ki, kj
denote the degree (the number of edges) of Pi and Pjin the given Bt,sbinary network.
In this calculation, we used the measured data (ni, nj), which enabled us to alter the theoretical binary PPI
network into a realistic, sample related interaction net- work, in which the weights of the edges are in direct proportion to the quantities and in inverse proportion to all interaction possibilities of the connected proteins in the given sample.
Because we can consider the nias the number of mol- ecules of the protein Pi, the ni/ki ratio represents the number of Pimolecules involved in one interaction of Pi, and thus, the interaction density between Piand Pjcan be described by the product of ni/kiand nj/kj. It should be mentioned that the used edge-weight model in the absence of a strong interactor protein may overestimate the effect of other weak interactor proteins, also, inter- action strength data cannot be achieved in a classical quantitative proteomics experiment, and currently are unavailable in publicly accessible databases.
Functional subnetwork construction
In order to investigate the PPI networks of the proteins be- longing to GO (geneontology.org/) terms, we marked in each Wt,s the nodes by a function flag, which indicated whether or not the protein belongs to a given f-function; in our case, to a GO term. The so-called functional enrichment accord- ing to GO terms was done by STRING, using default set- tings and the Molecular Function, Biological Process and Cellular Component GO terms listed as enriched by STRING in C04, H04, C12 and H12, where at least 10 pro- tein per GO function in any of the networks was present, were considered. This procedure defined a sort of Wf t,s
functional networks, and divided them into two disjunctive sub-networks (Ff t,sfunctional, belonging to the GO term and NFf t,snon-functional not being part of the respective GO term), containing the functional and the non-functional nodes, respectively. Because of this separation, the edges (i.e.
the interactions) were also classified into three classes: func- tional edges between the functional nodes, non-functional edges between non-functional nodes and cross-edges in be- tween functional and non-functional nodes, depending on the f-markers of the connected proteins.
Examination of the global characteristics of the evaluated PPI networks
Any undirected weighted PPI network W(N,E) consists of two sets: N nodes and E edges. Each of the links (in- teractions) is defined by a couple of nodes (proteins) Pi
and Pj, and its value is wij. Since the direction of inter- action cannot be ordered, the connectivity matrix be- came symmetric: wij= wji.
Number of nodes (N) and edges (E)
N, Nf and Nn denotes the number of nodes (i.e. pro- teins) in the whole network and the functional and non- functional sub-networks, respectively, with the following relation:
N¼NfþNn ð2Þ
E denotes the number of edges (i.e. interactions) in the whole network. Ef and En are the number of edges within the functional and the non-functional sub- networks, respectively. The number of cross-edges (Ec) shows the connected proteins between the functional and the non-functional sub-networks. The edge numbers follow the next relation:
E¼EfþEnþEc ð3Þ
Network strength and averaged node strength (S)
We defined the network strength S as the total sum of the weights of edges:
S¼1 2
XN
i;j¼1wi;j ð4Þ
In the functional networks we can calculate strength of whole network (S), and the functional (Sf ) and non- functional sub-networks (Sn), as well. The sum of cross connection edges can be calculate as follows:
Sc¼S‐Sf‐Sn ð5Þ
Edge-weight density or strength density (D)
the edge-weight density measures how the weighted net- work is saturated by strong edges:
D¼ S
wmaxN Nð −1Þ 2
ð6Þ
In the functional networks we can measure the edge- weight density of the whole network (D) and the func- tional (Df ) and non-functional sub-networks (Dn), as well.
Edge-weight ratio (R): using the network strength we can define the edge-weight ratio parameter for the two sub-networks:
Rf ¼Sf
S ð7Þ
and the non-functional relative edge-weight density:
Rn¼Sn
S ð8Þ
Since the distribution of network parameters was not Gaussian or negative binomial, we used Wilcoxson tests [63] to characterize the group-related differences at the 4 and 12 h time points. The evaluatedp-values were cor- rected for multiple comparisons by false discovery rate methods [64].