A CLIMATE PROFILE INDICATOR BASED COMPARATIVE ANALYSIS OF CLIMATE CHANGE SCENARIOS WITH REGARD
TO MAIZE (ZEA MAYS L.) CULTURES
N.DIÓS1–K.SZENTELEKI1–A.FERENCZY1–G.PETRÁNYI1–L.HUFNAGEL2*
1Department of Mathematics and Informatics of Corvinus University of Budapest H-1118 Budapest, Villányi út 29-33, Hungary
(phone: +36-1-482-6261; fax: +36-1-466-9273)
2Adaptation to Climate Change” Research Group of the Hungarian Academy of Sciences H-1118 Budapest, Villányi út 29-33, Hungary
(phone: +36-1-482-6261; fax: +36-1-466-9273)
*Corresponding author e-mail: leventehufnagel@gmail.com
(Received 28th September 2009 ; accepted 24th November 2009)
Abstract. Using ecological data compiled from scientific literature on pest, pathogen and weed species characteristic in maize cultures in Hungary, we defined monthly climate profile indicators and applied them to complete a comparative analysis of the historical and modelled climate change scenario meteorological data of the city of Debrecen. Our results call attention to a drastic decline of the competitive ability of maize as compared to several C4 and especially C3 plants. According to the stricter scenarios, the frequency of potential pest and pathogen damage emergency situations will grow significantly by the end of the century.
Keywords: climate changes, agriculture, seasonality, new method
Introduction
Climate change of our planet has by now become an unquestionable fact accepted by all scientists. The general concepts regarding this change roughly coincide, though this is not true when taking smaller details – that might be of extreme importance for agricultural research – into account [16]. Recent research results let us conclude that climate change might have a significant effect on the yield of wheat, barley, rye, potato and maize, and the borderlines of their area of cultivation might shift 100-150 kilometres to the north [10]. The possible mass occurrence of new aggressive pest, pathogen and weed species in our country might also create a problem for plant protection [17].
Maize is one of our most important fodder-plants and Hungary has close on the largest total cultivating area in Europe. Maize is used in many ways, thus being of outstanding economic importance. In Hungary the conditions of maize cultivation are – except for the dry years – quite favourable in most cultural regions and complex cultivating technologies are available. It also might gain a significant role in the line of new environment-friendly alternative sources of energy. For these reasons, it is important to examine the influence of meteorological factors on maize ecosystems and this examination should include as many climate change scenarios and as long a time series as possible.
Materials and Methods
We may study the impact of climate change on maize ecosystems and the consequent changes of the risk of potential plant protection emergency situations using various alternative research methods, each characterised by different limitations. Modelling by species is an unsuitable method, as only the modelling of maize – though it is quite well known and some maize-simulation model types already exist – is a great enough challenge for scientists. A statistical analysis of the past data of pests would equally not provide true results, as the 50s, 60s and 70s were characterised by an excessive use of chemicals, while protection later on was rather based on prognostics.
In the course of our research we compiled from Hungarian scientific literature the pest, pathogen and segetal weed species potentially occurring in Hungarian maize ecosystems and also surveyed their ecological needs. Using these we created monthly climate profile indicators to be able to make a comparative analysis of the relative frequencies of potential plant protection emergency situations. We introduced the concept of climate profile indicator based on our methodological research. In our study we completed a comparative analysis of the historical and modelled scenario meteorological data of Debrecen, based on monthly climate profile indicators.
Data concerning pest, pathogen and weed species of maize ecosystems were collected from as many Hungarian sources as possible [1, 3, 5, 7, 8, 11, 12, 13, 14, 18, 19, 20, 21,25, 26]. The abovementioned works are characterised by different structures, some of them list pest species, micro organisms or weeds by taxonomic order, others group them by host plants. But they all have one thing in common: they all provide more or less detailed descriptions of the biological and ecological needs of the given harmful creatures.
These descriptions of the climatic needs of harmful creatures have rarely yielded exact numbers, instead they report on the warm or cold, wet or dry circumstances favourable for their occurrence or reproduction in the given month or season. While converting these descriptions into numerical data, we took the many years’ mean meteorological data of the base period of the description as a reference. We tried to primarily rely upon data from Hungarian scientific literature, but in some of the cases, for the refinement of data we also took statements of the international literature into consideration. Unfortunately, data concerning the climatic needs taken from international scientific literature are not always applicable for the area of the Carpathian-basin, due to their different ecological and biogeographical characteristics.
The monthly mean temperature and precipitation values concerning the present climate of Debrecen were taken from the monitoring network database of the Hungarian Meteorological Service (OMSZ). A series of data were at our disposal complete from 1952 to 1992.
The change of climate is studied by scientists using climate models. International simulation experiments using these models result in climate scenarios. A scenario is a consistent and realistic description of a possible future state of the world. It is not a prediction, but rather an alternative picture of future climate. Scenarios are the final results of 3D numerical General Circulation Models (GCM). They are usually created as a solution of Navier-Stokes partial differential equation systems defined for the cells of a vertically 10-20 times multilayered 250-600 km grid, considering the laws of energy and mass conservation. The solution of these complicated and robust systems of differential equations is only possible with the help of high capacity computers, so only larger institutes are capable of running these models.
Although the starting parameters are the same, it is interesting that the different runs of the models produce different results [2]. Because of this, we examined in our study runs of the United Kingdom Met Office Hadley Centre and also those of the American Geophysical Fluid Dynamics Laboratory. The scenario called BASE is the run of the Hadley Centre simulated with current conditions, forming the base for further scenarios.
We also used data series of the recently created new model runs, representing the latest results of Central European climate modelling. Thus, to analyse the climate of Debrecen, we used UKHI (1990) and UKLO (1987) balanced, UKTR (1992) transient, as well as HCA2 and HCB2 scenarios of the HadCH3 (1998) climate change model created by the United Kingdom Met Office (UKMO) Hadley Centre (England), MPA2 scenario by the Max Planck Institute für Meteorologie (MPI-M, Germany), and GFDL2534 (1991) (=GF2), GFDL5564 (1991) (=GF5) and Base scenarios of the Geophysical Fluid Dynamics Laboratory (GFDL, USA).
For the definition and evaluation of monthly climate profile indicators we used KKT, a software and database created by [22]. The software works with special data handling functions, thus being perfectly suitable for the handling of a great mass of data.
We introduced the concept of climate profile indicator based on our methodological research. By climate profile indicator we mean the seasonal pattern of the climatic needs of a certain species. Climate profile indicators may be of different temporal resolutions. During this work, we only applied monthly climate profile indicators, assigning monthly precipitation and temperature need values to the 12 months of the year.
Based on literature data we used KKT to generate 55 monthly climate profile indicators and named them after their serial number. Each monthly climate profile saved in the computer can be considered as an individual indicator that could be used to classify both real historical and official climate scenario meteorological data.
The climate profile is consisted of 3 – minimum, mean and maximum – temperature – and one precipitation data. For every month we defined the lower and higher limit of the 4 meteorological parameters mentioned above, meaning 96 data, 8 parameters for each 12 months.
After the selection of the appropriate meteorological database uploaded in the software, we may apply further limitations concerning the annual (year to year) and seasonal (month to month) period of investigation. The historical meteorological data set of Debrecen has been incomplete since 1993, so we restricted the evaluation of monthly profiles for the period between 1951 and 1992. (Fig. 1.)
Having selected the preferred profile from the previously defined indicators, we could start with the evaluation of climate profile indicators. Our question was in how many years do the defined climate profiles come true regarding historical meteorological data of the 1951-1992 period and 31 years of applied scenario data. With the help of the software for each parameter we received a result, namely, an answer to the question whether the defined monthly conditions did or did not come true in the given year. (Fig.
2.)
Figure 1. Monthy data list of DEB_LATOKEP used for the evaluation of monthly climate profile indicators
Figure 2. The database of the annual evaluation of monthly climate profile indicators
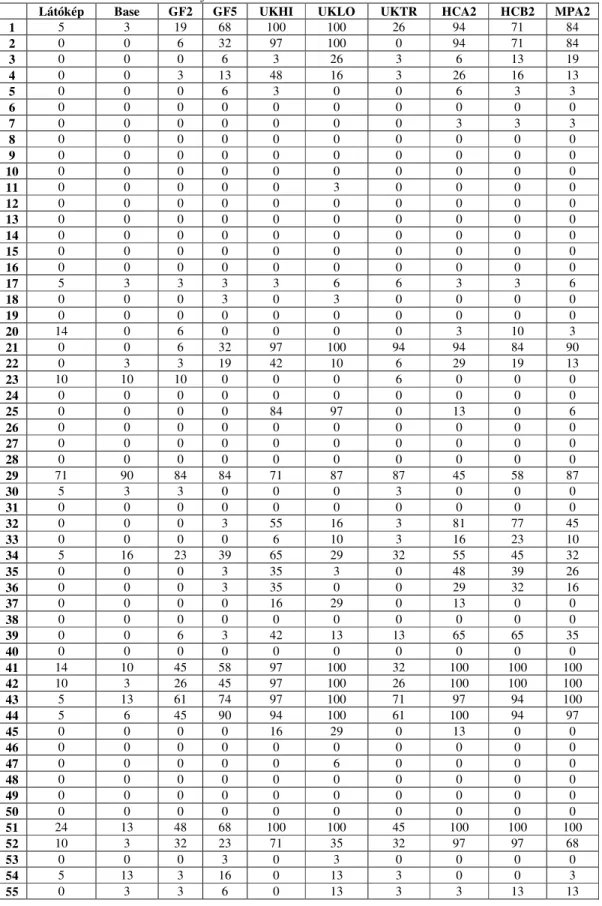
Table 1. Relative frequencies of monthly climate profile indicators concerning historical and modelled scenario data of Debrecen
Látókép Base GF2 GF5 UKHI UKLO UKTR HCA2 HCB2 MPA2
1 5 3 19 68 100 100 26 94 71 84
2 0 0 6 32 97 100 0 94 71 84
3 0 0 0 6 3 26 3 6 13 19
4 0 0 3 13 48 16 3 26 16 13
5 0 0 0 6 3 0 0 6 3 3
6 0 0 0 0 0 0 0 0 0 0
7 0 0 0 0 0 0 0 3 3 3
8 0 0 0 0 0 0 0 0 0 0
9 0 0 0 0 0 0 0 0 0 0
10 0 0 0 0 0 0 0 0 0 0
11 0 0 0 0 0 3 0 0 0 0
12 0 0 0 0 0 0 0 0 0 0
13 0 0 0 0 0 0 0 0 0 0
14 0 0 0 0 0 0 0 0 0 0
15 0 0 0 0 0 0 0 0 0 0
16 0 0 0 0 0 0 0 0 0 0
17 5 3 3 3 3 6 6 3 3 6
18 0 0 0 3 0 3 0 0 0 0
19 0 0 0 0 0 0 0 0 0 0
20 14 0 6 0 0 0 0 3 10 3
21 0 0 6 32 97 100 94 94 84 90
22 0 3 3 19 42 10 6 29 19 13
23 10 10 10 0 0 0 6 0 0 0
24 0 0 0 0 0 0 0 0 0 0
25 0 0 0 0 84 97 0 13 0 6
26 0 0 0 0 0 0 0 0 0 0
27 0 0 0 0 0 0 0 0 0 0
28 0 0 0 0 0 0 0 0 0 0
29 71 90 84 84 71 87 87 45 58 87
30 5 3 3 0 0 0 3 0 0 0
31 0 0 0 0 0 0 0 0 0 0
32 0 0 0 3 55 16 3 81 77 45
33 0 0 0 0 6 10 3 16 23 10
34 5 16 23 39 65 29 32 55 45 32
35 0 0 0 3 35 3 0 48 39 26
36 0 0 0 3 35 0 0 29 32 16
37 0 0 0 0 16 29 0 13 0 0
38 0 0 0 0 0 0 0 0 0 0
39 0 0 6 3 42 13 13 65 65 35
40 0 0 0 0 0 0 0 0 0 0
41 14 10 45 58 97 100 32 100 100 100
42 10 3 26 45 97 100 26 100 100 100
43 5 13 61 74 97 100 71 97 94 100
44 5 6 45 90 94 100 61 100 94 97
45 0 0 0 0 16 29 0 13 0 0
46 0 0 0 0 0 0 0 0 0 0
47 0 0 0 0 0 6 0 0 0 0
48 0 0 0 0 0 0 0 0 0 0
49 0 0 0 0 0 0 0 0 0 0
50 0 0 0 0 0 0 0 0 0 0
51 24 13 48 68 100 100 45 100 100 100
52 10 3 32 23 71 35 32 97 97 68
53 0 0 0 3 0 3 0 0 0 0
54 5 13 3 16 0 13 3 0 0 3
55 0 3 3 6 0 13 3 3 13 13
After the yearly evaluation of the monthly climate profile indicators with the KKT software we summarized the results in an Excel table. At first, we recorded in a table the number of fulfilments of all monthly climate profile indicators in the examined years, for all scenarios. Afterwards, we calculated the relative frequencies of these indicators. The obtained table of results (Table 1.) we compared with multivariate pattern analytic methods, both from the aspect of objects and variables, using the statistical software package Past (PAST – PAlaeontological STatistics, ver. 1.79, [9].
We analysed the columns (objects, i.e. climatic data series) and rows (variables, i.e.
indicators) of the table by hierarchical cluster analysis – a method of classification – and by non-metric multi dimensional scaling (NMDS) – a method of ordination. We verified the results by graphically projecting the classifications and ordinations onto each other, then, based on verified cluster orders, we applied a two-way clustering for the re- arrangement of tables.
Results and Discussion
Definition of Monthly Climate Profile Indicators
As a result of synthesizing literature data, we created a classified numerical database, introducing 55 monthly climate profile indicators (Table 5.). including information on 91 species. Besides maize, the species under examination included 23 zoological pests (Table 2.), 12 pathogenic micro-organisms (Table 3.) and 55 weed species (Table 4.) typically occurring in maize cultures. The tables list the species in taxonomic order.
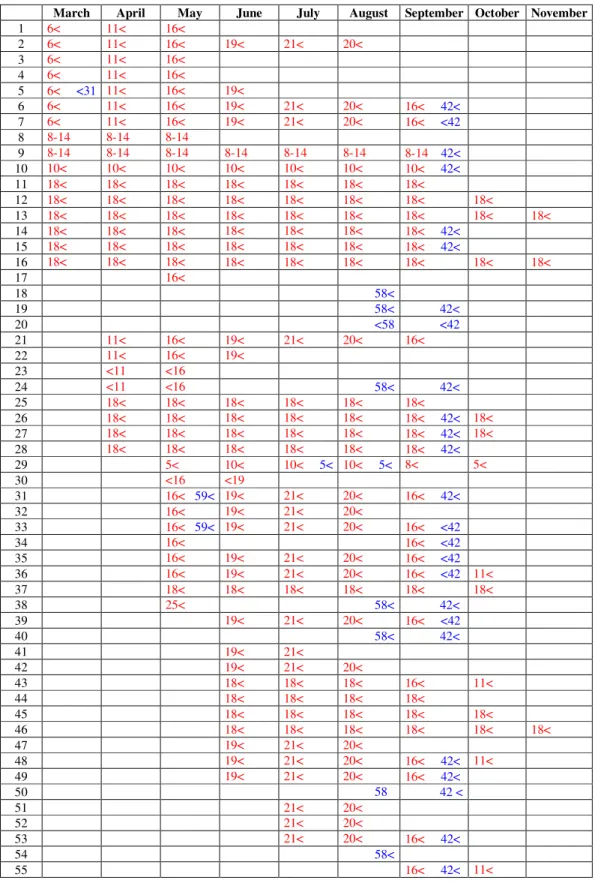
Table 5. lists the 55 monthly climate profile indicators, the red numbers showing temperature and the blue ones precipitation values. Relation marks indicate if the given indicators demand of temperature or precipitation is higher or lower. The values were established as follows: if we found in literature that e.g. a warm and dry spring was favourable for a given creature, then we recorded the mean temperature and precipitation values with the appropriate relation marks for all the spring months. The profiles of weed species were created after their growth form, this way the 55 species were divided into groups, containing different numbers of weeds.
Table 2. Most important zoological pests of maize in Hungary and their indicators (ISN: serial number of climate profile indicators)
SCIENTIFIC NAME ISN HUNGARIAN NAME Ditylenchus dipsaci 18 Szár-fonálféreg
Melanogryllus desertus 35 Fekete tücsök Gryllotalpa gryllotalpa 35 Lótücsök Dociostaurus maroccanus 32 Marokkói sáska Tetraneura ulmi 34 Kukorica-gyökértetű Rhopalosiphum maidis 5 Zöld kukorica -levéltetű Rhopalosiphum padi 5 Zselnicemeggy-levéltetű Schizaphis graminum 5 Zöld gabona-levéltetű Aphis fabae 6 Fekete répa-levéltetű Myzus persicae 5 Zöld őszibarack-levéltetű Zabrus tenebrioides 54 Gabonafutrinka
Opatrum sabulosum 20 Sároshátú gyászbogár
Amphimallon solstitalis 41 Közönséges júniusi cserebogár Melolontha melolontha 22 Májusi cserebogár
Melolontha hippocastani 22 Erdei cserebogár Anoxia pilosa 22 Pusztai cserebogár Polyphilla fullo 54 Kalló cserebogár Diabrotica virgifera virgifera 39 Amerikai kukoricabogár Psalidium maxillosum 3 Fekete barkó
Tanymecus dilaticollis 17 Kukoricabarkó Ostrinia nubilalis 33 Kukoricamoly Autographa gamma 36 Gamma-bagolylepke Heliothis maritima 36 Somkóró-bagolylepke Helicoverpa armigera 36 Gyapottok-bagolylepke Mamestra brassicae 36 Káposzta-bagolylepke Scotia segetum 36 Vetési-bagolylepke Oscinella frit 23 Fritlégy
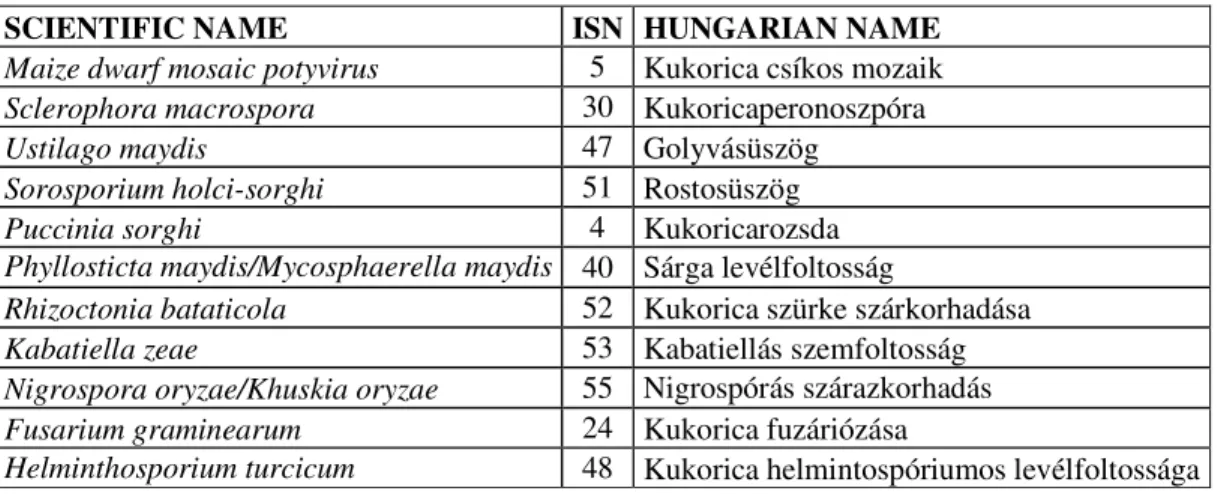
Table 3. The most important pathogenic micro-organisms of maize in Hungary and their indicators (ISN: serial number of climate profile indicators)
SCIENTIFIC NAME ISN HUNGARIAN NAME Maize dwarf mosaic potyvirus 5 Kukorica csíkos mozaik Sclerophora macrospora 30 Kukoricaperonoszpóra
Ustilago maydis 47 Golyvásüszög
Sorosporium holci-sorghi 51 Rostosüszög
Puccinia sorghi 4 Kukoricarozsda
Phyllosticta maydis/Mycosphaerella maydis Mycosphaerella zeae-maydis
40 Sárga levélfoltosság
Rhizoctonia bataticola 52 Kukorica szürke szárkorhadása
Kabatiella zeae 53 Kabatiellás szemfoltosság
Nigrospora oryzae/Khuskia oryzae 55 Nigrospórás szárazkorhadás Fusarium graminearum 24 Kukorica fuzáriózása
Helminthosporium turcicum 48 Kukorica helmintospóriumos levélfoltossága
Table 4.The most important segetal weeds occurring in maize cultures in Hungary and their indicators (ISN: serial number of climate profile indicators)
SCIENTIFIC NAME ISN HUNGARIAN NAME Equisetum arvense 19 Mezei zsurló
Portulaca oleracea 28 Kövér porcsin Atriplex patula 46 Terebélyes laboda Atriplex tatarica 13 Tatár laboda Chenopodium album 15 Fehér libaparéj Chenopodium hybridum 15 Pokolvar libaparéj Chenopodium polyspermum 15 Hegyes levelű libatop Amaranthus albus 14 Fehér disznóparéj Amaranthus blitoides 46 Henye disznóparéj Amaranthus clorostachys 25 Karcsú disznóparéj Amaranthus retroflexus 25 Szőrös disznóparéj Bilderdykia convolvulus 11 Ugari szulákpohánka Polygonum lapathifolium 15 Lapulevelű keserűfű Polygonum persicaria 15 Baracklevelű keserűfű Cannabis sativa 2 Kender
Lathyrus tuberosus 21 Mogyorós lednek Mercurialis annua 43 Egynyári szélfű Capsella bursa-pastoris 10 Pásztortáska Diplotaxis muralis 46 Fali kányazsázsa Raphanus raphanistrum 8 Repcsényretek Sinapis arvensis 9 Vadrepce
Reseda lutea 42 Vadrezeda
Abutilon theophrasti 45 Selyemmályva Hibiscus trionum 28 Varjúmák Anagallis arvensis 15 Mezei tikszem Convolvulus arvensis 31 Apró szulák Datura stramonium 43 Csattanó maszlag Heliotropium europaeum 49 Parlagi kunkor Symphytum officinale 19 Fekete nadálytő Plantago major 19 Nagy útifű Ajuga chamaepitys 11 Kalinca ínfű Stachys annua 15 Tarlóvirág Ambrosia elatior 13 Parlagfű Cirsium arvense 50 Mezei aszat Galinsoga parviflora 11 Kicsiny gombvirág Matricaria inodora 16 Ebszékfű
Xanthium italicum 12 Olasz szerbtövis Sonchus arvensis 44 Mezei csorbóka Sonchus asper 44 Szúrós csorbóka
Elymus repens 1 Tarackbúza
Phragmites communis 19 Nád Cynodon dactylon 7 Csillagpázsit Eragrostis spp. 37 Tőtippan fajok Digitaria sanguinalis 38 Pirok ujjasmuhar Echinochloa crus-galli 37 Közönséges kakaslábfű Panicum miliaceum 1 Termesztett köles Setaria glauca 27 Fakó muhar
Setaria media 46 Tyúkhúr
Setaria verticillata 45 Ragadós muhar Setaria viridis 26 Zöld muhar Sorghum halapense 1 Fenyércirok
Table 5.Monthly climate profile indicators (Budapest, 2008) (red: temperature data, blue:
amount of precipitation)
March April May June July August September October November
1 6< 11< 16<
2 6< 11< 16< 19< 21< 20<
3 6<
31< 11<
44< 16<
59<
4 6<
31<
11<
<44
16<
<59
5 6< <31 11<
<44 16<
<59 19<
<72
6 6<
31<
11<
44<
16<
59<
19<
72<
21<
60<
20<
58< 16< 42<
7 6<
<31
11<
<44
16<
<59
19<
<72
21<
<60
20<
<58
16< <42
8 8-14
31<
8-14 44<
8-14
59<
9 8-14
31<
8-14 44<
8-14 59<
8-14 72<
8-14 60<
8-14
58< 8-14 42<
10 10<
31< 10<
44< 10<
59< 10<
72< 10<
60< 10<
58< 10< 42<
11 18< 18< 18< 18< 18< 18< 18<
12 18< 18< 18< 18< 18< 18< 18< 18<
13 18< 18< 18< 18< 18< 18< 18< 18< 18<
14 18< 18< 18< 18<
72<
18<
60<
18<
58<
18< 42<
15 18<
31< 18<
44< 18<
59< 18<
72< 18<
60< 18<
58< 18< 42<
16 18<
31<
18<
44<
18<
59< 18< 18< 18< 18< 18< 18<
17
<31
<44 16<
59<
18 31<
44<
59<
72<
60< 58<
19
31<
44<
59<
72<
60< 58< 42<
20
<31
<44
<59
<72
<60 <58 <42
21 11< 16< 19< 21< 20< 16<
22 11<
<44 16<
<59 19<
<72
23 <11
44<
<16 59<
24 <11
44<
<16 59<
<60
58< 42<
43<
25 18< 18< 18< 18< 18< 18<
26 18< 18< 18<
72<
18<
60<
18<
58<
18< 42< 18<
43<
27 18<
44< 18<
59< 18<
72< 18<
60< 18<
58< 18< 42< 18<
43<
28 18<
44<
18<
59<
18<
72<
18<
60<
18<
58< 18< 42<
29 5< 10< 10< 5< 10< 5< 8<
<100 5<
<100
30 <16
59<
<19
72<
31 16< 59< 19<
72< 21<
60< 20<
58< 16< 42<
32 16< 19<
<72 21<
<60 20<
<58
33 16< 59< 19<
<72
21<
<60
20<
<58
16< <42
34 16<
<59 16< <42
35 16<
<59
19<
<72
21<
<60
20<
<58 16< <42
36 16<
<59 19<
<72 21<
<60 20<
<58 16< <42 11<
<43
37 18< 18< 18< 18< 18< 18<
38 25<
59<
72<
60<
58< 42<
43<
39 19<
<72 21<
<60 20<
<58 16< <42
40
59<
72<
60<
58< 42<
43<
41 19< 21<
42 19< 21< 20<
43 18< 18< 18< 16< 11<
44 18< 18< 18< 18<
45 18< 18< 18< 18< 18<
46 18< 18< 18< 18< 18< 18<
47 19<
72<
21<
60<
20<
58<
48 19<
72< 21<
60< 20<
58< 16< 42< 11<
43<
49 19<
72<
21<
60<
20<
58< 16< 42<
50
72<
60<
58
<
42 <
51 21< 20<
52 21<
<60
20<
<58
53 21<
60< 20<
58< 16< 42<
54
60< 58<
55 16< 42< 11<
43<
A Comparative Analysis of the Historical and Modelled Meteorological Data of Debrecen
We used the statistical software package PAST for the analysis of the relative frequency table (Table 1.) regarding the monthly climate profile indicators for the historical and modelled scenario data of Debrecen.
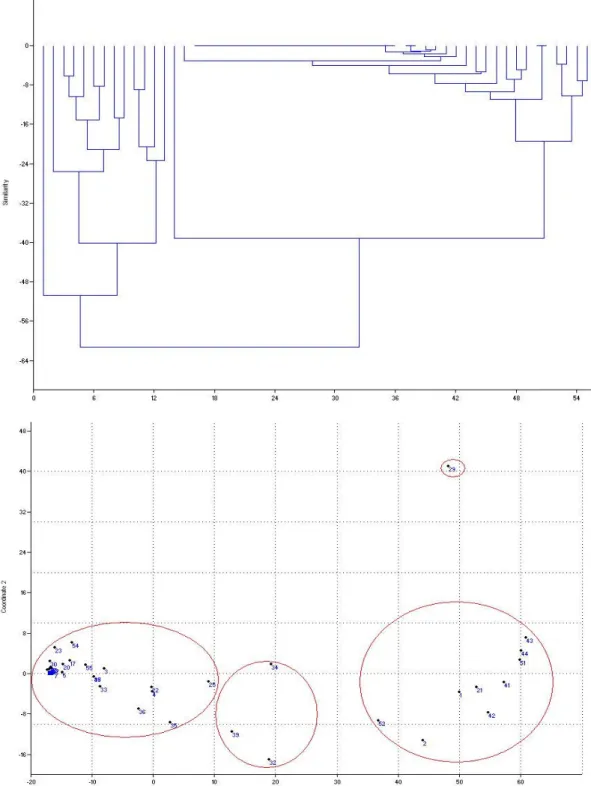
The dendrogram (Fig. 3 a) shows the classification of the monthly climate profile indicators. We can see that the indicators (1, 2, 21, 29, 41, 42, 43, 44, 51) preferring warm springs or/and summers without any precipitation demands (e.g. Datura stramonium, Sonchus species, Sorosporium holci-sorghi, Reseda lutea, Elymus repens, Lathyrus tuberosus, Zea mays) belong to one big group which is closely related to the indicators (32, 34, 39, 52) demanding hot dry summers (e.g..: Dociostaurus maroccanus, Tetraneura ulmi, Diabrotica virgifera virgifera, Rhizoctonia bataticola).
Indicators (4, 22, 25, 35, 36) demanding warm and dry spring or/and summer (e.g.:
Helicoverpa armigera, Gryllotalpa gryllotalpa, Melolontha species, Puccinia sorghi, Amaranthus species) are linked to the group of indicators demanding warmth and various amounts of precipitation in the spring and summer (e.g. Nigrospora oryzae, Kabatiella zeae, Ustilago maydis, Abutilon theophrasti, Ostrinia nubilalis, Tanymecus dilaticollis, Ditylenchus dipsaci). The lower part of figure (Fig. 3 b) shows the position of indicators after the dimension reduction by NMDS, the elements of the groups are exactly the same as those of the groups produced by cluster analysis in higher dimensions of space.
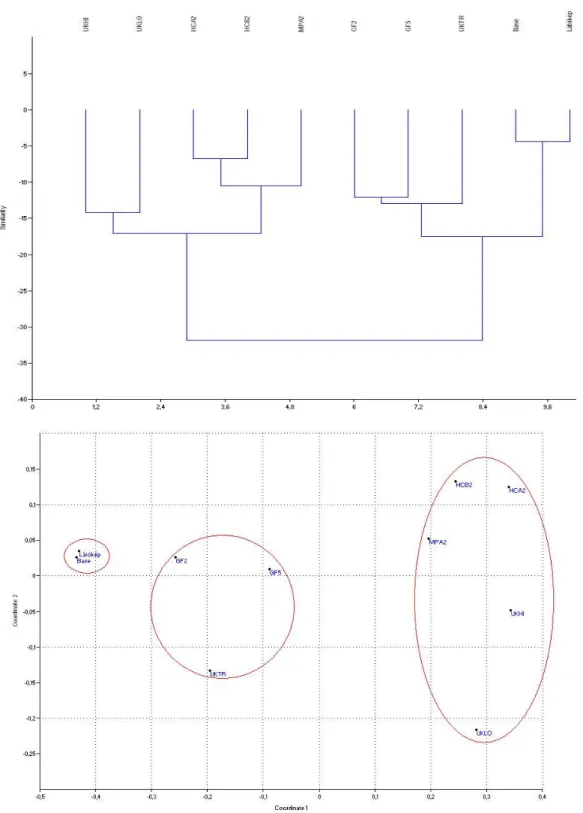
After the results of the monthly climate profile indicator based evaluation of the model runs for the scenarios of Debrecen and the classification and ordination of data we found that data may be divided into two larger groups (Fig. 4 a). The first group includes the historical data of Debrecen (Látókép), the Base scenario fitted on past data and the scenarios GF2, GF5 and UKTR calculating with a moderate change of climate.
The second group is formed by balanced models (UKHI, UKLO) and the scenarios originating from the PRUDENCE project (HCA2, HCB2, MPA2), both calculating with a significant change of climate. Inside the two larger groups well identifiable sub- groups can be recognized. In the first group the data series Látókép and Base are much similar, being closer to each other than to any other scenarios. This fact supports the reliability of the models applied. Inside the group scenarios calculating with a more significant climate change, regional data series of the PRUDENCE project (HCA2, HCB2, MPA2) are separated from the older balanced models (UKHI, UKLO).
Ordination (Fig. 4 b) also shows us the model runs calculating with more and more serious changes of climate getting further and further away from the data of the historical base period. The picture may be considered as a proof for the applied monthly climate profile indicators being suitable for the efficient evaluation of information lying inside model runs.
Figure 3.a, Classification of monthly climate profile indicators based on historical and modelled scenario meteorological data of Debrecen, by cluster analysis b, Ordination of
monthly climate profile indicators including the projection of groups created by cluster analysis, based on historical and modelled scenario meteorological data of Debrecen, by
NMDS
Figure 4.a, Classification of monthly climate profile indicators based on historical and modelled scenario meteorological data of Debrecen, by hierarchic cluster analysis b, Ordination of monthly climate profile indicators including the projection of groups created by classification, based on historical and modelled scenario meteorological data of Debrecen, by
NMDS
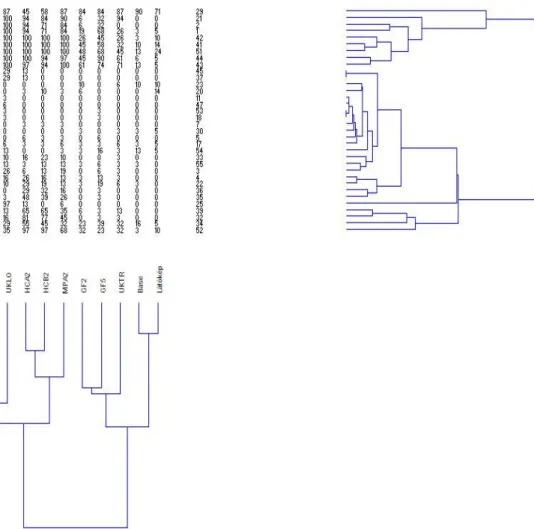
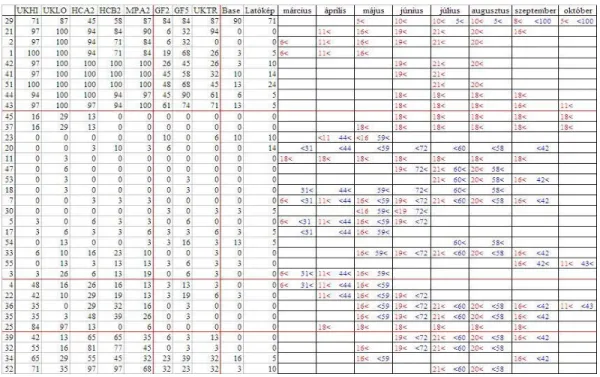
Fig. 5 and Table 6. shows a two-way cluster analysis of the monthly climate profile indicators and the meteorological data of scenarios for Debrecen. Rows were created by a classification of monthly climate profile indicators, as columns by one of the data of the Debrecen scenarios. Indicators containing only 0 values and thus no information were excluded from the analysis. We found Base scenario being much similar to the historical meteorological data of Látókép. This proves, that Base scenario simulated using present conditions may form a suitable basis for the other scenarios.
The relative frequency of all indicators falls between 0-24% for Base and Látókép data. In the case of GF2, GF5 and UKTR scenarios, indicators with warm spring and/or summer temperature and no precipitation demands (e.g. Datura stramonium, Sonchus fajok, Sorosporium holci-sorghi, Reseda lutea, Elymus repens, Lathyrus tuberosus) had a relative frequency of 19-94%. Indicators needing warm and dry summers (e.g.
Dociostaurus maroccanus, Tetraneura ulmi, Diabrotica virgifera virgifera, Rhizoctonia bataticola) came up with a relative frequency of 0-39% at these scenarios, and those needing warm and dry spring and/or summer (e.g. Helicoverpa armigera, Gryllotalpa gryllotalpa, Amaranthus species, Melolontha species, Puccinia sorghi) with a relative frequency of 0-19%.
Figure 5. Two-way cluster classification of monthly climate profile indicators and the historical and modelled scenario meteorological data of Debrecen
Table 6.The result of two-way classification of monthly climate profile indicators and the historical and scenario meteorological data of Debrecen, including the monthly climate profile indicators
In the case of scenarios UKHI, UKLO, HCA2, HCB2, MPA2, indicators with warm spring and/or summer but no precipitation demands (pl.: Datura stramonium, Sonchus species, Sorosporium holci-sorghi, Reseda lutea, Elymus repens, Lathyrus tuberosus) occured with a relative frequency of 32-100%. Indicators needing warm and dry spring and/or summer (e.g. Helicoverpa armigera, Melanogryllus desertus, Amaranthus species, Melolontha species, Puccinia sorghi) showed a relative frequency of 13-48%.
Maize (Zea mays) indicated a relative frequency of 45-90% for historical and modelled scenarios.
Based on literature, C3 plants are much more sensitive to a higher CO2 concentration than C4 plants (Fuhrer, 2003). According to our own studies, the monthly climate profile indicator of C4 maize was the only one indicating a significant decline of its high present relative frequency with climate change, although the interpretation of decline is more difficult than that of growth, as here we can not consider the possibility of the phenological acclimatization of maize or the adaptation effect of breeding. Still, the results indicate the rise of the risk of abiotic damages (direct climatic effect) of maize.
On the other hand, in the case of more C3 and C4 weed species, the relative frequency of the years suitable for their monthly climate profile indicators is significantly rising, from the current low value to even 90-100%. As literature information, the result also calls our attention to the drastic decline of the competitive abilities of maize, as compared to numerous C4 and especially C3 plants. Of C3 plants the weed species Elymus repens, Abutilon theophrasti, Datura stamonium (represented by indicators 1, 43, 45) should be mentioned, along with C4 Sorghum halapense, Amaranthus retroflexus, Echinochloa crus-galli (1, 25, 37). Of these species Elymus repens, Datura stramonium, Sorghum halapense, Amaranthus retroflexus, Echinochloa crus-galli have already been considered as the most important weeds of maize cultures in the past [3].
Being one of the most important pests of maize, the development of the larvae of the European Corn Borer (Ostrinia nubilalis) depends on heat units, growing faster in higher temperature [24]. According to our study the frequency of potential damage emergency situations of Ostrinia nubilalis will be significant by the end of the century, primarily regarding scenarios calculating with a stronger change of climate (UKLO, UKHI, HCA2, HCB2, MPA2). Occurring in Hungary in 1995, the successful European acclimatization of Diabrotica virgifera virgifera is due to the dry and arid climatic conditions of Central Europe [15]. Based on scenario data, the risk of potential damages caused by this species will be considerably high. Scarce-Bordered Straw (Helicoverpa armigera, indicator 36) has been a regular - and in dry years serious - agricultural pest in Hungary since 1993 [23]. According to the scenarios counting with a stronger change, the risk of potential damage of this species will also grow significantly.
In view of pathogen micro-organisms, autumnal, winter and spring low temperatures may be considered as limiting factors, as in the summer, precipitation is the most important [4, 6]. According to our study, the risk of potential damage emergency situation of Maize dwarf mosaic potyvirus, Puccinia sorghi, Sorosporium holci-sorghi, Rhizoctonia bataticola and Nigrospora oryzae (indicators 4, 5, 51, 52, 55) will grow significantly. In case of Sorosporium holci-sorghi this growth might reach 100% by the end of the century.
We must emphasize that though our indicators represent the best information sources available, the interpretation of the results requires certain awareness, considering the unsatisfactory literature data and the way of turning them into numerical data. We also have to keep in mind that our study calculated only with temperature and precipitation data, leaving CO2 concentration – obviously changing with climate change – and radiation out of consideration. Our presumption that the behaviour of pathogen, pest and weed species will be constant regarding climate is also a simplification, not counting with the physiological, phonological, biochemical and onto-genetic acclimatization, or adaptation at the population genetic level. As a consequence, in the comparative analysis of historical and scenario climates using profile indicators only the rise of relative frequencies is of professional importance. Namely, in this case, the rise means the rise of the frequency of potential damage situations even if we do not consider the adaptive ability of the plant. On the other hand, the stagnancy or decrease of this value does not mean that the risk of emergency in question may not grow.
Acknewledgements: This research was supported by the “Bolyai János” Research Fellowship (Hungarian Academy of Sciences) and the Research Assistant Fellowship (Corvinus University of Budapest).
REFERENCES
[1] Antal, J. (2005): A növénytermesztés alapjai Gabonafélék. – Mezőgazda Kiadó, Budapest.
[2] Bartholy, J. (2005): A PRECIS regionális klímamodell és adaptálása az ELTE Meteorológiai Tanszékén. – 31. Meteorológiai Tudományos Napok.
[3] Bihari, F., Kádár, A., Dimitrievics, Gy., Bíró, K. (1982): Gyomirtás – vegyszeres termésszabályozás. – Mezőgazdasági Kiadó, Budapest.
[4] Boland, G.J., Melzer, M.S., Hopkin, A., Higgins, V., Nassuth, A. (2004): Climate Change and Plant diseases in Ontario. – Can. J. Plant Pathol. 26: 335-350.
[5] Érsek, T., Gáborjányi, R. (1998): Növénykórokozó mikroorganizmusok. – ELTE Eötvös Kiadó, Budapest.
[6] Fuhrer, J. (2003): Agroecosystem responses to combinations of elevated CO2, ozone, and global climate change. – Agriculture, Ecosystems and Environment 97: 1–20.
[7] Glits, M., Folk, Gy. (2000): Kertészeti növénykórtan. – Mezőgazda Kiadó, Budapest.
[8] Glits, M., Horváth, J., Kuroli, G., Petróczi, I. (1997): Növényvédelem. – Mezőgazda Kiadó, Budapest.
[9] Hammer, O., Harper, D.A.T. (2005): Paleontological Data Analysis. – Blackwell.
[10] Harnos, Zs., Láng, I.(2007): A klímaváltozás lehetséges hatásai az agráriumra. – Agrofórum.
[11] Horváth, J. (1995): A szántóföldi növények betegségei. – Mezőgazda Kiadó, Budapest.
[12] Hunyadi, K., Béres, I., Kazinczi, G. (2000): Gyomnövények, gyomirtás, gyombiológia. – Mezőgazda Kiadó, Budapest.
[13] Jenser, G., Mészáros, Z., Sáringer, Gy. (1998): A szántóföldi és kertészeti növények kártevői. – Mezőgazda Kiadó, Budapest.
[14] Jermy, T., Balázs, K. (1994): A növényvédelmi állattan kézikönyve. – Akadémiai Kiadó, Budapest.
[15] Keszthelyi, S., Szabó, T., Kurucsai, P. (2007): Az amerikai kukoricabogár (Diabrotica virgifera virgifera LeConte) kártételének vizsgálata. – Növényvédelem 43: 345-351.
[16] Ladányi, M. (2006): Folyamatszemléleti lehetőségek az agro-ökoszisztémák modellezésében. – PHD értekezés.
[17] Láng, I. (szerk., 2007): VAHAVA projekt összefoglalás.
[18] Mészáros, Z., Haltrich, A., Markó, V., Ördögh, G. (2005): Növényvédelmi állattan gyakorlati jegyzet.
[19] Petróczi, I. (1982): Szántóföldi növényvédelem. – Mezőgazda Kiadó, Budapest.
[20] Radics, L. (1996): Szántóföldi növénytermesztés. – Mezőgazda Kiadó, Budapest.
[21] Seprős, I. (2001): Kártevők elleni védekezés I. – Mezőgazdasági Szaktudás Kiadó, Budapest.
[22] Szenteleki, K. (2007): A „Környezet-Kockázat-Társadalom” (KLIMAKKT) klímakutatás. – „KLÍMA-21” Füzetek 51: 89-115.
[23] Szeőke, K. (2007): A gyapottok-bagolylepke új kártételi stratégiája – Növényvédelem 43:
424.
[24] Trnka, M., Muška, F., Semerádová, D., Dubrovský, M., Kocmánková, E., Žalud, Z.
(2007): European Corn Borer life stage model: Regional estimates of pest development and spatial distribution under present and future climate. – Ecological modelling 207: 61- 84.
[25] Ujvárosi, M. (1973): Gyomirtás. – Mezőgazdasági Kiadó, Budapest.
[26] Ujvárosi, M. (1973): Gyomnövények. – Mezőgazdasági Kiadó, Budapest.