ANALYSIS OF CLIMATE CHANGE SCENARIOS BASED ON MODELLING OF THE SEASONAL DYNAMICS OF A
DANUBIAN COPEPOD SPECIES
CS.SIPKAY1 –L.HORVÁTH1–J.NOSEK2–N.OERTEL2–CS.VADADI-FÜLÖP3–E.FARKAS3– Á.DRÉGELYI-KISS4–L.HUFNAGEL5*
1 Department of Mathematics and informatics, Corvinus University os Budapest, H-1118 Budapest, Villányi út 29-33, Hungary
(phone: +36-1-372-6261; fax: +36-1-466-9273)
2 Hungarian Academy of Sciences, Institute of Ecology and Botany, Hungarian Danube Research Station,
H-2131 Göd, Jávorka Sándor út 14, Hungary
3 Department of Systematic Zoology andEcology, Eötvös Loránd University, H-1117 Budapest, Pázmány Péter sétány 1/c, Hungary
4 Budapest University of Technology and Economics, Department of Chemical and Environmental ProcessEngineering
H-1111 Budapest, Műegyetem rkp. 3, Hungary
5„Adaptation to Climate Change” Research Group of Hungarian Academy of Sciences H-1118 Budapest, Villányi út 29-43., Hungary
(phone: +36-1-482-6261; fax: +36-1-466-9273)
*Corresponding author e-mail: leventehufnagel@gmail.com
(Received 20th March 2008 ; accepted 14th October 2008)
Abstract. Climate change is one of the most crucial ecological problems of our age with great influence.
Seasonal dynamics of aquatic communities are — among others — regulated by the climate, especially by temperature. In this case study we attempted the simulation modelling of the seasonal dynamics of a copepod species, Cyclops vicinus, which ranks among the zooplankton community, based on a quantitative database containing ten years of data from the Danube’s Göd area. We set up a simulation model predicting the abundance of Cyclops vicinus by considering only temperature as it affects the abundance of population. The model was adapted to eight years of daily temperature data observed between 1981 and 1994 and was tested successfully with the additional data of two further years. The model was run with the data series of climate change scenarios specified for the period around 2070- 2100. On the other hand we looked for the geographically analogous areas with the Göd region which are mostly similar to the future climate of the Göd area. By means of the above-mentioned points we can get a view how the climate of the region will change by the end of the 21st century, and the way the seasonal dynamics of a chosen planktonic crustacean species may follow this change. According to our results the area of Göd will be similar to the northern region of Greece. The maximum abundance of the examined species occurs a month to one and a half months earlier, moreover larger variances are expected between years in respect of the abundance. The deviations are expected in the direction of smaller or significantly larger abundance not observed earlier.
Keywords: Cyclops vicinus, geographical analogy, hydrobiology, simulation modelling
Introduction
Climate change, the global warming can affect the aquatic ecosystems in a very sensible way (Straile 2005; Nováky and Bálint 2004). Therefore the research of the effect of climate variability on the aquatic ecosystems is an indispensable task.
One possible approach is the weather conditions depending simulation modelling of an appropriately chosen aquatic community. By the help of the simulation models we can predict the possible changes in the seasonal dynamics of the given aquatic community in the case of the alternative climate change scenarios, it is indeterminate though. Considering the errors and assumptions of the model, the most likely, possible scenarios of the effect of climate change can be achieved (Hufnagel and Gaál, 2005).
For the modelling of the seasonal dynamics of population-collectives applying of extant model system is possible (Ladányi et al. 2003).
The seasonal dynamics of freshwater zooplankton communities is primarily influenced by climatic factors. Several authors have tried to describe and explore these connections (Bernot et al. 2004, Zelikman and Kamshilov, 1960, Hassel 1986, Villate et al. 1997). For modelling the seasonal dynamics complex approach is used generally:
besides environmental factors, predator and prey terms are used as parameters (Broekhuizen et al. 1995, Angelini and Petrere 2000). However making comprehensive models requires many pieces of information, which could not be achieved at all times, as we are not able to measure the information for the parameters at the field. Therefore often so-called strategic models are set up, which focus on the essence of the process, hence many pieces of information are lost. Notwithstanding these models can be useful tools to understand the general function of the complex system. This is realized by stressing one factor considered as the most essential and neglecting the other factors.
Many authors draw attention to the relevance of temperature as the main regulating factor (Baranovic et al. 1993, Christou and Moraitou-Apostolopoulou 1995, Christou 1998, Dippner et al. 2000, Iguchi 2004, Meise-Munns et al. 1990, Viitasalo et al. 1990).
We set up a discrete-deterministic simulation model which predicts the daily abundance of the investigated species by considering temperature as the main regulating factor and the abundance of population of the previous day. Our former studies were run on the seasonal dynamics modelling of the macroinvertebrate community in Lake Balaton (Sipkay and Hufnagel 2006, 2007) respectively of zooplankton and macroinvertebrate species in artificial water bodies (Vadadi and Hufnagel 2007). Present case study is made for modelling the seasonal dynamics of a Danubian copepod (Cyclopoida) species (Cyclops vicinus Uljanin, 1875) which is classed among the zooplankton.
The model was run with the data series of climate change scenarios that were specified for the period around 2070-2100, to answer the question, what changes could be expected concerning the seasonal dynamics of the species in question. What is more, we searched for the geographically analogous regions with similar climate as compared to the climate of the sampling site expected in the future, to demonstrate the climate change of the sampling site for the given period.
Materials and methods Data series used in study
Quantitative data on copepods and cladocerans (ind/m3) are available for the period of 1981-1994 (excepting the year 1990) based on the database of the Hungarian Academy of Sciences, Hungarian Danube Research Station. Sampling was conducted in the main arm of the Danube by Göd (1668 rkm) at a constant site near to the riverbank, filtering 200 liters of water with a plankton net (mesh size 75µm) from the surface at all times. Mostly samplings were performed weekly. Such frequent samplings adapt our data using for weather-dependent simulation modelling.
The meteorological data of the stations by Vác and Szentendre were applied, provided by the Hungarian Meteorological Office, as these two stations are near to the sampling site.
We used three data series of daily temperature for the period around 2070-2100, which are based on the A2 and B2 scenarios offered by the IPCC (2007). We used up the database of the PRUDENCE EU project (Christensen, 2005), namely the A2 and B2 scenarios of the HadCM3 climate change model run by the Hadley Centre (HC).
Thirdly the running results of the Max Planck Institute (MPI) for the A2 scenario were applied. Daily data specified for the period around 2070-2100 are downscaled to the region of Budapest. Daily data series gained from running of the above-mentioned scenarios three times differently, are containing 31 years in each of the three cases.
For the geographical analogy the observed climatic data were obtained from the internationally accepted CRU TYN CL 2.0 database. This contains the mean monthly temperature and rainfall data for the period of 1961-1990 with a 10 minutes spatial resolution.
Geographical analogy
One possible tool for analyzing climate change scenarios is the method of geographical analogy. This method is used for looking for regions that have similar climatic features currently, as compared to the examined area in the future (Horváth, 2007). The CLIMEX method (Sutherst et al., 1998) was used for analyzing the area of Göd, the grids of the TYN CL 2.0 (New et al., 1999, 2002) database were characterized on the basis of the climate related to a given grid, which has the greatest similarity with the data of scenarios. Regions can be regarded as analogous if their climatic similarity is greater than 90 %. Calculations were carried out based on the monthly temperature and rainfall values of all the 12 months.
Simulation modelling
An all the year present, dominant species (Cyclops vicinus), often appearing in high abundance, was chosen for modelling from the investigated crustacean plankton. The model is based on the main hypothesis that temperature is the principal regulating factor, so thus the abundance pattern is determined by the minimum and maximum temperature, other effects (like trophic relations and other interpopulation interactions) can be realized as hidden or as integrated in the main effect. We suppose that the temperature reaction-curve must be the sum of optimum curves, since the temperature optimum-curves of the different developmental stages of the species in question or its
distinct subpopulations, additionally every other biological phenomena determining the growth rate of the species can be added together in the reaction-curve. The seasonal dynamics of copepodits and adults of the chosen species were modelled separately. The individual numbers depend on the multiplier of minimum and maximum temperature (oC) values according to the following formula:
Nt=RT.Nt-1 (Eq.1)
Where Nt is the individual number of the population (adult or copepodit) at the time
„t”, RT is the value of the multiplier. Both of the temperature reaction-curves of minimum and maximum temperatures can be generated as the sum of two normal distributions. The parameters of the model consist of the standard deviations and means of the distributions, as well as an added constant, furthermore the constant values that were multiplied by the normal distributions. After all, the model for Cyclops vicinus is realized as the sum of the models run with the data of adults and copepodits. Parameters were optimalized with the Solver program of MS Excel.
From the data series for 10 years available for us, our model was fitted to 8 years of data. The remaining two years of data series (the year 1983 and 1987) were used for testing and validating the model.
The model was run with the daily data series of different climate change scenarios, beginning each year with an initial copepodit and adult abundance at the first day.
Statistical analysis of the results was performed using Past software (version 1.36, Copyright Hammer and Harper 1999-2005). The date of reaching of the maximum abundance was used as indicator, one-way ANOVA was used for checking if there is any difference between the scenarios regarding their prospective values. The post-hoc Tukey-test was performed to explore the significant differences between groups in pairwise comparisons; homogeneity of variance was checked with the Levene test.
Results
Geographical analogy
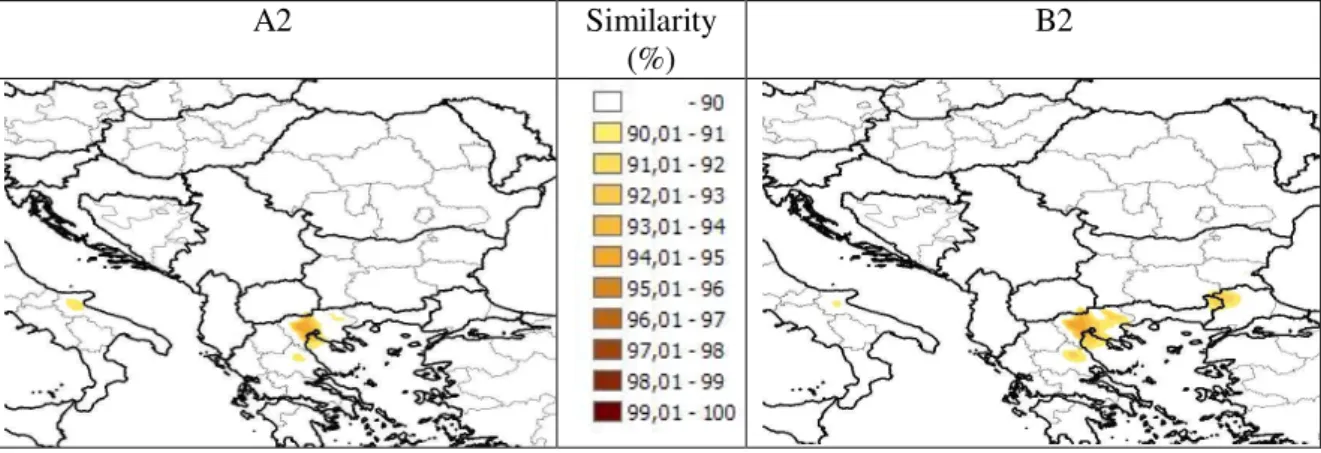
The present regions which have greater than 90 % similarity with the future climate of Göd are presented in Figure 1. Intense (above 95 %) analogy was not found in any cases. Analogous regions can be found most of all in Northern Greece.
A2 Similarity
(%)
B2
Figure 1.According to the A2 and B2 scenarios of the Hadley Centre, the climate of Göd in the period of 2070-2100 shows 90-93 % similarity with the present climate of
the northern regions of Greece.
Results of the simulation modelling
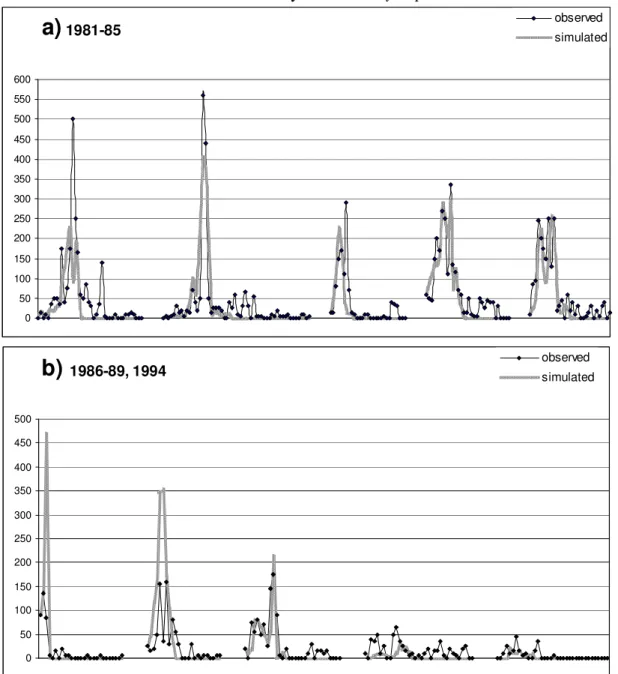
The temporal changes of the observed and simulated abundance of Cyclops vicinus during the 10 years are presented in Figure 2 a and b. It can be seen that the model fits well to the observed values even in the case of the validating years (1983 and 1987).
The differences between the scenarios proved not to be significant (P= 0,07) based on the one-way ANOVA, performed for the date of supervention of maximum abundance in the model for the seasonal dynamics of Cyclops vicinus.
a)
1981-850 50 100 150 200 250 300 350 400 450 500 550 600
observed simulated
b)
1986-89, 19940 50 100 150 200 250 300 350 400 450 500
observed simulated
Figure 2.The seasonal changes of the observed and simulated individual numbers (ind/m3) of Cyclops vicinus in the years 1981, 1982, 1983, 1984, 1985 (a), as well as in 1986, 1987, 1988,
1989 and 1994 (b).
According to the Levene test (p= 0, 17) the variances are homogeneous. No significant difference between the scenarios was detected by the Tukey-test based on pairwise comparisons. More intense similarity can be detected between the A2 and B2
scenarios of the Hadley Centre, than between the results of the two institute for the A2 scenario.
In the model fitted to the observed data (between the years 1981 and 1994), the maximum abundance occurs between the day 111 and 153, on the average at the day 137 (17 May). In contrast to the above-mentioned results, the maximum abundance occurs one respectively one and a half month earlier, on the average at the day 93 (A2, MPI), 98 (B2, HC) or 101 (A2, HC) regarding the scenarios, consequently between the 3 and 11 April.
No obvious increasing or decreasing tendency can be stated based on the maximum abundance and the yearly total abundance (Table 1), but anyway a shift is expected compared to the examined state. According to the climate change scenarios in the period around 2070-2100, lower or markedly higher maximum abundance and yearly total abundance values are expected by greater chance, as compared to the period 1981- 1994. Only on the basis of the A2 scenario of the Max Planck Institute can be stated that the abundance shifts around the higher values compared to the examined values. On the whole rather increasing abundance can be predicted based on the three scenarios, since the abundance values (maximum and yearly total abundance) proved to be so high on the basis of many years of model running, as could not be observed in the examined period. The results however must be handled watchful, since the simplicity of the model and also because the scenarios are outcomes of different models.
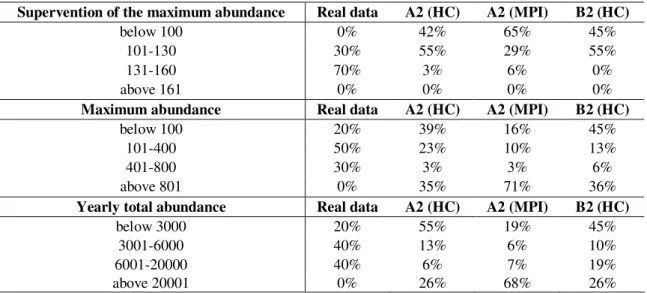
Table 1.The summary of the results of the model fitted to 10 years of observed data and to the data of A2 and B2 scenarios of the Hadley Centre (HC) and the Max Planck Institute (MPI) launched for 31 years. In the first column the categories of the supervention of the maximum abundance (which day of the year), maximum abundance and yearly total abundance are presented. In the other columns the proportions of the real data and scenarios are presented in percentage.
Supervention of the maximum abundance Real data A2 (HC) A2 (MPI) B2 (HC)
below 100 0% 42% 65% 45%
101-130 30% 55% 29% 55%
131-160 70% 3% 6% 0%
above 161 0% 0% 0% 0%
Maximum abundance Real data A2 (HC) A2 (MPI) B2 (HC)
below 100 20% 39% 16% 45%
101-400 50% 23% 10% 13%
401-800 30% 3% 3% 6%
above 801 0% 35% 71% 36%
Yearly total abundance Real data A2 (HC) A2 (MPI) B2 (HC)
below 3000 20% 55% 19% 45%
3001-6000 40% 13% 6% 10%
6001-20000 40% 6% 7% 19%
above 20001 0% 26% 68% 26%
Results
Neither similar climate to the expected climate of Göd for the end of the century along the Danube, nor intense similarity throughout Europe were found, supposedly owing to the large extent of changes due to happen by the end of the century. The
regions with the greatest similarity are at a distance of about 400 km, which is in accordance with the data from literature.
We managed to set up a model predicting the seasonal changes of the abundance of Cyclops vicinus based on the daily maximum and minimum temperature values, it fitted well to the observed data and was validated. Even if we do not understand exactly the reason that the temperature is the main regulating factor, nevertheless we accept this fact; predictions can be made for the period around 2070-2100 regarding the abundance, by means of the model run with the data series of scenarios. From the A2 and B2 basic scenarios of the IPCC, the former predicts more drastic, the latter more moderate changes (IPCC, 2007). However our results show, that greater correspondence is between the outcome of the model run with the data series of the A2 and B2 scenarios of the Hadley Centre, compared to the results for the A2 scenarios run with the data of the two institutes. No significant difference was found between the scenarios.
According to the former result, the change caused by the significant warming with different rate does not create notably different outcomes regarding the seasonal dynamics of the given species; the reaction to the warming can be regarded as uniform compared to the examined period (1981-1994).
According to the results the date of the supervention of maximum abundance shifts one respectively one and a half month earlier during the year. From the change in abundance predicted by the scenarios (namely shifting the maximum abundance and the yearly total abundance around the higher or lower values) may be concluded that, an unstable weather status may evolve in the period around 2070-2100 from the point of view of the examined species. Accordingly significantly greater fluctuations are expected in the abundance between the years due to global warming. On the other hand rather the increase of abundance can be made probable, which can be interpreted by physiological reasons. The shift of maximum abundance was observed around earlier dates by the cyclopoids and Eudiaptomus zachariasi in small artificial water bodies due to drastic warming, based on the simulation model in our former investigations (Vadadi and Hufnagel, 2007). However the zooplankton abundance showed distinct decline because of the drastic warming. Puelles et al. (2003) found the zooplankton abundance decreasing in a survey included 5 years, which was correlated with the global warming.
This contradiction can be explained by the different physiological needs of the chosen species, or by the fluvial milieu.
Based on our zooplankton database the next step beyond the survey of species can be the research of guilds, moreover complex guilds within a food web. Nevertheless in the future it is worth investigating the relationship between the temperature of air and water, just as their potential changes owing to climate change.
REFERENCES
[1] Angelini, R., Petrere, M. Jr. (2000): A model for the plankton system of the Broa reservoir, Sao Carlos, Brazil. − Ecological Modelling 126: 131-137.
[2] Baranovic, A., Solic, M., Vucetic, T., Krstulovic, N. (1993): Temporal fluctuations of zooplankton and bacteria in the middle Adriatic Sea. Marine Ecology Progress Series 92:
65-75.
[3] Broekhuizen, N., Heath, M. R., Hay, S. J., Gurney, W. S. C. (1995): Modelling the dynamics of the North Sea’s mesozooplankton. Netherlands Journal of Sea Research 33 (3/4): 381-406.
[4] Christensen, J.H. (2005): Prediction of Regional scenarios and Uncertainties for Defining European Climate change risks and Effects. Final Report. DMI, Copenhagen.
[5] Christou, E. D., Moraitou-Apostolopoulou, M. (1995): Metabolism and feeding of mesozooplankton at the eastern Mediterranean (Hellenic coastal waters). Marine Ecology Progress Series 126: 39-48.
[6] Dippner, J. W., Kornilovs, G., Sidrevics, L. (2000): Long-term variability of mesozooplankton in the Central Baltic Sea. Journal of Marine Systems 25: 23-31.
[7] Hassel, A. (1986): Seasonal changes of zooplankton composition in the Barents Sea, with special attention to Calanus spp. (Copepoda). J Plankton Res 2: 329-339.
[8] Horváth, L (2007): Földrajzi analógia meghatározásának néhány módszere és alkalmazásának lehetőségei. „Klíma-21” Füzetek 50: 54-61.
[9] Hufnagel L., Gaál M. (2005): Seasonal dynamic pattern analysis service of climate change research. Applied Ecology and Environmental Research 3(1): 79–132.
[10] Iguchi, N. (2004): Spatial/temporal variations in zooplankton biomass and ecological characteristics of major species in the southern part of the Japan Sea: a review. Progress in Oceanography 61: 213-225.
[11] IPCC (2007): The Physical Science Basis. Working Group I Contribution to the Fourth Assessment Report of the IPCC. Cambridge University Press, New York.
[12] Ladányi M., Horváth L., Gaál M., Hufnagel L. (2003): An agro–ecological simulation model system. Applied Ecology and Environmental Research 1(1–2): 47–74.
[13] Meise-Munns, C., Green, J., Ingham, M., Mountain, D. (1990): Interannual variability in the copepod populations of George Bank and the western Gulf of Maine. Marine Ecology Progress Series 65: 225-232.
[14] New, M., Hulme, M. and Jones, P.D., (1999): Representing twentieth century space-time climate variability. Part 1: development of a 1961-90 mean monthly terrestrial climatology. Journal of Climate 12, 829-856.
[15] New, M., Lister, D., Hulme, M. and Makin, I., (2002): A high-resolution data set of surface climate over global land areas. Climate Research 21:1-25.
[16] Nováky B., Bálint G. (2004): Éghajlatváltozás és a víz. Természet Világa, 135. évf.: 60–
64.
[17] Puelles, M. L. F., Pinot, J.M., Valencia, J. (2003): Seasonal and interannual variability of zooplankton community in waters of Mallorca island (Baleric Sea, Western Mediterranean).- 1994-1999. Oceanologica Acta 26: 673-686.
[18] Sipkay Cs., Hufnagel L. (2006): Szezonális dinamikai folyamatok egy balatoni makrogerinctelen együttesben. Acta Biologica Debrecina Supplementum Oecologica Hungarica 14: 211–222.
[19] Sipkay Cs., Hufnagel L. (2007): Klímaváltozási szcenáriók összehasonlító elemzése balatoni makrogerinctelen együttes alapján. Hidrológiai Közlöny 87: 117-119.
[20] Straile, D. (2005): Food webs in lakes – seasonal dynamics and the impacts of climate variability. In: Belgrano, A, Scharler, U.M, Dunne, J & Ulanowicz, R.E.
[21] Sutherst, R.W. & Maywald, G.F. (1998). CLIMEX - A bio-geographical approach to entomology. In: Zalucki, M.P., Drew, R.A.I. & White, G.G. (Eds) Pest Management &
Future Challenges. Proc. 6th Australasian Applied Entomological Research Conference.
2: 344-345. University of Queensland, Brisbane.
[22] Vadadi-Fülöp Cs., Hufnagel L. (2006): Klímaváltozási szcenáriók értékelése egy kerti tó zooplankton közösségének szezonális dinamikájának alapján. XLVIII. Hidrobiológus Napok, Tihany, 2006. (Abstract)
[23] Vadadi-Fülöp Cs., Sipkay Cs., Hufnagel L. (2007): Klímaváltozási szcenáriók értékelése egy makrogerinctelen faj (Ischnura pumilio Charpentier, 1825) szezonális dinamikája alapján. Acta Biologica Debrecina Supplementum Oecologica Hungarica 16: 211-219.
[24] Viitasalo, M., Vuorinen, I., Ranta, E. (1990): Changes in crustacean mesozooplankton and some environmental parameters in the Archipelago Sea (Northern Baltic) in 1976- 1984. Ophelia 31: 207-217.
[25] Villate F., Moral M., Valencia V. (1997): Mesozooplankton community indicates climate changes in a shelf area of the inner Bay of Biscay throughout 1988 to 1990. J. Plankton Res 19: 1617 - 1636.
[26] Wu, L., Culver, D. A. (1994): Daphnia population dynamics in Western Lake Erie:
regulation by food limitation and yellow perch predation. Journal of Great Lakes 20 (3):
537-545.
[27] Zelikman, E. A., Kamishilov, M. M. (1960): The long-term dynamics of plankton biomass in the southern part of the Barents Sea, and factors influencing it. Tr. Murm.
Morsk Biol. Inst. 2: 68-113 (in Russian)