Agriculture and Environment, 5, (2013) 19–39
Ornamental plants as climatic indicators of arthropod vectors
Akos BEDE-FAZEKAS ´
1email: bfakos@gmail.com
Attila J´ anos TR ´ AJER
2,3email: atrajer@gmail.com
1Corvinus University of Budapest, Faculty of Landscape Architecture, Department of Garden and Open Space Design,
H-1118 Budapest, Vill´anyi ´ut 29-43
2University of Pannonia, Department of Limnology, H-8200 Veszpr´em, Egyetem utca 10
3MTA-PE Limnoecology Research Group, H-8200 Veszpr´em, Egyetem utca 10
Abstract. The importance and risk of vector-borne diseases (e.g., leish- maniasis, West Nile Virus, Lyme borreliosis) is going to increase in the European temperate areas due to climate change. Our previous studies have shown that the potential distribution of Leishmania infantum and somePhlebotomus(sand fly) species – a parasite of leishmaniasis, and its vectors – may be expanded even to the southern coastline of the Baltic Sea by the end of the 21st century. The lowland areas of the Carpathian Basin and the main part of Hungary are projected to be suitable for the studied sand fly vectors in the near future. It is important to find some indicator plants to examine whether the sand flies are able to live in a certain climate at a certain time. We studied several Mediterranean and Sub-Mediterranean plant species, and we found that the aggregated dis- tribution of three ligneous species (Juniperus oxycedrus L.,Quercus ilex L. andPinus brutiaTen.) shows high correlation with the union distribu- tion of five sand flies (Phlebotomus ariasiTonn.,Ph. neglectusTonn.,Ph.
perfiliewi Parrot,Ph. perniciosus Newst. andPh. tobbi Adler, Theodor et Lourie). Since these Mediterranean species are highly tolerant of the edaphic characteristics of the planting site, they may prove to be good indicators. The present and upcoming climate of Hungary is seen to be suitable for the selected indicator plant species, and it draws attention to
and verifies the potential of the expansion of sand flies, which has been proved by some recent observations of the vectors in Southern Hungary.
Keywords: climate change, indicator plant species, climate envelope model, vector-borne diseases, leishmaniasis, sand fly
Introduction
Climate change and vector-borne diseases
The phenomenon of climate change has been accepted to a quite broad ex- tent. There is a great amount of climate models based on the IPCC SRES climate scenarios, and free access is provided for them. The models are reli- able enough and have good temporal and horizontal resolution for studying the potential future distribution of plant and animal vector species. Thus, the maps created by the model have importance not only for landscape architects and botanists (Czink´oczky and Bede-Fazekas 2012), but also for epidemiolo- gists. By 2050, summer temperatures are predicted to increase by more than 2.5◦C in the Mediterranean area, in Central Europe by less than 1.5◦C and in Eastern Europe by about 1◦C or less. The simulated warming is typically between 1.5◦C and 2◦C in most parts of Europe in winter. Although the pre- cipitation in the Mediterranean area decreases by up to 50%, the precipitation increases in large, even in the northern parts of Europe in autumn and winter (Max-Planck-Institut 2007). As expected, the climate in the Carpathian Basin will be warmer, more arid, and will have extreme rainfalls more frequently in the colder half-year (Bartholy et al. 2007). Due to the climate change, the phenological, physiological and genetic parameters, the distribution area of the plant species and the stability of ecosystems seem to be going to change in the future (Hughes 2000, Kov´acs-L´ang et al. 2008). Several predictions were made for the future distribution of plants, including the European species as well (Berry et al. 2006, Bakkenes et al. 2006, Harrison et al. 2006, Peterson et al. 2008, Bede-Fazekas 2012, Serra-Diaz et al. 2012).
An important impact of climate change on human health is the increasing hazard of vectorial diseases (animal-transmitted human diseases, mainly trans- ported by arthropods: insects, ticks, etc.). The current importance of vectorial diseases is less in Europe than in the countries of the Third World, particularly in the Sub-Saharan Africa. The protective role of cold winters in the temperate climate may lose its importance. Due to the climate change, the importance of arthropod-borne diseases can increase by the end of the 21stcentury. Three
groups of vectorial diseases can be discerned: 1) the recently abundant ones;
2) the diseases of the past centuries, which have disappeared but can appear again (re-emerging diseases); 3) the new, exotic diseases. The latter can be ranked among the Mediterranean or subtropical and tropical vectorial dis- eases. Lyme disease, tick-borne encephalitis and some other arthropod-borne diseases are good examples of the first group.
Vector-borne diseases are sensitive to climatic conditions (Rogers and Ran- dolph 2006). Climate change can cause a shift in the geographical spread of insect populations (Lad´anyi and Horv´ath 2010) by modifying the climatic con- ditions and seasonal patterns and affecting the reproduction and the length of annual activity of vector species. These changes can increase their population in the recently inhabited areas, and by moderating the climate in the tem- perate areas of Europe, they can facilitate the migration of these arthropod vectors to the North (De la Roque et al. 2008). Changes in climatic pat- terns and in seasonal conditions may also affect disease behaviour in terms of spread pattern, diffusion range, amplification and persistence in novel habi- tats. Higher temperatures can induce the earlier flight of adult insects, eg., in the case of Lepidoptera species (Kocsis and Hufnagel 2011). Heat, humidity and sufficient organic matter are the main effectors of the larval development of sand flies (Naucke 2002, Lindgren and Naucke 2006), while the increasing CO2 levels are usually unfavourably affecting the development of the insect larvae (Kocsis and Hufnagel 2011).
Leishmaniasis and sand flies
In the Subtropics and Tropics, leishmaniasis is one of the most important hu- man vector-borne diseases with more than 12 million infected people (Naderer et al. 2006). L. infantum is the most notable causative agent of leishmaniasis in both humans and the reservoir animals in Europe (Ready 2010). Mem- bers of genusPhlebotomus (sand flies) are the main vectors of the unicellular eukaryote parasite genus Leishmania in Eurasia and Africa. Other sand fly vectors of Leishmania parasites can be found in the subgenera Larroussius and Adlerius (Killick-Kendrick 1990). In Southern Europe, leishmaniasis is mostly a zoonosis because the main hosts of Leishmania parasites are dogs and cats; however, foxes, rodents and horses can also be reservoirs (S´anchez et al. 2000; Pennisi 2002, K¨ohler et al. 2002, Solano-Gallego et al. 2003, Shaw et al. 2003) and a human-to-human transmission cycle is also possible (Alvar et al. 1997). The observed distribution of the cases of leishmaniasis in dogs (CanL) is similar to the human leishmaniasis’ current occurrence (Lingren and
Naucke 2006, Solano-Gallego et al. 2011).
Phlebotomus species are characteristic Subtropical-Tropical faunal elements (Asp¨ock et al. 2008). The geographical distribution of leishmaniasis is limited by the distribution of the different sand fly species. Phlebotomus ariasi, Ph.
perniciosus,Ph. tobbi,Ph. perfiliewi andPh. neglectus are the main causative agents of L. infantum, while Ph. papatasi is the vector of L. major,L. dono- vani, L. tropica; Ph. sergenti can transmit L. tropica and L. major; Ph.
similis is the main transmitter of L. tropica (Minter 1989, Killick-Kendrick 1990, WHO 1984, L´eger et al. 2000). The vectors have a greater area than the parasite itself (Lindgren et al. 2008). In view of the above-mentioned fact, the modelled future expansion of sand flies does not imply the similar invasion of the parasites, too.
Indicator plant species
As it is recommended by the WHO (World Health Organization), using indicator species can help us study the effects of climate change. It has a high importance for the future to find some plant species that indicate the potential distribution of vectors and vectorial diseases. We aimed to bind some indicator plants to the Mediterranean-originated vectors. It is important to compare the reaction to climate change of the animal vectors of infectious diseases with the reaction of plant species. Since plants have a fixed position and they do not have the ability to produce notable heat like warm-blooded animals do (e.g., mammals), they are the most sensitive and therefore the most suitable climate indicators. Sand flies, which are able to move, can avoid climatic extremities in man-made (Killick-Kendrick and Killick-Kendrick 1987, Naucke 2002) and natural (Hanson 1961) shelters. In the case of plants, the climate affects them directly in their distribution area. Note that sand flies are also poikilothermic organisms as plants.
Ligneous plants were studied as indicator species instead of herbaceous plants since they are unable to react suddenly to the small-scale changes of climate. Thus, the natural distribution and the area of introduction of these species are strongly influenced by the extrema of climatic parameters. There- fore, their environmental demands can be modelled based on their current distribution as well. On the other hand, using plants as indicators instead of insects is much more ethical since their human-controlled introduction in the new sites is not hazardous.
Climate envelope model
We aimed to investigate the impact of climate change on the distribution of the selected vector and plant species with Climate Envelope Modelling (CEM) (Hijmans and Graham 2006). This method is about predicting species responses to climate change: it involves drawing an envelope around the do- main of climate variables where a species is recently found and then iden- tifying regions predicted to fall within that domain under scenarios for the future (Ib´a˜nez et al. 2006). In contrast to mechanistic models, CEM (also known as niche-based modelling, correlative modelling) tries to find statistical correlations between the distribution of species and climate (Guisan and Zim- mermann 2000, Elith and Leathwick 2009), and models the future temporal correspondence based on the present spatial correspondence between the vari- ables (Pickett 1989). It postulates that (present and future) distribution is mostly dependent on the climate (Cz´ucz 2010), which is slightly questionable (Skov and Svenning 2004).
Various other ways can be found to determine the climate envelope, includ- ing simple regression, distance-based methods, genetic algorithms for rule-set prediction, and neural nets (Ib´anez et al. 2006). About modelling vectorial diseases, see Peterson (2006).
Materials and methods
Climate data
The climate data were obtained from the regional climate model (RCM) REMO (ENSEMBLES 2013). The model REMO is based on the ECHAM5 global climate model (Roeckner et al. 2003, Roeckner et al. 2004) and the IPCC SRES A1B scenario. The A1B scenario supposes very fast economic increase, a worldwide population that peaks in the mid 21st century, and the introduction of innovative and efficient technologies (Nakicenovic and Swart 2000). The reference period of REMO is 1961–1990; the two future periods of modelling are 2011–2040 and 2041–2070. The horizontal resolution of the grid is 25 km. The entire European Continent is within the domain of REMO;
we used however only a part (25724 of the 32300 points) of the grid. 36 cli- matic variables were averaged in the 30-year periods and used by the model:
monthly mean temperatures (Tmean, ◦C), monthly minimum temperatures (Tmin,◦C), and monthly precipitations (P, mm). Climate is the major driver of species distributions over Europe, and at the European coarse resolution
land cover is mainly driven by climate, mainly by temperature and precipita- tion (Thuiller et al. 2004).
Distribution data
The studied species were Leishmania infantum Nicolle.,Phlebotomus ariasi Tonn. (syn. Larroussius a.), Ph. neglectus Tonn. (syn. Larroussius n.), Ph. perfiliewi Parrot (syn. Larroussius p.), Ph. perniciosus Newst. (syn.
Larroussius p.) and Ph. tobbi Adler, Theodor et Lourie (syn. Larroussius t.), and Juniperus oxycedrus L., Pinus brutia Ten. and Quercus ilex L. Our model was run on the distribution of parasite, vectors, and indicator plants separately. Since the model studied the climate requirements only of the Eu- ropean populations – the North African distribution segments were excluded –, it was able to project the shift of this part only.
The distribution data ofL. infantum were derived from observations in 2003 (Trotz-Williams and Trees 2003). Only the continuous (not discrete) distri- bution data were taken into consideration where the force of infection was greater than zero. Weighting procedures were not used, the map of infection was reduced to a simple presence-absence map. The distribution in 2012 of the Phlebotomus species was obtained by VBORNET (2013). The regions entitled as ’indigenous’ and ’recently present’ were utilized with the same weight. All theLeishmania and Phlebotomus distribution data were based on the NUTS3 regions, which are the third-level public administration territories of the European Union. The distribution ofJuniperus oxycedrus,Pinus brutia and Quercus ilex were derived from Tutin et al. (1964), EUFORGEN (2009) and Meusel et al. (1965), respectively. After a georeferencing process with 3rd order polynomial transformation, the digitization of the bitmap-format distri- bution maps was realized with the assistance of the digital NUTS3 polygon borders (GISCO 2013).
Modelling method
Aggregated distribution of the eight studied Phlebotomus species was cre- ated, and the model for this union distribution was run iteratively to inves- tigate the optimal amount of percentiles to be left from the climatic values.
Cumulative distribution functions were calculated by PAST statistic analyser (Hammer et al. 2001) for the 36 climatic parameters. During the iterative modelling, 0+0 to 19+19 percentiles were left from the lower and higher val- ues of a certain type of climate parameters (e.g., mean temperatures), while the other 2×12 climatic parameters were fixed at the extreme values (0-0
percentiles were left). In the meanwhile, two types of error values were calcu- lated: 1) false negative, 2) false positive. They were summarized with the same weights divided between them. The point of minimum (the optimal number of percentiles to be left) of the accumulated error function was searched. It was found that the precipitation parameter drew quite different error func- tions than the temperatures, therefore, another iteration was run to study the difference between the lower and higher part of the precipitation percentiles.
The two extrema of the minimum and mean temperatures were fixed, and it- eratively more percentiles from the minimum of precipitation values were left while the maximum was fixed, and vice versa. The result of model calibra- tion based on the aggregated Phlebotomus distribution was used during the modelling of the species.
Then the climatic data were refined by Inverse Distance Weighted interpola- tion method of ESRI ArcGIS 10 software. The modelling steps were as follows in the case of certain species: 1) the grid points within the distribution (a few thousand×36 data) were queried; 2) the percentile points of the 36 climatic parameters (101×36 data) were calculated; 3) the appropriate percentiles of the climatic parameters (2×36 data) were selected; 4) modelling phrases (3 strings) were created by string functions of Microsoft Excel 2007 for the three modelling periods; 5) the areas were selected where all the climatic values of the certain period were between the extrema selected in step 3.
Results
Model calibration
The accumulated error functions showed that leaving percentiles from pre- cipitation and from the minimum of precipitation results in graphs having the minimum point at the origin. Therefore, leaving percentiles from the minimum of precipitation values gives worse model than without percentile leaving. According to the result of iterations, 5-5 percentiles are to be left from the two extremes of mean temperature, 2-2 from the two extremes of minimum temperature, and 0 from the minimum and 8 from the maximum of precipitation.
Predicted distribution of the parasite
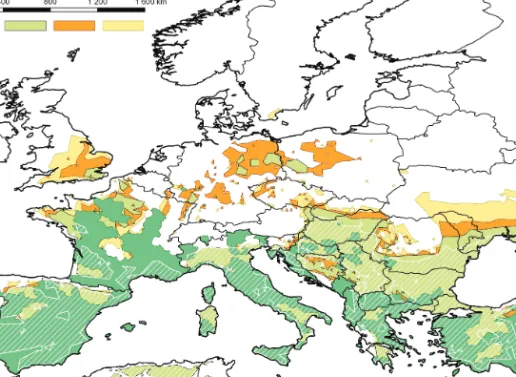
Observed and modelled distribution and predicted potential distribution of the parasite L. infantum is shown in Fig. 1. The recent distribution of
visceral leishmaniasis is restricted to the Mediterranean coast line, mainly to the coastline of the Western Mediterranean Basin. The eastern Mediterranean area is highly vulnerable toL. infantum. Sporadic canine cases are known from Central Europe (Trotz-Williams and Trees 2003). The model predicted the potential distribution of the parasite with the sporadic cases in the reference period to be greater than the observed current distribution. The major differ- ence can be observed in the eastern Mediterranean areas. Future expansion is expected principally in Asia Minor and the Balkan Peninsula, but the set of the affected countries is much larger: Spain, France and Hungary (mainly in the far future period), Serbia, Macedonia, Bulgaria, Romania, Ukraine and Turkey. Considering the current distribution and the model result, Southeast Europe and the Carpathian Basin are highly vulnerable areas. On the Italian coast, the Alps and the Pyrenees, the primary limiting value is the maximum of the precipitation in July.
Figure 1: Current distribution (dark green), modelled potential distribution in the reference period (light green), and predicted potential distribution in the period of 2011–2040 (orange) and 2041–2070 (yellow) of the parasite Leish- mania infantum. The figure is created by the authors with the assistance of ESRI ArcGIS.
Predicted distribution of the vectors
Observed and modelled distribution and predicted potential distribution of the aggregation of the five studied sand fly species are shown in Fig. 2.
The Mediterranean, most of the territories of France and some regions with Sub-Mediterranean climate near the northern border are included in the ob- served distribution. The modelled potential distribution seems to be greater in Southeast and East-Central Europe. In the western regions, the observed and modelled distributions show more similarities. In the near future, period expansion is predicted mainly in Great Britain, Central Europe and Ukraine.
In the period of 2041–2070, significant expansion is projected in Great Britain and in Ukraine.
Figure 2: Current distribution (dark green), modelled potential distribution in the reference period (light green), and predicted potential distribution in the period of 2011–2040 (orange) and 2041–2070 (yellow) of the aggregated Phlebotomusspecies, and the modelled potential distribution of the aggregated indicator species in the reference period (white hatch). The figure is created by the authors with the assistance of ESRI ArcGIS.
Predicted distribution of the indicator plants
The aggregated observed and modelled (Fig. 2.) distribution – and the climatic requirements – ofJuniperus oxycedrus,Quercus ilex andPinus brutia show significant resemblance with those of the studied Phlebotomus species.
Hence it can be stated that these three plant species can serve as climatic indicators of the vectors of L. infantum. The observed distribution gives us an inkling that these indicators can tolerate the winter mean temperature not lower than 0◦C, their cold tolerance is, however, known to be greater.
According to the hardiness zones of USDA,Juniperus oxycedrus and Quercus ilex are hardy to -17.7◦C andPinus brutia is hardy to -12.2◦C. The modelled potential distribution in the reference period is larger than the observed one mainly in Eastern Europe. Territories with -1 – -2◦C mean temperature in January are included. The predicted future distributions are not much more expanded than in the reference period. Expansion seems to be occurred in Northwestern France, South England and the Carpathian Basin.
Discussion
Opinions differ if climate is by itself sufficient or even the most important factor for explaining species distributions (Dormann 2007). According to Ken- newick et al. (2010), the most important limit of the distribution of sand flies is the winter average and minimum temperatures and the cold and rainy sum- mers. Note that absolute climatic values and extremes rather than averages may explain the limits of distribution better (Kov´acs-L´ang et al. 2008). In contrary to the animals, the distribution of plants is able to be limited by not only the climatic but the edaphic parameters, too. Thus, it was important to examine whether the selected indicator species have wide tolerance to the soil type. In the distribution area of the studied species, numerous different soil types can be observed, including leptosols, regosols, luvisols, cambisols, cal- cisols, fluvisols, vertisols and umbrisols (FAO 1971). While almost all the soil types of Central and Western Europe are found within the current distribution area, the edaphic parameters will probably not limit the future expansion of these species.
Future predictions for the periods of 2011–40 and 2041–70 show similarities in the case of the indicators and vectors. The latter is somewhat greater, pri- marily in Central Europe, Germany and Poland. It should be noted that some distinct territories in Germany, South England and Poland are included in the modelled potential distribution for the reference period, which is in accor-
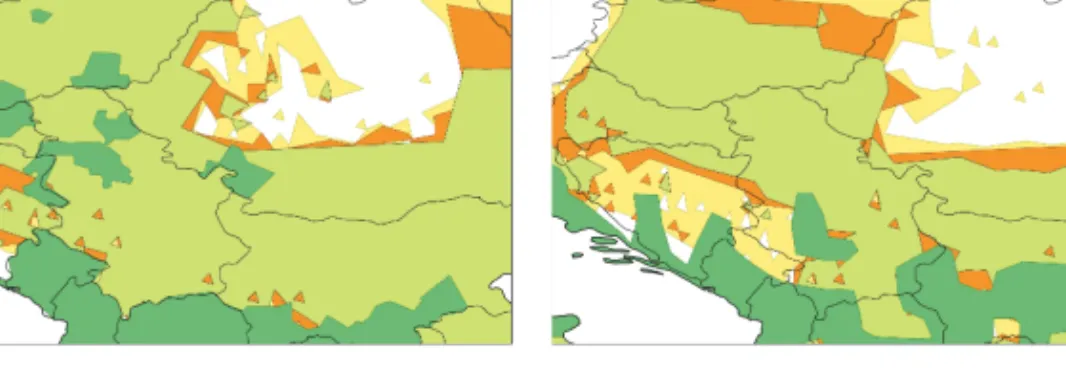
dance with the observation of Fischer et al. (2010). In the Carpathian Basin and Eastern Europe, the modelled distribution shows significant similarities to that of the vectors (Fig. 3.).
Figure 3: Comparison of the model results of sand flies (a) and indicator plant species (b) zoomed to the Carpathian Basin. The figure is created by the authors with the assistance of ESRI ArcGIS and Adobe Photoshop.
In the Carpathian Basin, the northern border of the modelled distributions coincides with the northwestern-southeastern winter isotherms. The distance of the northern border of the indicator and vector species is 50–150 km; this difference is increasing towards the east. In Eastern Europe, the distribution borders and the isotherms have a west-east direction. The above-mentioned distance is larger to the east of the Carpathians than in the Carpathian Basin.
In Transylvania, the presence of the indicators is not predicted for the studied periods. Climate in Northern Bosnia and Herzegovina is predicted to become suitable for the vectors by 2040, but for the indicators only by 2070.
The selection of the indicators was verified by Cohen’s kappa measurement based on the distribution of the vectors and the indicators. Since the Cohen’s kappa value in the case of the modelled distributions (0.7938) is much greater than in the case of the observed distributions (0.6057), the similarities in the climatic requirements are greater than it was expected based on the observed distributions.
It was concluded that the studied plant species can be reckoned as indicators of sand flies. Hence, in the regions where young specimens of these species are able to survive without any (e.g., frost) protection, the appearance of the vectors is expected. Therefore, Hungary is highly endangered (Fig. 4., Fig.
5., Fig. 6.), which is in accordance with the recent observation of sand flies in Southern Hungary (Farkas et al. 2011).
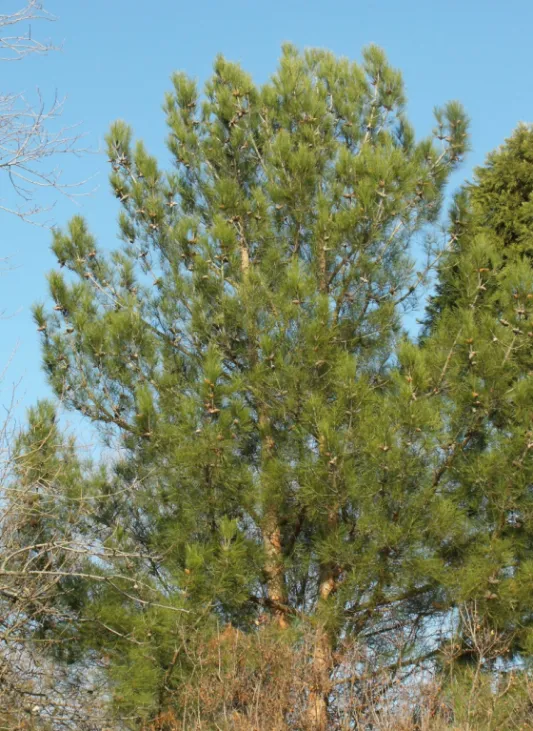
Figure 4: Pinus brutia specimen in Budapest. The photo was taken by the authors in 2010.
Figure 5: Quercus ilex specimen in P´ecs. The photo was taken by the authors in 2011.
Conclusions
1. It was discussed that vector-borne diseases originated in the Mediter- ranean can endanger the temperate part of Europe.
2. A model was calibrated with iterative error evaluation to study the future expansion of Leishmania infantum, its five sand fly vectors and three plant species.
3. The model was run for the reference period (1961–90) and for the two prediction periods (2011–40, 2041–70), and maps were drawn based on the model results.
4. The aggregated distribution of Juniperus oxycedrus, Pinus brutia and Quercus ilex was proven to be able to serve as a climate indicator of the aggregation of sand flies.
5. It was concluded that Hungary is highly endangered by thePhlebotomus species, and therefore byLeishmania infantum.
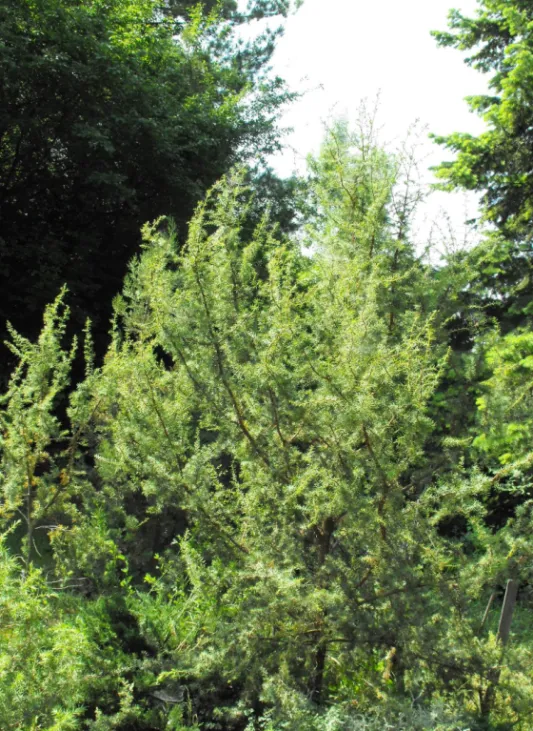
Figure 6: Young Juniperus oxycedrus specimen in Budakeszi. The photo was taken by the authors in 2009.
Acknowledgements
Special thanks to Anna P´aldy (National Institute of Environmental Health), J´anos Bobvos (National Institute of Environmental Health), Levente Horv´ath (Corvinus University of Budapest) and Levente Hufnagel (Corvinus University of Budapest) for their selfless assistance. The research was supported by Project T ´AMOP-4.2.1/B-09/1/KMR-2010-0005 and T ´AMOP-4.2.2.A-11/1/
KONV-2012-0064. The ENSEMBLES data used in this work was funded by the EU FP6 Integrated Project ENSEMBLES (Contract number 505539), whose support is gratefully acknowledged.
References
[1] Alvar J., Canavate, C., Guti´errez-Solar, B., Jim´enez, M., Laguna, F., L´opez-V´elez, R., Molina, R., Moreno, J. (1997), Leishmania and human immunodeficiency virus coinfection: the first 10 years. Clin. Microbiol.
Rev., 10(2): 298–319.
[2] Asp¨ock, H., Gerersdorfer, T., Formayer, H., Walochnik, J. (2008), Sand- flies and sandfly-borne infections of humans in Central Europe in the light of climate change. Wiener klinische Wochenschrift, 120(4): 24–29.
[3] Bakkenes, M., Eickhout, B., Alkemade, R. (2006), Impacts of different climate stabilisation scenarios on plant species in Europe. Global Envi- ronmental Change, 16(1): 19–28.
[4] Bartholy, J., Pongr´acz, R., Gelyb´o, Gy. (2007), A 21. sz´azad v´eg´en v´arhat´o ´eghajlatv´altoz´as Magyarorsz´agon. F¨oldrajzi ´Ertes´ıt˝o, 56(3-4):
147–168.
[5] Bede-Fazekas, ´A. (2012), Melegig´enyes d´ıszf´ak telep´ıthet˝os´egi ter¨ulet´e- nek el˝orejelz´ese a 21. sz´azadra. Thesis, Corvinus University of Budapest, Faculty of Landscape Architecture, Budapest.
[6] Berry, P. M., Rounsevell, M. D. A., Harrison, P. A., Audsley, E. (2006), Assessing the vulnerability of agricultural land use and species to climate change and the role of policy in facilitating adaptation. Environmental Science & Policy, 9(2): 189–204.
[7] Czink´oczky, A., Bede-Fazekas, ´A. (2012), Visualization of the climate change with the shift of the so-called Moesz-line. In: Buhmann, E.,
Ervin, S., Pietsch, M. (eds.): Peer Reviewed Proceedings of Digital Landscape Architecture 2012 at Anhalt University of Applied Sciences.
Herbert Wichmann Verlag, Berlin, pp. 437–444.
[8] Cz´ucz, B. (2010), Az ´eghajlatv´altoz´as hazai term´eszetk¨ozeli ´el˝ohelyekre gyakorolt hat´asainak modellez´ese. PhD dissertation. Corvinus University of Budapest, Faculty of Horticultural Sciences. Budapest.
[9] De la Roque, S., Rioux, J. A., Slingenbergh, J. (2008), Climate change:
Effects on animal disease systems and implications for surveillance and control. Revue Scientifique Et Technique. International Des Epizooties, 27(2): 339–354.
[10] Dormann, C. F. (2007), Promising the future? Global change projections of species distributions. Basic and Applied Ecology, 8(5): 387–397.
[11] Elith, J., Leathwick, J. R. (2009), Species Distribution Models: Ecologi- cal Explanation and Prediction Across Space and Time. Annual Review of Ecology, Evolution, and Systematics, 40(1): 677–697.
[12] ENSEMBLES (2013), ENSEMBLES data archive. ensemblesrt3.dmi.dk.
Last accessed: 2013.03.01.
[13] EUFORGEN (2009), Distribution map of Brutia pine (Pinus butia).
www.euforgen.org/distribution maps.html. Last accessed: 2013.01.01.
[14] FAO (1971): FAO-UNESCO Soil Map of the World, 1:500 000. Food and Agriculture Organization, United Nations, Rome and Paris.
[15] Farkas, R., T´anczos, B., Bongiorno, G., Maroli, M., Dereure, J., Ready, P. D. (2011), First surveys to investigate the presence of canine leishma- niasis and its phlebotomine vectors in Hungary. Vector Borne Zoonotic Dis, 11(7): 823–834.
[16] Fischer, D., Thomas, S. M., Beierkuhnlein, C. (2010), Temperature- derived potential for the establishment of phlebotomine sandflies and visceral leishmaniasis in Germany. Geospatial Health, 5(1): 59–69.
[17] GISCO (2013), GISCO - Eurostat (European Commission).
epp.eurostat.ec.europa.eu/portal/page/portal/gisco Geographical information maps/popups/references/ administrative units statistical units 1. Last accessed: 2013.01.01
[18] Guisan, A., Zimmermann, N. E. (2000), Predictive habitat distribution models in ecology. Ecological Modelling, 135(2-3): 147–186.
[19] Hammer, ˇR., Harper, D. A. T., Ryan, P. D. (2001), PAST: Paleontologi- cal statistics software package for education and data analysis. Palaeon- tologia Electronica, 4: 9.
[20] Hanson, W. J. (1961) The Breeding Places of Phlebotomus in Panama (Diptera, Psychodidae). Annals of the Entomological Society of America, 54(3): 317–322.
[21] Harrison, P. A., Berry, P. M., Butt, N., New, M. (2006), Modelling climate change impacts on species’ distributions at the European scale:
implications for conservation policy. Environmental Science & Policy, 9(2): 116–128.
[22] Hijmans, R. J., Graham, C. H. (2006), The ability of climate envelope models to predict the effect of climate change on species distributions.
Global Change Biology, 12(12): 2272–2281.
[23] Hughes, L. (2000), Biological consequences of global warming: is the signal already apparent? Trends in Ecology and Evolution, 15(2): 56–
61.
[24] Ib´anez, I., Clark, J. S., Dietze, M. C., Feeley, K., Hersh, M., Ladeau, S., Mcbride, A., Welch, N. E., Wolosin, M. S. (2006), Predicting Biodiver- sity Change: Outside the Climate Envelope, beyond the Species-Area Curve. Ecology, 87(8): 1896–1906.
[25] Kennewick, W. A., Marfin, A. A. (2010), Emerging Vector-Borne Infec- tious Diseases What’s New in Medicine Workshop.
[26] Killick-Kendrick, R. (1990), Phlebotomine vectors of the leishmaniases:
a review. Medical and Veterinary Entomolog, 4(1): 1–24.
[27] Killick-Kendrick, R., Killick-Kendrick, M. (1987), The laboratory col- onization of Phlebotomus ariasi (Diptera, Psychodidae). Ann Parasitol Hum Comp, 62(4): 354–356.
[28] Kocsis, M., Hufnagel, L. (2011), Impacts of climate change on Lepi- doptera species and communities. Applied Ecology and Environmental Research, 9(1): 43–72.
[29] K¨ohler, K., Stechele, M., Hetzel, U., Domingo, M. Sch¨onian, G., Zahner, H., Burkhardt, E. (2002), Cutaneous leishmaniosis in a horse in southern Germany caused by Leishmania infantum. Vet Parasito, 16(109): 9–17.
[30] Kov´acs-L´ang, E., Kr¨oel-Dulay, Gy., Cz´ucz, B. (2008), Az
´eghajlatv´altoz´as hat´asai a term´eszetes ´el˝ovil´agra ´es teend˝oink a meg˝orz´es ´es kutat´as ter¨ulet´en. Term´eszetv´edelmi K¨ozlem´enyek, 14(1):
5–39.
[31] Lad´anyi M., Horv´ath, L. (2010), A review of the potential climate change impact on insect populations - general and agricultural aspects. Applied Ecology and Environmental Research, 8(2): 143–152.
[32] L´eger, N., Depaquit, J., Fert´e, H., Rioux, J. A., Gantier, J. C., Gram- iccia, M., Ludovisi, A., Michaelides, A., Christophi, N., Economides, P. (2000), Phlebotomine sandflies (Diptera: Psychodidae) of the isle of Cyprus. II - isolation and typing of Leishmania (Leishmania infantum Nicolle, 1908 (zymodeme MOM 1) from Phlebotomus (Larrouius) tobbi Adler and Theodor, 1930. Parasite, 7(2): 143–146.
[33] Lindgren, E., Naucke, T. (2006), Leishmaniasis: Influences of Climate and Climate Change Epidemiology, Ecology and Adaptation Measures.
In: Menne, B, Ebi, K. L. (eds.): Climate change and adaptation strate- gies for human health. Steinkopff Verlag, Darmstadt, pp. 131–156.
[34] Lindgren, E., Naucke, T., Menne, B. (2008), Climate Variability And Visceral Leishmaniasis In Europe. WHO/TDR Working paper for the Scientific Working Group meeting on Leishmaniasis Research, convened by the Special Programme for Research and Training in Tropical Dis- eases, Geneva.
[35] Max-Planck-Institut f¨ur Meteorologie (2007), What will the cli- mate in Europe look like in the middle of the 21st century?
www.mpimet.mpg.de/en/news/press/faq-frequently-asked-questions/
what-will-the-climate-in-europe-look-like-in-the-middle-of-the-21st- century.html. Last accessed: 2013.03.01.
[36] Meusel, H., J¨ager, E. J., Weinert, E. (1965), Vergleichende Chorolo- gie der zentraleurop¨aischen Flora. Band I. (Text und Karten). Fischer- Verlag, Jena.
[37] Minter, D. M. (1989), The leishmaniasis. In: Geographical distribution of arthropod-borne diseases and their principal vectors. WHO, Geneva (document WHO/VBC/89.967)
[38] Naderer, T., Ellis, M. A., Sernee, M. F., De Souza, D. P., Curtis, J., Handman, E., McConville, M. J. (2006), Virulence of Leishmania major in macrophages and mice requires the gluconeogenic enzyme fructose- 1,6-bisphosphatase. PNAS. 103(14): 5502–5507.
[39] Nakicenovic, N., Swart, R. (eds.) (2000), Emissions Scenarios. Cam- bridge University Press, Cambridge.
[40] Naucke, T. J. (2002), Leishmaniosis, a tropical disease and its vectors (Diptera Psychodidae, Phlebotominae) in Central Europe. Denisia. 6:
163–178.
[41] Pennisi, M. G. (2002), A high prevalence of feline leishmaniasis in south- ern Italy. In: Killick-Kendrick, R. (ed.): Canine leishmaniasis: mov- ing towards a solution. Proceedings of the Second International Canine Leishmaniasis Forum Seville, Spain. Intervet International, Boxmeer, The Netherlands. pp. 9–48.
[42] Peterson, A. T. (2006), Ecological niche modeling and spatial patterns of diseases transmission. Emerging Infectious Diseases, 12(12): 1822–1826.
[43] Peterson, A. T., Stewart, A., Mohamed, K. I., Ara´ujo, M. B. (2008), Shifting Global Invasive Potential of European Plants with Climate Change. PLoS ONE, 3(5): e2441.
[44] Pickett, S. T. A. (1989): Space-for-time substitution as an alternative to long-term studies. In: Likens, G. E. (ed.): Long-Term Studies in Ecology: Approaches and Alternatives. Springer, New York. pp. 110–
135.
[45] Ready, P. D. (2010), Leishmaniasis emergence in Europe. Euro Surveill, 15(10): 19505.
[46] Roeckner, E., B¨auml, G., Bonaventura, L., Brokopf, R., Esch, M., Gior- getta, M., Hagemann, S., Kirchner, I., Kornblueh, L., Manzini, E., Rhodin, A., Schlese, U., Schulzweida, U., Tompkins, A. (2003), The atmospheric general circulation model ECHAM 5. Part I: Model de- scription. Max-Planck-Institut f¨ur Meteorologie, Hamburg.
[47] Roeckner E., Brokopf, R., Esch, M., Giorgetta, M., Hagemann, S., Ko- rnblueh, L., Manzini, E., Schlese, U., Schulzweida, U. (2004), The at- mospheric general circulation model ECHAM 5. PART II: Sensitivity of Simulated Climate to Horizontal and Vertical Resolution. Max-Planck- Institut f¨ur Meteorologie, Hamburg.
[48] Rogers, D. J., Randolph, S. E. (2006), Climate Change and Vector-Borne Diseases. Advances in Parasitology, 62: 345–381.
[49] S´anchez, M., Herv´as, J., Chac´on, F., G´omez, J., Luicentes, J., Castrillo, J., P´erez, R., Pascual, F., Pascual, F. (2000), Evaluaci´on del gato com´un (Felis catus domesticus) como reservorio dela leishmaniosis enela cuenca mediterranea. Revista T´ecnica Veterinaria, Pequenos Animales. 24: 46–
54
[50] Serra-Diaz, J. M., Ninyerola, M., Lloret, F. (2012), Coexistence of Abies alba (Mill.) - Fagus sylvatica (L.) and climate change impact in the Iberian Peninsula: A climatic-niche perspective approach. Flora - Mor- phology, Distribution, Functional Ecology of Plants, 207(1): 10–18.
[51] Shaw, S. E., Lerga, A., Williams, S. (2003), Review of exotic infectious diseases in small animals entering the United Kingdom from aboard diagnosed by PCR. Vet. Rec., 152(6): 176–177.
[52] Skov, F., Svenning, J. C. (2004), Potential impact of climatic change on the distribution of forest herbs in Europe. Ecography, 27(3): 366–380.
[53] Solano-Gallego, L., Fern´andez-Bellon, H., Serra, R., G´allego, M., Ramis, A., Fondevila, D., Ferrer, L. (2003), Cutaneous leishmaniosis in three horses in Spain. Equine Vet J., 35(3): 320–323.
[54] Solano-Gallego, L., Guadalupe, M., Koutinas, M., Cardoso, L., Pen- nisi, M. G., Ferrer, L., Bourdeau, P., Gaetano, O., Baneth, G. (2011), LeishVet guidelines for the practical management of canine leishmanio- sis. Parasites & Vectors, 4: 86.
[55] Thuiller, W., Ara´ujo, M. B., Lavorel, S. (2004), Do we need land-cover data to model species distributions in Europe? Journal of Biogeography, 31(3): 353–361.
[56] Trotz-Williams, L. A., Trees, A. J. (2003): Systematic review of the distribution of the major vector-borne parasitic infections in dogs and cats in Europe. Veterinary Record, 152: 97–105.
[57] Tutin, T. G., Burges, N. A., Chater, A. O., Edmondson, J. R., Heywood, V. H., Moore, D. M., Valentine, D. H., Walters, S. M., Webb, D. A., Akeroyd, J. R., Newton, M. E., Mill, R. R. (1964), Flora Europaea. - Cambridge University Press, Cambridge. VBORNET (2013),
[58] VBORNET maps - Sandflies. ecdc.europa.eu/en/activities/disease- programmes/emerging and vector borne diseases/pages/ vbornet maps
sandflies.aspx?MasterPage=1. Last accessed: 2013.01.01.
[59] WHO (1984): The leishmaniases: report of an expert committee. WHO Tech Rep Ser 701: 1–140.