Article
The Negative Effect of Protein Phosphatase Z1 Deletion on the Oxidative Stress Tolerance of Candida albicans Is Synergistic with Betamethasone Exposure
Ágnes Jakab1,* , Tamás Emri1 , Kinga Csillag1, Anita Szabó1, Fruzsina Nagy2, Edina Baranyai3, Zsófi Sajtos3 , Dóra Géczi1, Károly Antal4 , RenátóKovács2,5 , Krisztina Szabó6 , Viktor Dombrádi6 and István Pócsi1
Citation: Jakab, Á.; Emri, T.; Csillag, K.; Szabó, A.; Nagy, F.; Baranyai, E.;
Sajtos, Z.; Géczi, D.; Antal, K.; Kovács, R.; et al. The Negative Effect of Protein Phosphatase Z1 Deletion on the Oxidative Stress Tolerance of Candida albicansIs Synergistic with Betamethasone Exposure.J. Fungi 2021,7, 540. https://doi.org/
10.3390/jof7070540
Academic Editor: Ronen Ben-Ami
Received: 3 June 2021 Accepted: 2 July 2021 Published: 6 July 2021
Publisher’s Note:MDPI stays neutral with regard to jurisdictional claims in published maps and institutional affil- iations.
Copyright: © 2021 by the authors.
Licensee MDPI, Basel, Switzerland.
This article is an open access article distributed under the terms and conditions of the Creative Commons Attribution (CC BY) license (https://
creativecommons.org/licenses/by/
4.0/).
1 Department of Molecular Biotechnology and Microbiology, Faculty of Science and Technology, University of Debrecen, 4032 Debrecen, Hungary; emri.tamas@science.unideb.hu (T.E.);
csillag.kinga@science.unideb.hu (K.C.); szaboanita991@gmail.com (A.S.); g.dora@med.unideb.hu (D.G.);
pocsiistvan@unideb.hu (I.P.)
2 Department of Medical Microbiology, Faculty of Medicine, University of Debrecen, 4032 Debrecen, Hungary;
nagy.fruzsina@med.unideb.hu (F.N.); kovacs.renato@med.unideb.hu (R.K.)
3 Agilent Atomic Spectroscopy Partner Laboratory, Department of Inorganic and Analytical Chemistry, University of Debrecen, 4032 Debrecen, Hungary; baranyai.edina@science.unideb.hu (E.B.);
sajtos.zsofi@science.unideb.hu (Z.S.)
4 Department of Zoology, Faculty of Sciences, Eszterházy Károly University, 3300 Eger, Hungary;
antalk2@gmail.com
5 Faculty of Pharmacy, University of Debrecen, 4032 Debrecen, Hungary
6 Department of Medical Chemistry, Faculty of Medicine, University of Debrecen, 4032 Debrecen, Hungary;
szabo.krisztina05@gmail.com (K.S.); dombradi@med.unideb.hu (V.D.)
* Correspondence: jakab.agnes@science.unideb.hu
Abstract:The glucocorticoid betamethasone (BM) has potent anti-inflammatory and immunosup- pressive effects; however, it increases the susceptibility of patients to superficialCandidainfections.
Previously we found that this disadvantageous side effect can be counteracted by menadione sodium bisulfite (MSB) induced oxidative stress treatment. The fungus specific protein phosphatase Z1 (CaPpz1) has a pivotal role in oxidative stress response ofCandida albicansand was proposed as a potential antifungal drug target. The aim of this study was to investigate the combined effects ofCaPPZ1gene deletion and MSB treatment in BM pre-treatedC. albicanscultures. We found that the combined treatment increased redox imbalance, enhanced the specific activities of antioxidant enzymes, and reduced the growth in cappz1 mutant (KO) strain. RNASeq data demonstrated that the presence of BM markedly elevated the number of differentially expressed genes in the MSB treated KO cultures. Accumulation of reactive oxygen species, increased iron content and fatty acid oxidation, as well as the inhibiting ergosterol biosynthesis and RNA metabolic processes explain, at least in part, the fungistatic effect caused by the combined stress exposure. We suggest that the synergism between MSB treatment and CaPpz1 inhibition could be considered in developing of a novel combinatorial antifungal strategy accompanying steroid therapy.
Keywords:antifungal therapy;Candida albicans; combinatorial stress; glucocorticoid; menadione;
oxidative stress; protein phosphatase Z1; stress response; transcriptome analysis
1. Introduction
Betamethasone (BM) is an effective anti-inflammatory, immunosuppressive, vaso- constriction and antiproliferative agent widely used in various medical treatments [1,2].
However, increased susceptibility to superficial and invasiveCandidainfections has been reported in these BM-based therapies [1,3]. According to previous studies, long-lasting treatment of asthma bronchiale and chronic pulmonary disease with inhaled glucocorti- coids is a potential risk for the development of oral candidiasis [4]. Furthermore, gluco-
J. Fungi2021,7, 540. https://doi.org/10.3390/jof7070540 https://www.mdpi.com/journal/jof
corticoid therapies promote candidiasis in patients who suffer from acute renal failure, cancerous disease, systemic lupus erythematosus or who have undergone bone-marrow or solid-organ transplantation [1,3,5,6]. High dose glucocorticoid treatments with methyl- prednisolone or BM stimulate hypha formation, as well as the production of extracellular phospholipase and aspartic protease byCandida albicansand also stimulate an interaction betweenC. albicansand the gut epithelium resulting in the colonization of the gastroin- testinal tract [7–10]. Hence, new alternative therapeutic approaches are urgently needed to improve the efficiency of anti-Candidamedication and hereby maintain the quality of life of glucocorticoid-treated patients.
Our previous studies showed glucocorticoid exposures enhance the susceptibility of yeast cells to oxidants such as the superoxide-generating agent menadione sodium bisulfite (MSB; a water-soluble form of menadione) [7,8]. Therefore, the combination of topical glucocorticoid-containing drugs with certain menadione derivatives might be a promising approach for the development of novel antifungal therapeutic strategies, e.g., in dermatology [11,12].
TheC. albicansprotein phosphatase Z1 (CaPpz1) enzyme has been pinpointed as a potential target in healingCandidainfections of the skin [13]. CaPpz1 has a pivotal role in cation homeostasis, cell wall biosynthesis and the pathogenicity ofC. albicans[14]. PPZ- type phosphatases are involved in the oxidative stress tolerance of various fungi, including C. albicans,Saccharomyces cerevisiae,Aspergillus nidulansandAspergillus fumigatus[15,16].
Recently we reported that deletion of the fungus specificCaPPZ1gene enhanced the sensi- tivity ofC. albicansto oxidative stress elicited bytert-butyl hydroperoxide (tBOOH) [17].
To extend our knowledge of the stress response system ofC. albicans, the present study has investigated the combined effects ofCaPPZ1gene deletion and MSB mediated oxidative stress treatments on the physiological and transcriptional responses of the BM- exposedC. albicanscultures. Our data suggests that the deletion of theCaPPZ1gene and/or the glucocorticoid treatment alone had only slight effects on the transcriptome. In contrast, the combination of MSB treatment andCaPPZ1gene deletion resulted in profound global alterations in the gene expression patterns, and the transcriptome changes were even more pronounced when these cells were also treated with glucocorticoid.
2. Materials and Methods 2.1. Cultivation of Fungal Strains
The control (WT)C. albicansQMY23 (his1∆/his1∆, leu2∆:C. dubliniensisHIS1/leu2∆:C.
maltoseLEU2, URA3/ura3∆:imm434, IRO1/iro1∆:imm434) and the phosphatase gene dele- tion mutant (KO) (ura3∆-iro1∆:imm434/URA3-IRO1, his1∆/his1∆, leu2∆/leu2∆, ppz1∆:C.
dubliniensisHIS1/ppz1∆:C. maltosaLEU2) strains were constructed earlier by Mitrovich et al. [18] and Ádám et al. [14], respectively. These strains were maintained and cul- tured on yeast extract-peptone-dextrose (YPD) agar (1% yeast extract (Alfa Aesar, Kandel, Germany), 2% mycological peptone (HiMedia, Mumbai, India), 2% dextrose (VWR Inter- national LLC., Debrecen, Hungary) and±2% agar (VWR International LLC., Hungary), pH 5.6) as described earlier [17]. Unless otherwise indicated, all chemicals were purchased from Sigma-Aldrich Hungary Ltd., Budapest, Hungary.
2.2. Stress Treatments
Yeast pre-cultures were grown in 5 mL YPD medium at 37◦C for 18 h, diluted to the optical density of 0.1 atλ= 640 nm (OD640) with YPD (defined as 0 h incubation time in growth assays) and the cultures were grown further at 37◦C and at 2.3 Hz shaking frequency.
For testing the long-term physiological responses of BM and/or MSB treated and untreatedC. albicansstrains, selected cultures were also supplemented with 2 mM BM (the water-soluble sodium phosphate derivative) and/or 0.5 mM MSB at 0 h and microbial growth was followed by measuring changes in OD640during a 12 h incubation period [8].
Importantly, the 2 mM BM concentration used in this study was comparable to the glu-
cocorticoid concentrations typically employed in drops, lotions and gels widely used in topical therapies in ophthalmology, dermatology and gynecology.
To study the effects of oxidative stress on short-term transcriptional and physiological responses of the BM exposed and untreatedC. albicansstrains, pre-cultures were diluted to 0.1 OD640in YPD medium, selected cultures were supplemented with 2 mM BM at 0 h and oxidative stress treatments (with or without 1.5 mM MSB) were carried out subsequently, for 1 or 4 h incubation periods. In these experiments, the sublethal MSB concentration of 1.5 mM was chosen because this was the highest oxidant concentration that did not significantly affect the viability of either the WT or the oxidative stress sensitive KO strains within 1 h. After addition of MSB, changes in the OD640and colony forming unit (CFU) values were determined. Samples were taken at 1 h for RNA isolation and for measurement of redox changes and specific enzyme activities, since the response of fungal cells to redox imbalance is a rapidly induced protective mechanism [17]. Four hours MSB stress exposures were used for the determination of the more slowly evolving changes in glucose consumption, ethanol production and metal contents.
2.3. RNA Sequencing (RNASeq)
Total RNA samples were isolated from lyophilizedC. albicanscells (CHRIST Alpha 1−2 LDplus lyophilizer, Osterode, Germany) according to Jakab et al. [19]. Three indepen- dent cultures were used for RNASeq experiments and RT-qPCR tests. The quality of RNA was determined using the Eukaryotic Total RNA Nano kit (Agilent, Santa Clara, CA, USA) along with Agilent Bioanalyzer. RNASeq libraries were prepared from total RNA using TruSeq RNA Sample preparation kit (Illumina, San Diego, CA, USA) according to the man- ufacturer’s protocol. Seventy-five bp long sequence reads were determined on Illumina NextSeq500 instrument. Approximately 16–36 million reads per sample were generated at the Genomic Medicine and Bioinformatics Core Facility of the Department of Biochem- istry and Molecular Biology, Faculty of Medicine, University of Debrecen, Hungary. Raw reads were aligned to the reference genome (genome: “http://www.candidagenome.org/
download/sequence/C_albicans_SC5314/Assembly22/archive/C_albicans_SC5314_version_
A22-s07-m01-r85_chromosomes.fasta.gz”, accessed on 2 July 2021, features: “http://www.
candidagenome.org/download/gff/C_albicans_SC5314/archive/C_albicans_SC5314_version_
A22-s07-m01-r85_features_with_chromosome_sequences.gff.gz”, accessed on 2 July 2021) and the aligned reads varied between 93–95% in each sample. Tophat (v.2.1.1) and Bowtie (v.2.3.4.1) bioinformatics tools were used for the mapping and generating bam files and htseq-counts (from “HTSeq” framework, version 0.6.1p1) to produce read counts for A and B alleles. The read counts of the corresponding A and B alleles were merged and these values were used for differential expression analysis using DESeq2 (v.1.24.0) according to Love et al. [20]. We used the “DESeq” function to fit a model allowing for batch effects to the data. Only significantly up- and down-regulated genes with a correctedpvalue of
<0.05 were considered during the evaluation process. Original data obtained in this work have been deposited in NCBI’s Gene Expression Omnibus [21] and are accessible through GEO Series accession number GSE173668 (https://www.ncbi.nlm.nih.gov/geo/query/
acc.cgi?acc=GSE173668, accessed on 5 July 2021).
2.4. Reverse Transcription Quantitative Real-Time PCR (RT-qPCR) Assay
Changes in the transcription of selected antioxidant enzyme, membrane transport and primary metabolism genes were validated by RT-qPCR [19]. Oligonucleotide primers (Table S1) were designed with Oligo Explorer (v.1.1.) and Oligo Analyzer (v.1.0.2) software.
Relative transcription levels (∆∆CP value) were calculated as ∆CPcontrol − ∆CPtreated where∆CPcontrol= CPtested gene, control−CPreference gene, controlfor untreated control while
∆CPtreated= CPtested gene, treated−CPreference gene, treatedfor stress-exposed cultures. The CP values represent the RT-qPCR cycle numbers of crossing points. Three reference genes (ACT1,EFG1andRIP1) were tested. All showed stable transcription in our experiments and, hence, only data relative to theACT1(C1_13700W) transcription values are presented.
2.5. Gene Set Enrichment Analysis
Gene set enrichment analyses were carried out withCandidaGenome Database Gene Ontology Term Finder (http://www.candidagenome.org/cgi-bin/GO/goTermFinder, ac- cessed on 5 July 2021) using function, process and component gene ontology (GO) terms.
Only hits with apvalue of < 0.05 were evaluated further (Table S2).
Besides GO terms, groups of functionally related genes were also generated by extract- ing data from theCandidaGenome Database (http://www.candidagenome.org, accessed on 5 July 2021) unless otherwise indicated. The enrichment of genes from these gene groups were tested with Fisher’s exact test (p< 0.05). The following gene groups were created:
(i) antioxidant enzyme genes—this gene group includes genes encoding functionally verified and/or putative antioxidant enzymes including the catalase (GOID: 4096), superoxide dismutase (GOID: 4784), glutaredoxin (GOID: 6749), thioredoxin (GOIDs:
8379 and 51920) and peroxidase (GOID: 4601) GO terms;
(ii) iron metabolism-related genes—genes involved in iron acquisition byC. albicanswere collected according to Fourie et al. [22];
(iii) zinc and copper homeostasis genes—genes involved in zinc and copper acquisition byC. albicanswere collected according to Gerwien et al. [23];
(iv) metabolic pathway-related genes—this group contains all genes related to the TCA, ethanol fermentation, glycogen metabolism, and ergosterol biosynthesis biochemical pathways according to the pathway database (http://pathway.candidagenome.org, accessed on 5 July 2021).
The complete gene lists of the above-mentioned gene groups are available in Supple- mentary Table S3.
2.6. Determination of Virulence Attributes
Virulence attributes of BM pre-treated and untreatedC. albicanscells, including ex- tracellular aspartic proteinase and phospholipase activities, were measured on bovine serum albumin (BSA) and solid egg yolk (EY) medium, respectively, and hypha formation was determined on solid Spider agar by methods described earlier [8,19]. In these assays, pre-cultures were diluted to 0.1 OD640in YPD supplemented with or without 2 mM BM, and the cultures were incubated for 5 h at 37◦C and 2.3 Hz shaking frequency. Fungal cells were collected by centrifugation (5 min, 4000×g, 4◦C), washed three times with phosphate-buffered saline (PBS) solution and adjusted to 1×10⁷cells/mL in PBS. The cell suspensions were point-inoculated onto the surface of the selected agar plates and then incubated at 30◦C. Enzyme activities (Pz values) were determined by dividing the colony diameter and precipitation zones on EY plates or clear areas on BSA media-plus-colony diameter after 5 days of incubation at 30◦C. Hypha forming ability on Spider agar was measured after 7 and 10 days incubations, and hyphal growth (%) was calculated using the following formula: (width of hyphal ring)/(colony diameter + hyphal ring)×100 [8,19].
Biofilm Development and Metabolic Activity-Based Susceptibility Testing
One-day-old biofilms were prepared as described previously [24]. Briefly, C. al- bicanscells were suspended in RPMI 1640 liquid medium in a final concentration of 1×10⁶cells/mL and aliquots of 0.1 mL were pipetted onto flat-bottom 96-well sterile microtiter plates (TPP, Trasadingen, Switzerland) and incubated statically at 37◦C for 24 h.
The susceptibility to BM and MSB was tested by using the broth microdilution method according to the CLSI approved standard M27-A3 protocol [25]. The concentration ranges tested for biofilm minimum inhibitory concentration (MIC) determinations were selected between 0.06–4.0 mM and 0.008–2.0 mM for BM and MSB, respectively. The biofilms were washed three times with sterile physiological saline and, MIC determinations were performed in RPMI 1640 using the metabolic activity change-based XTT [2,3-bis(2-methoxy- 4-nitro-5-sulfophenyl)-2H-tetrazolium-5-carboxanilide] reduction assay. MIC values were considered as the lowest drug concentrations that caused at least a 50% reduction in metabolic activity compared to untreated biofilms. The interaction between BM and MSB
was evaluated using a two-dimensional broth microdilution chequerboard assay against one-day-old biofilms [26]. The nature of the interaction was also analyzed by fractional inhibitory concentration index (FICI) determination. The tested BM and MSB concentra- tions were the same as those used for the MIC determination. FICIs were calculated by following formula:ΣFIC = FICA+ FICB= MICAcomb/MICAalone+ MICBcomb/MICBalone, where MICAaloneand MICBaloneare MICs of compounds A and B when tested alone and MICAcomband MICBcombshow the MICs of compounds A and B, respectively, when they are used in combination. FICIs were determined as the lowestΣFIC values. The interaction between BM and MSB were defined as synergistic when FICI was≤0.5, as indifferent when FICI was between > 0.5 and 4, and as antagonistic when FICI was >4.
2.7. Assays of Redox Homeostasis and Antioxidant Enzyme Activities
Intracellular conversion of 20,70-dichlorodihydrofluorescein diacetate (H2DCFDA, a non-fluorescent compound) to 20,70-dichlorofluorescein (DCF; fluorescent) is a widely used method to determine the redox changes and mitochondrial function [8]. For measuring DCF production and antioxidant enzyme activities, standard unstressed (without or with 2 mM BM) or stressed (1.5 mM MSB added at 4 h culture time) cultures were grown and processed as described below.
For the estimation of DCF production, the fungal cells were supplemented with H2DCFDA after 1 h MSB exposure, and samples were taken an hour later, washed with PBS, and re-suspended in 5% sulfosalicylic acid solution. The DCF production was determined spectrofluorimetrically [8].
In order to determine specific antioxidant enzyme activities,C. albicanscells harvested after 1 h MSB exposure were thoroughly washed and disrupted using glass beads (1 mm diameter). Glutathione reductase, glutathione peroxidase, catalase and superoxide dismutase activities of the supernatant were determined using the spectrophotometric methods as reported by Jakab et al. [8]. The protein concentration of cell-free extracts was measured by the Bradford method [27].
2.8. Assay of Glucose Consumption, Ethanol Production, and Iron, Zinc and Copper Contents of C.
albicans Cells
Yeast pre-cultures were grown, and BM pre-treatments and MSB exposures were performed as described above for short-term exposure assays. Aliquots of C. albicans culture media were collected by centrifugation (5 min, 4000×g, 4◦C) after 4 h incubation following MSB exposure. Fungal dry cell mass (DCM) was measured after freeze-drying the biomass [28].
Changes in the glucose contents of the supernatants were determined by the glucose oxidase assay reported by Leary [29] and Boczonádi et al. [30]. In this reaction rate-based assay the mixtures contained 0.76 mmol/L 4-aminoantipyrine, 11 mmol/L phenol, 4 kU/L glucose oxidase and 1 kU/L peroxidase dissolved in 0.1 mol/L sodium-potassium phosphate (pH 6.6) buffer. The absorbance was measured immediately atλ= 500 nm.
The concentration of ethanol inC. albicansculture media was determined by headspace gas chromatography (HS-GC-FID system, PerkinElmer GC, Clarus 680 with PerkinElmer TurboMatrix 40 Trap Headspace Sampler, FID with helium as the carrier gas 1 mL/min) as described previously [31,32]. Static HS injection was made with a 1µL injection volume, and a capillary column (Agilent, DB−5.625, 30 m×0.25 mm I.D.) was used for separation.
Data analysis was performed with the PerkinElmer TotalChrom Workstation V.6.3.2 Data System.
For element analyses, fungal cells were grown, processed and lyophilized as described above. The metal (Fe, Zn, Cu) contents of the dry biomass were measured by inductively coupled plasma optical emission spectrometry (ICP-OES; 5110 Agilent Technologies, Santa Clara, CA, USA) following atmospheric wet digestion in 5 mL, 65% (M/M) HNO3and 0.5 mL, 30% (M/M) H2O2in glass beakers [28,30].
Glucose consumption, ethanol production and metal contents of the samples were calculated and expressed in DCM units (g/g), as described elsewhere [30].
2.9. Statistical Analysis
Unless otherwise indicated, all experiments were performed in triplicates and mean
± standard deviation (SD) values were calculated. Statistical significance of changes was determined by paired Student’sttest. Probability levelsp< 0.05 were regarded as significant. Interaction between the effects of BM and MSB, as well as between MSB and CaPPZ1deletion analyzed by two-way ANOVA.
3. Results
3.1. BM and MSB Suppressed Growth and Metabolic Activity of Biofilm Synergistically
In our long term physiological experiments, the growth rates of the KO strain were always lower than those of the WT in agreement with previous observations [17]. 0.5 mM MSB reduced the growth (OD640) of both strains, but MSB had a stronger inhibitory effect on the KO strain (Figure S1). Significant interaction (p< 0.05) was also observed between the growth inhibitory effect of BM and MSB, as well as between MSB andCaPPZ1deletion for KO cells. Importantly, the combined BM + MSB treatment slowed growth but did not block growth of the deletion mutant completely (Figure S1). This triple perturbation was fungistatic since CFUs were essentially unchanged (in the range of 7.5±0.5×10⁵to 1±0.2×10⁶cell/mL) during the 12 h incubation.
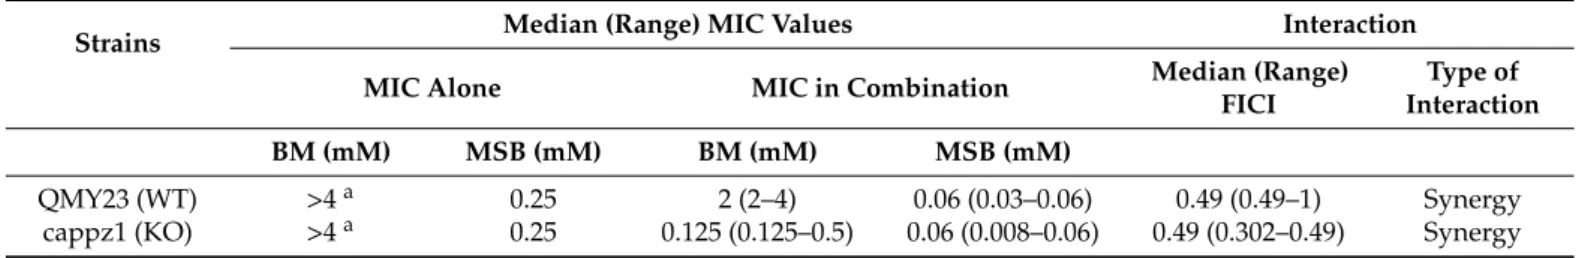
The interaction between BM and MSB was also studied onC. albicansbiofilms by a two-dimensional broth microdilution chequerboard assay on one-day-old biofilms after 24 h incubation. BM alone had no detectable effect and MSB reduced metabolic activity with a median MIC of 0.25 mM both in the WT and the KO strains. Furthermore, based on calculated median FICI values, a weak synergistic interaction between BM and MSB was observed for the two tested strains (median FICIs were 0.49) (Table1).
Table 1.Betamethasone (BM) or/and menadione sodium bisulfite (MSB) susceptibility ofC. albicansbiofilms.
Strains Median (Range) MIC Values Interaction
MIC Alone MIC in Combination Median (Range)
FICI
Type of Interaction
BM (mM) MSB (mM) BM (mM) MSB (mM)
QMY23 (WT) >4a 0.25 2 (2–4) 0.06 (0.03–0.06) 0.49 (0.49–1) Synergy
cappz1 (KO) >4a 0.25 0.125 (0.125–0.5) 0.06 (0.008–0.06) 0.49 (0.302–0.49) Synergy Median (range) values calculated from three independent experiments are presented. aMinimum inhibitory concentration (MIC) is off-scale at >4 mM, 8 mM (one dilution higher than the highest tested concentration) was used for fractional inhibitory concentration index (FICI) analysis.
3.2. Genome-Wide Transcriptional Changes Confirmed the Interaction between BM and MSB Treatments
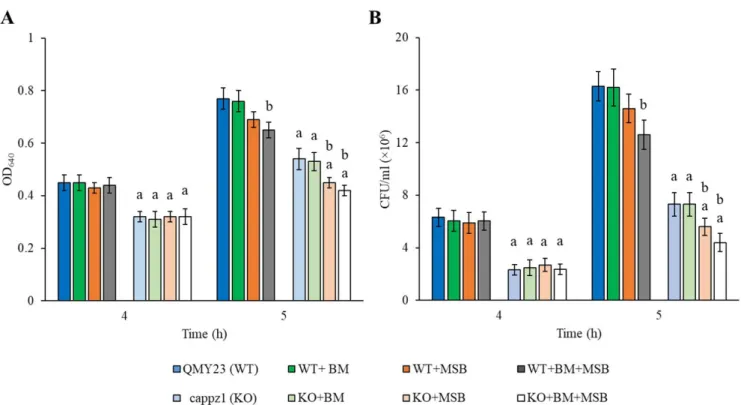
Short term transcriptional responses were studied in eight different cultures: i.e., in untreated control, BM alone, MSB alone, and BM + MSB combined treated WT and KO strains. In these experiments, half of the BM (2 mM) pre-treated and untreated cultures were supplemented with 1.5 mM MSB at 4 h incubation time and samples were collected after 1 h exposure. Figure1demonstrates that MSB treatment gave significantly lower OD640and CFU values only in the BM pre-treated WT cultures. In contrast, the same MSB concentration reduced the growth of both BM pre-treated and untreated KO cultures, and additive interaction between BM and MSB as well as between MSB andCaPPZ1deletion was observed after 1 h MSB exposure (Figure1).
Figure 1. The physiological effect ofC. albicansprotein phosphatase Z1 (CaPPZ1) gene deletion, betamethasone (BM) treatment or/and oxidative stress on the growth rate of QMY23 (WT) and cappz1 mutant (KO)C. albicansstrains. Selected cultures were supplemented with 2 mM BM at 0 h incubation time and oxidative agent (+1.5 mM MSB) at 4 h incubation.
The effect of treatments was followed by measuring the optical density (OD640) (A) and colony forming unit (CFU) (B) after 4th and 5th of culturing. Mean±SDvalues calculated from three independent experiments are presented.aandbindicate significant differences atp< 0.05 significance level in comparison to WT strain (untreated KO vs. untreated WT and treated KO vs. treated WT) and to untreated controls (treated WT vs. untreated WT and treated KO vs. untreated KO), respectively.
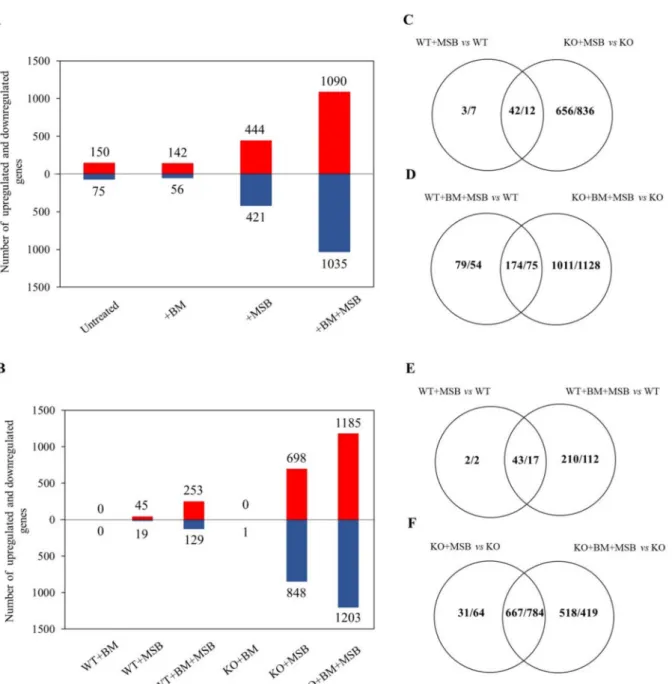
The mRNA complement of these samples was investigated by RNASeq and RT- qPCR. Reproducible relationships between RNASeq results were confirmed by principal component analysis (Figure S2). The effects ofCaPPZ1mutation as well as those of BM and MSB exposures on the transcriptomes are summarized in Figure2. Deletion ofCaPPZ1 induced a moderate change in the transcriptome even in untreated or BM pre-treated cultures and the difference between the KO and WT strains increased substantially after MSB treatments (Figure2A). Significant overlaps were found between the two strains but the oxidative stress altered the expression of additional genes in the KO (Figure2C,D). BM pre-treatment alone hardly affected the gene expression in WT or KO strains (Figure2A,B).
The effect of MSB treatment was more pronounced on theCaPPZ1deleted strain because the expression of 24 times more genes was altered in the KO mutant strain than in WT reference culture (45/19 and 689/848 genes up/down in the control and the mutant strains).
Importantly, BM pre-treatment markedly increased the number of differentially expressed genes in both the MSB treated WT and KO cells (253/129 vs. 1185/1203 genes up/down in WT vs. KO) (Figure2B). The overlaps between MSB and BM + MSB responsive genes were considerable (43/17 vs. 667/784 genes up/down in WT vs. KO) (Figure2E,F), but the expression of several genes changed only in response to combined BM + MSB treatments.
Figure 2.Effects ofC. albicansprotein phosphatase Z1 (CaPPZ1) deletion and stress conditions on the transcriptome ofC.
albicans. (A) Number of genes up- or down-regulated due toCaPPZ1gene deletion alone (untreated) or in the presence of betamethasone (BM), menadione sodium bisulfite (MSB) or BM + MSB as compared to WT under the same experimental conditions. Significantly up- and down-regulated genes with a correctedpvalue of <0.05 were taken into consideration during the evaluation process. (B) Number of genes that were up- or down-regulated by BM, MSB or BM + MSB treatments in the QMY23 (WT) or cappz1 mutant (KO) strain. In (A,B) up- and down-regulated genes are represented by red and blue bars, respectively. (C–F) Venn diagrams show the number of up-regulated over down-regulated genes under MSB or BM + MSB treatment conditions in four different comparisons. The effects ofCaPPZ1gene deletion, BM pre-treatment and/or oxidative stress (MSB) on the growth rates are presented in Figure1.
A significant portion of the RNASeq-based gene expression data were confirmed by RT-qPCR analyses. The transcriptional changes of 16 genes selected for RT-qPCR testing showed a strong positive correlation between the results obtained for both methods (Table S4). Pearson’s correlation coefficients were in the range of 0.73–0.90 for both strains.
3.3. Gene Ontology Analysis of the Transcriptome Changes
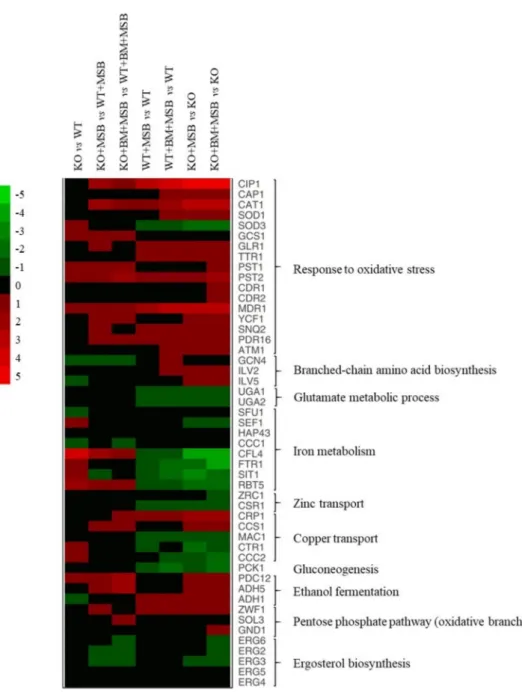
The possible physiological background of the transcriptional changes for upregulated and downregulated genes was further characterized using gene set enrichment analyses (Tables2, S2 and S3) and selected changes are illustrated in a heat map (Figure3).
Figure 3.The effects ofC. albicansprotein phosphatase Z1 (CaPPZ1)deletion and stress conditions on the expression of selected genes ofC. albicans. The heat map demonstrates the expression profiles of representative genes according to the color scale that indicates gene expression changes in log2FC units. Supplementary Table S3 summarizes the data that were used for the construction of the heat map.
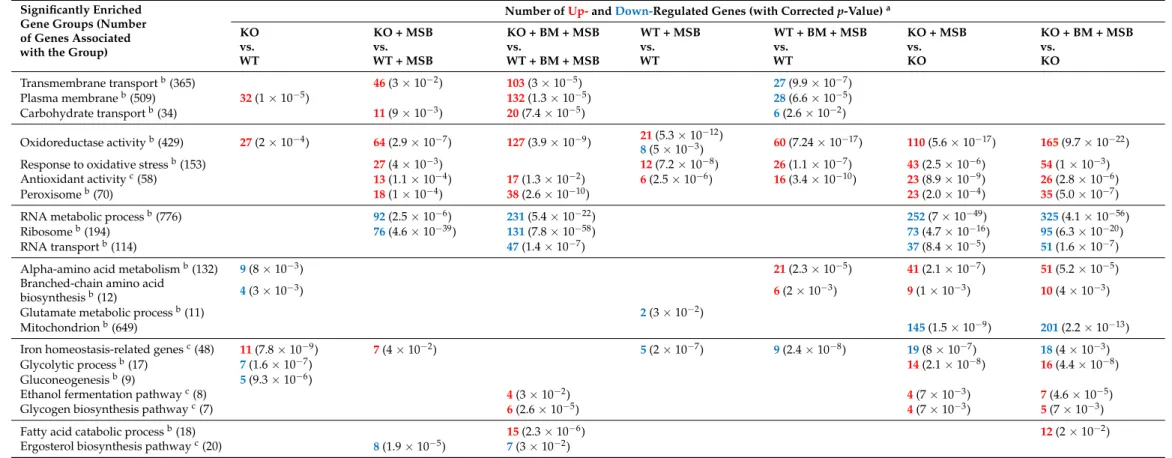
Table 2.Summary of gene enrichment analyses.
Significantly Enriched Gene Groups (Number of Genes Associated with the Group)
Number ofUp-andDown-Regulated Genes (with Correctedp-Value)a KO
vs.
WT
KO + MSB vs.
WT + MSB
KO + BM + MSB vs.
WT + BM + MSB
WT + MSB vs.
WT
WT + BM + MSB vs.
WT
KO + MSB vs.
KO
KO + BM + MSB vs.
KO
Transmembrane transportb(365) 46(3×10⁻²) 103(3×10⁻⁵) 27(9.9×10⁻⁷)
Plasma membraneb(509) 32(1×10⁻⁵) 132(1.3×10⁻⁵) 28(6.6×10⁻⁵)
Carbohydrate transportb(34) 11(9×10⁻³) 20(7.4×10⁻⁵) 6(2.6×10⁻²)
Oxidoreductase activityb(429) 27(2×10⁻⁴) 64(2.9×10⁻⁷) 127(3.9×10⁻⁹) 21(5.3×10⁻¹²)
8(5×10⁻³) 60(7.24×10⁻¹⁷) 110(5.6×10⁻¹⁷) 165(9.7×10⁻²²)
Response to oxidative stressb(153) 27(4×10⁻³) 12(7.2×10⁻⁸) 26(1.1×10⁻⁷) 43(2.5×10⁻⁶) 54(1×10⁻³)
Antioxidant activityc(58) 13(1.1×10⁻⁴) 17(1.3×10⁻²) 6(2.5×10⁻⁶) 16(3.4×10⁻¹⁰) 23(8.9×10⁻⁹) 26(2.8×10⁻⁶)
Peroxisomeb(70) 18(1×10⁻⁴) 38(2.6×10⁻¹⁰) 23(2.0×10⁻⁴) 35(5.0×10⁻⁷)
RNA metabolic processb(776) 92(2.5×10⁻⁶) 231(5.4×10⁻²²) 252(7×10−49) 325(4.1×10−56)
Ribosomeb(194) 76(4.6×10−39) 131(7.8×10−58) 73(4.7×10⁻¹⁶) 95(6.3×10⁻²⁰)
RNA transportb(114) 47(1.4×10⁻⁷) 37(8.4×10⁻⁵) 51(1.6×10⁻⁷)
Alpha-amino acid metabolismb(132) 9(8×10⁻³) 21(2.3×10⁻⁵) 41(2.1×10⁻⁷) 51(5.2×10⁻⁵)
Branched-chain amino acid
biosynthesisb(12) 4(3×10⁻³) 6(2×10⁻³) 9(1×10⁻³) 10(4×10⁻³)
Glutamate metabolic processb(11) 2(3×10⁻²)
Mitochondrionb(649) 145(1.5×10⁻⁹) 201(2.2×10⁻¹³)
Iron homeostasis-related genesc(48) 11(7.8×10⁻⁹) 7(4×10⁻²) 5(2×10⁻⁷) 9(2.4×10⁻⁸) 19(8×10⁻⁷) 18(4×10⁻³)
Glycolytic processb(17) 7(1.6×10⁻⁷) 14(2.1×10⁻⁸) 16(4.4×10⁻⁸)
Gluconeogenesisb(9) 5(9.3×10⁻⁶)
Ethanol fermentation pathwayc(8) 4(3×10⁻²) 4(7×10⁻³) 7(4.6×10⁻⁵)
Glycogen biosynthesis pathwayc(7) 6(2.6×10⁻⁵) 4(7×10⁻³) 5(7×10⁻³)
Fatty acid catabolic processb(18) 15(2.3×10⁻⁶) 12(2×10⁻²)
Ergosterol biosynthesis pathwayc(20) 8(1.9×10⁻⁵) 7(3×10⁻²)
aBold numbers represent the up-regulated (red) or down-regulated (blue) genes belonging to gene groups in comparisons where the enrichment was significant;pvalues are given in parentheses. Up- and down-regulated genes were defined as differentially expressed genes (correctedpvalue of <0.05).bSelected significant Gene Ontology (GO) terms (p< 0.05) were identified with the aid ofCandidaGenome Database Gene Ontology Term Finder (http://www.candidagenome.org/cgi-bin/GO/goTermFinder, accessed on 5 July 2021). The full list of the significantly enriched GO terms is available in Supplementary Table S2.cThe enrichment of these gene groups was tested by Fisher’s exact test (p< 0.05). Further data on the gene groups are available in Supplementary Table S3.
3.3.1. The CaPPZ1 Gene Deletion Has a Moderate Transcriptomic Effect
The lack of CaPpz1 protein phosphatase alone resulted in up-regulation of 11 iron homeostasis-related genes (e.g.,CFL4, ferric reductaseSIT1, siderophore transporter, and RBT5, hemoglobin utilization) and 27 genes encoding oxidoreductases (e.g.,PST1andPST2, flavodoxin-like proteins,SOD3, superoxide-dismutase, andGCS1,γ-glutamyl cysteine synthase) under standard unstressed culture conditions (Figure3, Tables2, S2 and S3). The upregulation ofCFL4andSOD3was supported by RT-qPCR data (Figure3and Table S4).
Deletion of theCaPPZ1gene down-regulated seven genes of glycolysis, five genes of gluconeogenesis, as well as nine genes of alpha-amino acid metabolism including four genes of branched-chain amino acid synthesis (e.g.,GCN4, transcription factor) (Figure3 and Table2).
3.3.2. The Cellular Response to the Oxidative Stress Was More Extensive in the Cappz1 Knock Out Strain
Altogether, 12 oxidative stress response genes were up-regulated in the WT strain after exposure to MSB (e.g., genes ofCIP1oxidoreductase,TRR1thioredoxin reductase,MDR1 andYCF1ABC transporters) (Figure3, Tables2, S2 and S3). Upregulation ofMDR1and TRR1under MSB stress in control and BM pre-treated strains was also confirmed by RT- qPCR data (Table S4). MSB treatment down-regulated glutamate metabolism (UGA1, GABA transaminase, andUGA2, succinate semialdehyde dehydrogenase), andPCK1encoding a key enzyme specific to gluconeogenesis in the WT strain (Figure3, Tables2, S2 and S3).
Downregulation of PCK1 under MSB and BM + MSB treatments in both strains was confirmed by RT-qPCR data (Table S4).
In the case of the KO mutant, 43 genes related to oxidative stress response, nine genes of branched-chain amino acid synthesis (e.g.,GCN4, transcription factor,ILV2and ILV5, isoleucine biosynthesis enzymes), copper access (CRP1, transporter, andCCS1, chap- erone), glycolysis (14 genes), ethanol fermentation (four genes), glycogen biosynthesis (four genes), and 23 genes of peroxisome proteins (including peroxisome related and fatty acidβ-oxidation genes) were significantly enriched in the up-regulated gene set (Figure3, Tables2, S2 and S3). Genes involved in iron homeostasis (19 genes), copper uptake (MAC1, transcription factor;CTR1andCCC2, transporters), zinc metabolism (CSR1, transcription factor, andZRC1, transporter) as well as in RNA metabolism (252 genes), the ribosome (73 genes), RNA transport (37 genes) and the mitochondrion (145 genes) were enriched in the down-regulated gene set (Figure3, Tables2, S2 and S3). The KO + MSB vs. WT + MSB comparison indicated that oxidative stress decreased the expression of eight ergosterol biosynthesis pathway related genes in KO cells (Table2).
Upregulation of three oxidative stress response genes (CAT1, catalase;SOD1, cytoso- lic Cu and Zn-containing superoxide dismutase, andGLR1, glutathione reductase) and downregulation ofSOD3(coding for cytosolic Mn-containing superoxide dismutase),CFL4 (ferric reductase) andFTR1(iron permease) iron homeostasis-related genes in untreated and BM pre-treated KO cells were also confirmed by RT-qPCR (Figure3and Table S4).
3.3.3. Combination of CaPPZ1 Gene Deletion and MSB Stress Led to a Global Reprogramming of Gene Expression in BM Pre-Treated Cells
MSB treatment resulted in enrichment of the up-regulated oxidative stress response (altogether 26 genes e.g.,SNQ2andPDR16encoding ABC transporters) and alpha-amino acid metabolic process (21 genes) genes and, concomitantly resulted in the downregulation of transmembrane transport (28 genes) including H(+)-ATPase (PMA1), carbohydrate transport (6 genes), and iron transport (9 genes), as well as two key genes specific to gluco- neogenesis (likePCK1) in the BM pre-treated WT cultures (Figure3, Tables2, S2 and S3).
The same treatment significantly enriched the up-regulated oxidative stress response (54 genes e.g.,CDR1,CDR2, andMDR1), peroxisome (35 genes), alpha-amino acid synthesis (51 genes), ethanol fermentation (7 genes), and fatty acid catabolism (12 genes) in the KO strain. At the same time, RNA metabolism (325 genes), the ribosome (95 genes), RNA trans-
port (51 genes), and the mitochondrion (201 genes) were enriched in the downregulated gene set (Figure3, Tables2, S2 and S3). The mutation also caused a significant increase in the expression ofCDR1(ABC transporter),PXP2(acyl-CoA oxidase enzyme of fatty acid β-oxidation) andHGT17(hexose transmembrane transporter) of BM + MSB treated cells according to the RT-qPCR measurements (Table S4). In addition, the combined treatment increased the expression of oxidative branch of the pentose phosphate pathway-related genes (ZWF1,SOL3, andGND1) (Figure3).
3.4. Testing of the Predicted Consequences of Transcriptome Changes
Some of the possible physiological consequences deduced from the transcriptomic changes described in the previous sections were scrutinized in the following experiments.
3.4.1. BM Did Not Influence the Growth, Extracellular Phospholipase and Proteinase Production and Hypha Formation ofC. albicans
As BM did not affect the gene expression ofC. albicans, first we studied the physiologi- cal effects of BM on the wild-type and deletion mutant strains after 5 h steroid exposure.
We found that the BM pre-treatment did not affect the growth (OD640) ofC. albicanscells at the pharmacologically relevant concentration of 2 mM (p> 0.05) (Figure1). Furthermore, it did not significantly influence the extracellular proteinase and phospholipase activities and the hypha formation of the testedC. albicansstrains (p> 0.05). On the other hand, as expected, deletion ofCaPPZ1significantly reduced the yeast to hyphae morphological transitions compared to the reference strain (Table3).
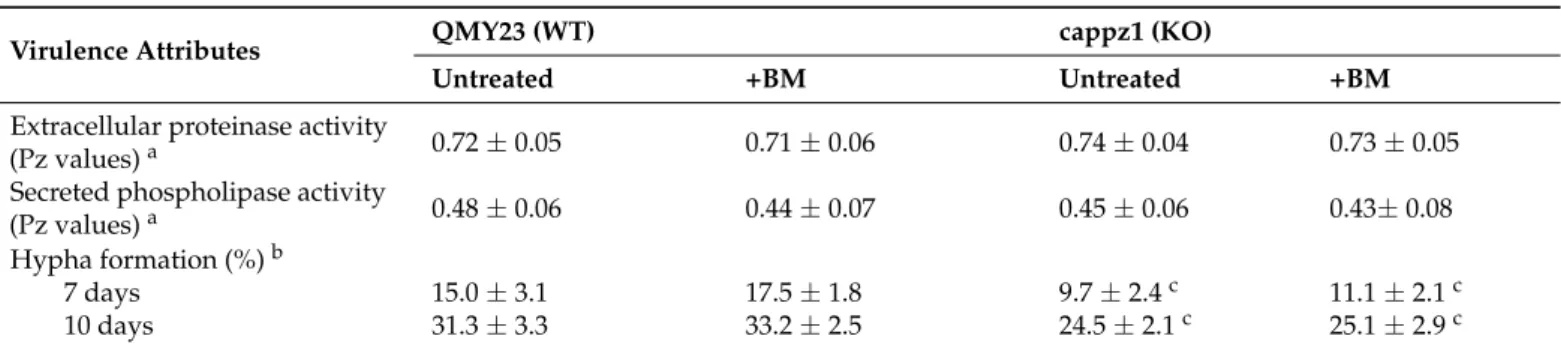
Table 3.Effect of betamethasone (BM) on the virulence attributes ofC. albicans.
Virulence Attributes QMY23 (WT) cappz1 (KO)
Untreated +BM Untreated +BM
Extracellular proteinase activity
(Pz values)a 0.72±0.05 0.71±0.06 0.74±0.04 0.73±0.05
Secreted phospholipase activity
(Pz values)a 0.48±0.06 0.44±0.07 0.45±0.06 0.43±0.08
Hypha formation (%)b
7 days 15.0±3.1 17.5±1.8 9.7±2.4c 11.1±2.1c
10 days 31.3±3.3 33.2±2.5 24.5±2.1c 25.1±2.9c
Mean±SD for three independent experiments is presented. Cells were treated with 2 mM BM for 5 h.aEnzyme activities (Pz values) were determined by dividing the colony diameter and precipitation zones on egg yolk (EY) plates or clear areas on bovine serum albumin (BSA) media-plus-colony diameter after 5 days of incubation at 30◦C.bHyphal growth % was calculated using the following formula: (width of hyphal ring)/(colony diameter + hyphal ring)×100.cSignificant differences (p< 0.05) between KO vs. WT.
3.4.2. BM Pre-Treatment Enhanced the Oxidative Stress and the Stress Response Induced by MSB
The BM, MSB and BM + MSB treated cultures were characterized by changes in the activities of antioxidant enzymes and redox homeostasis (DCF production). The deletion of CaPPZ1facilitated the formation of DCF and increased the specific glutathione reductase and glutathione peroxidase activities in comparison to untreated WT cultures, in line with previous observations [17]. In contrast to BM exposures, MSB treatments led to the development of oxidative imbalance and significantly increased the specific activities of the tested antioxidant enzymes in both WT and KO strains (Table4). It is important to note that combined BM + MSB treatments had significantly stronger effects than MSB exposures alone on DCF production with the WT and KO strains, and on enzyme activities of the KO strain (Table4). Furthermore, significant interaction (p< 0.05) was also observed between BM and MSB as well as MSB andCaPPZ1deletion on the DCF production of both strains, as well as between BM and MSB on the glutathione reductase, glutathione peroxidase and catalase activities of KO cells (Table4).
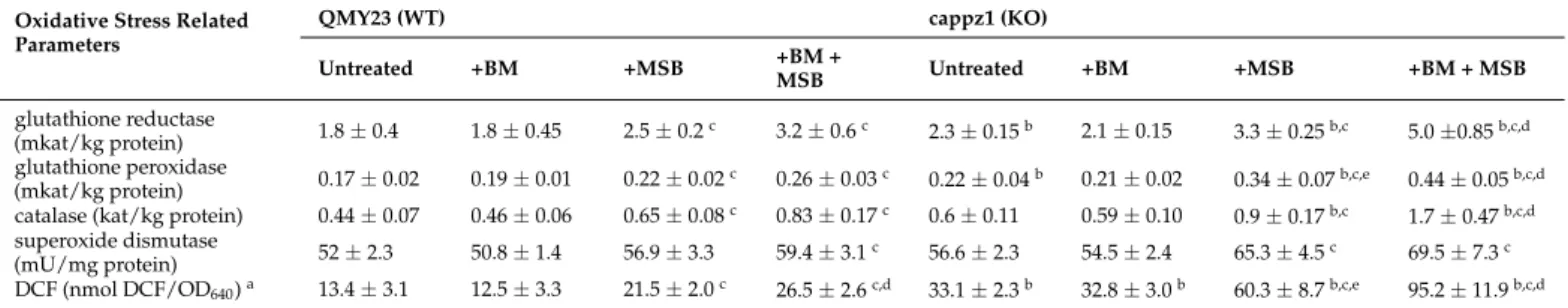
Table 4. Betamethasone (BM) or/and menadione sodium bisulfite (MSB) induced changes in the antioxidant enzyme activities and redox homeostasis ofC. albicans.
Oxidative Stress Related Parameters
QMY23 (WT) cappz1 (KO)
Untreated +BM +MSB +BM +
MSB Untreated +BM +MSB +BM + MSB
glutathione reductase
(mkat/kg protein) 1.8±0.4 1.8±0.45 2.5±0.2c 3.2±0.6c 2.3±0.15b 2.1±0.15 3.3±0.25b,c 5.0±0.85b,c,d glutathione peroxidase
(mkat/kg protein) 0.17±0.02 0.19±0.01 0.22±0.02c 0.26±0.03c 0.22±0.04b 0.21±0.02 0.34±0.07b,c,e 0.44±0.05b,c,d catalase (kat/kg protein) 0.44±0.07 0.46±0.06 0.65±0.08c 0.83±0.17c 0.6±0.11 0.59±0.10 0.9±0.17b,c 1.7±0.47b,c,d superoxide dismutase
(mU/mg protein) 52±2.3 50.8±1.4 56.9±3.3 59.4±3.1c 56.6±2.3 54.5±2.4 65.3±4.5c 69.5±7.3c DCF (nmol DCF/OD640)a 13.4±3.1 12.5±3.3 21.5±2.0c 26.5±2.6c,d 33.1±2.3b 32.8±3.0b 60.3±8.7b,c,e 95.2±11.9b,c,d
Samples were treated as in Figure1. Mean±SD values calculated from three independent experiments are presented.aRedox change was characterized by the 20,70-dichlorofluorescin diacetate (DCF) assay. Increased DCF production is an indicative of the redox imbalance.b Significant difference between untreated KO vs. untreated WT and treated KO vs. treated WT,cSignificant difference between treated WT vs. untreated WT and treated KO vs. untreated KO.dSignificant interaction between the effects of BM and MSB according to two-way ANOVA in the studied strain. eSignificant interaction between the effects of MSB and the deletion ofCaPPZ1according to two-way ANOVA (BM pre-treated cultures were omitted from the calculations).
3.4.3. Deletion of CaPPZ1 and MSB-Induced Oxidative Stress Reduced Glucose Consumption, Ethanol Production and Influenced Metal Ion Content ofC. albicans
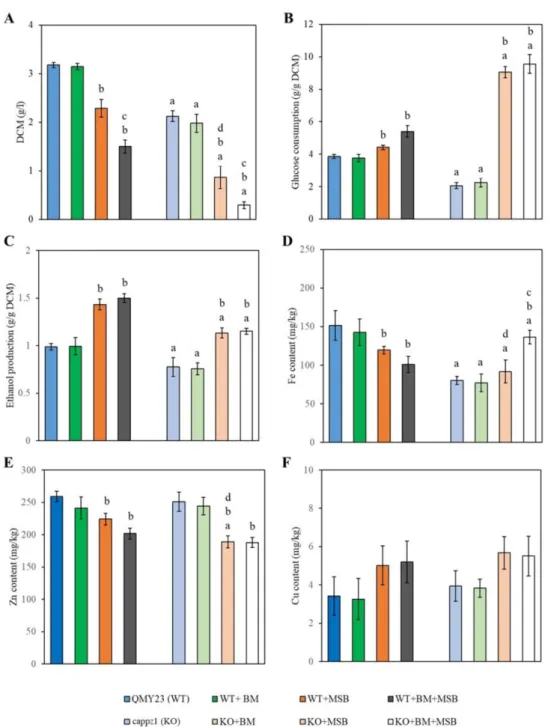
Glucose consumption, ethanol fermentation, as well as intracellular metal contents ofC. albicanswere analyzed after 4 h MSB exposure (Figure4) because neither glucose consumption nor ethanol fermentation changed significantly after 1 h MSB exposure.
It is worth noting that BM alone had no significant effect on either the strains or the physiological parameters tested. Significant decrease was detected in the growth (DCM), ethanol fermentation and the iron content of the untreated and oxidative stress treated KO cells when compared to the appropriate WT cultures (Figure4A,C,D).
MSB treatment decreased the growth and zinc content of the KO strain plus the iron contents of WT cells (Figure4A,D,E). Glucose utilization and ethanol production increased in both MSB-exposed WT and KO strains (Figure4B,C). Combined BM + MSB treatments had a more significant impact on the growth of both strains (Figure4A) and the iron content of the KO cells than MSB exposures alone (Figure4D). The copper content ofC. albicans cells measured in the presence of BM, MSB and BM + MSB did not differ significantly from the untreated control cultures (Figure4F).
4. Discussion
Deeper insight into the physiological and molecular mechanisms of new antifungal candidates may help to develop safe and effective antimycotics to combat infections caused byC. albicans. Use of global transcriptome analysis has provided a platform to compare and functionally characterize the effects ofCaPPZ1gene deletion and concomitant oxidative stress exposure on BM pre-treatedC. albicans. Our previous studies indicated that the BM concentration used in this study (2 mM) was not toxic for oral, intestinal and vaginal epithelial cell lines [9]. In addition, we observed that 2 mM BM pre-treatment of the fungal cells did not significantly impact on either physiology or virulence and had only minor effects on the interaction ofC. albicans with human epithelial cells [8,9]. In accordance with these observations, we did not find any significant differences in the physiological and global transcriptional responses of BM treated versus untreatedC. albicansstrains.
However, BM sensitized the fungal cells’ response to the oxidizing agent MSB as we reported earlier [7,8] and extended in the present work. Here we report that the negative effect of the fungus specific protein phosphataseCaPPZ1deletion on the oxidative stress tolerance ofC. albicansinteracts significantly with BM exposure.
Figure 4.The physiological effects ofC. albicansprotein phosphatase Z1 (CaPPZ1) gene deletion, betamethasone (BM) pre-treatment and/or menadione sodium bisulfite (MSB) on the growth (A), glucose utilization (B), ethanol production (C) and metal content (D–F) of the QMY23 (WT) or cappz1 mutant (KO)C. albicansstrains. Cell cultures were supplemented with 2 mM BM at 0 h incubation time and oxidative stress (+1.5 mM MSB) was initiated at 4 h incubation time. Samples were taken after 4 h of MSB exposure. Data represent mean values±SD calculated from 3 independent experiments. a Significant difference between untreated KO vs. untreated WT and treated KO vs. treated WT.bSignificant difference between treated WT vs. untreated WT and treated KO vs.
untreated KO.cSignificant interaction between the effects of BM and MSB according to two-way ANOVA in the studied strain.dSignificant interaction between the effects of MSB and the deletion of CaPPZ1according to two-way ANOVA (BM pre-treated cultures were omitted from the calculations).
4.1. Phenotypes and Transcriptional Changes Attributed to CaPPZ1 Gene Deletion
The involvement ofCaPPZ1in oxidative stress response has been studied extensively and reported earlier [15,17]. Our study of the transcriptome changes in the KO indicated
indeed some alteration in gene expression related to the oxidative stress response (Ta- ble S3), including flavodoxin-like proteins, superoxide-dismutase andγ-glutamyl cysteine synthase. These proteins confer important antioxidant effects that are critical for fungal virulence and are needed to combat oxidative stress [33,34]. Upregulation of these genes as well as the elevated DCF and antioxidant enzyme activities (Table4), in agreement with Szabóet al. [17], also suggest that the phosphatase deletion and oxidative stress toler- ance were tightly linked inC. albicans, similarly to that found inS. cerevisiae,A. fumigatus andA. nidulans[15,16]. The upregulation of several genes related to “redox processes”
and “response to oxidative stress” upon the overexpression ofPPZ1inS. cerevisiae[35], providing further support for the intimate correlation between oxidative stress and the Ppz enzymes. Moreover, mitochondria are the major site of reactive oxygen species (ROS) production. According to several publications the ROS generation in yeast cells contributes to mitochondrial damage [36–40]. Our data support the assumption that the deletion of CaPPZ1may led to mitochondrial dysfunction.
In addition, two previous studies pointed to the possible role of Ser/Thr phosphatase Z in the iron metabolism of the opportunistic human pathogenic fungiA. fumigatusand C. albicans[17,41]. Furthermore, theA. fumigatus∆ppzAmutant exhibited reduced growth under iron starvation conditions but not under untreated or iron excess conditions. These genes related to reductive iron uptake and siderophore biosynthesis were up-regulated after iron starvation [41,42]. Nevertheless, the loss ofC. albicans CaPPZ1resulted in a significant overall decrease in the iron content of KO cells (Figure4D) and, as a conse- quence,CaPPZ1deletion elevated the expression of several iron homeostasis-related genes (Table2and Table S3). These included essential elements of reductive iron uptake (CFL2, CFL4,CFL5,FRP1,FRE10,FTH1,FET31, andFET99), siderophore transport (SIT1), and hemoglobin utilization (RBT5, andPGA7). We noted thatCaPPZ1deletion did not affect the expression ofSEF1andHAP43(Figure3, Table S3) which are essential for low iron- responsive transcriptional regulation inC. albicans[43]. Consequently, CaPpz1 seems to be a key player in the maintenance of the iron homeostasis ofC. albicans. Although its deletion caused reduced iron accumulation within the fungal cells that led to the general upregulation of the iron acquisition pathways, the target proteins of CaPpz1 modulating the iron metabolism are yet to be elucidated.
The upregulation of several plasma membrane-associated genes in the KO strain is in line with previous publications reporting on the role of Ppz1 phosphatase in transmem- brane transport processes ofC. albicans[17] and in other fungi [44]. This effect becomes apparent when the two strains are compared under stress conditions, i.e., in the presence of MSB, and even more significantly in combined BM plus MSB treatment (Table2).
It is important to note that significant inhibitory effects on the growth and hypha formation ofC. albicans(Figure1and Table3) were also recorded in the KO strain, which was in good accordance with our previous results [14,17,45].
4.2. Transcriptional Changes Related to MSB Exposures
Based on our RNASeq data, MSB stress elicited only a moderate effect on the tran- scriptome of WT cells as the expression of only 64 genes changed significantly (45/19 genes up/down) (Figure2, Table S3). In comparison, the transcriptomic effect of mildtBOOH (0.4 mM) treatment was more pronounced (132/64 genes up/down-regulated more than two-fold), including the upregulation of translation, RNA metabolism, and downregulation of cell surface, oxidoreductase activity associated genes [17]. Chen et al. [46] demonstrated that the transcriptomic response of fission yeast to MSB was also less pronounced than tBOOH or H2O2, as indicated by the five times higher number of differentially expressed genes counted undertBOOH (2 mM) or medium H2O2dose (0.5 mM) stress.
In our study, the differentially expressed genes were mainly involved in the antiox- idative defense of C. albicans(Table2). TheMDR1 gene coding for a multidrug ABC transporter and theCIP1gene encoding an environmental stress induced protein [47] were significantly up-regulated by MSB (Figure3, Table S3) and, most likely, contributed to the
protection ofC. albicanscells against oxidative stress. In addition, our data support the idea that MSB may be a potential substrate for the Mdr1 efflux pump [47,48]. Upregulation of genes encoding antioxidative enzymes is a predictable response to oxidative stress, i.e., increased specific activities of catalase, glutathione peroxidase, and glutathione reductase (Table2, Table4and Table S3) in agreement with previous publications [17,19,49–51].
In addition, our data demonstrated that MSB stress also affected the transcription of iron homeostasis-related genes (Figure3and Table2), as well as the iron and zinc content of the WT strain (Figure4). The downregulation of iron uptake genes was likely associated with the significantly decreased iron contents measured in MSB-exposed cells. Importantly, this response may constitute part of the protective oxidative stress response that minimized the oxidative damage caused by the ferrous ions. It is well-known that elevated free intracellular iron levels facilitate the formation of ROS and mediate iron-dependent cell death in baker’s yeast [52]. Meanwhile, the down-regulated expression ofCSR1, encoding a major transcription factor that stabilizes zinc homeostasis and provides cells with zinc- dependent protection against oxidative stress [23], is probably consistent with the observed decreased intracellular zinc levels (Figures3and4).
4.3. Combined Effects of CaPPZ1 Deletion and MSB Treatment
As expected, the KO strain showed elevated oxidative stress sensitivity in flask cul- tures in the presence of MSB in comparison to the genetically matched QMY23 WT strain (Figure1and Table4).
TheCaPPZ1deletion significantly enhanced the number of up-regulated oxidative stress response genes (Tables2, S2 and S3), which correlated with increased antioxidant en- zyme activities (Table4) [17]. The KO + MSB vs. WT + MSB comparison also demonstrated thatCaPPZ1deletion up-regulated the transmembrane transport genes and decreased the expression of several ergosterol metabolism related genes under MSB exposure (Table2).
The general downregulation of RNA metabolism and/or ribosome biogenesis is a common element of the oxidative stress responses of various fungi [19,49,50,53] that is readily detectable in the more sensitive mutant background (Table2and Table S2) in agreement with Szabóet al. [17]. MSB-exposed cells can save energy and nutrients through the downregulation of these processes that prevent or ameliorate oxidative injury of macromolecules inC. albicanscells [54].
It is noteworthy thatCAP1coding for one of the major regulators in oxidative stress de- fense, as well asATM1,YCF1/MLT1,SNQ2ABC transporters,MRD1multidrug efflux pump andPDR16phosphatidylinositol transfer protein [51,55], were induced after exposing the KO strain to MSB (Figure3, Table S3). The ABC transporters and their transcriptional regu- lators are known to be essential for adaptation to environmental changes [55]. TheSNQ2 andYCF1transporter genes are among the primary targets of the Yap1 homolog Cap1 bZIP- type transcription factor and are rapidly expressed in response to oxidative stress [55]. Ycf1 is a vacuolar ABC transporter, which probably transports glutathione S-conjugates into the vacuoles [55,56]. Moreover, the phosphatidylinositol transfer protein Pdr16, may provideC.
albicanscells with protection against MSB via sensing of stress-dependent changes in sterol biosynthesis and membrane lipid composition, and modulating the activity of enzymes involved in ergosterol biosynthesis [57].
Oxidative stress also caused profound alterations in the primary metabolism of the KO strain (Table2and Table S3). For instance, the transcription of several genes related to glycolysis, glycogen and amino acid metabolism was up-regulated (Tables2, S2 and S3).
Such metabolic pathways are known to contribute to the stress defense ofC. albicans[58,59].
Moreover, upregulation of peroxisome-related process was also observed under MSB stress (Table2and Table S2), as shown before fortBOOH treatments [17]. This was indica- tive of the progressive degradation of damaged, oxidative stress sensitive unsaturated fatty acids [51,56].
MSB exposure influenced the regulatory pattern of several genes related to copper and zinc metabolisms (Figure3, Table S3) and affected the metal content of KO cells (Figure