G lob al and G eopolitical Environm ental C h allen ges
JÁ N O S R A K O N CZA I
Global and Geopolitical Environmental
Challenges
f
\ graphia
■ h b I ■ política oeconoi
Corvinus Geographia, Geopolítica, Geoeconomia
Institute of Geography, Geoeconom y and Sustainable Development Book Series
Series editors: László Jeney - Márton Péti - Géza Salamln
János Rakonczai
Global and Geopolitical Environmental
Challenges
Corvinus University of Budapest
Budapest, 2018
Authors of Chapter 12:
János Rakonczai - Viktoria Blanka - Zsuzsanna Ladányi Authors of Chapter 14:
János Rakonczai - Márton Péti - Géza Salamin Professional proofreader: Attila Kerényi
Translated by:
Edit Balog (Chapters 1-3,14-19) András Petz (Chapter 4)
Viktoria Blanka and Zsuzsanna Ladányi (Chapters 5-13) English language proofreader: Simon Milton
Figures and Technical Editing:
Viktoria Blanka and Zsuzsanna Ladányi Photos:
János Rakonczai
ISSN 2560-1784 ISBN 978-963-503-740-7 ISBN 978-963-503-745-2 (e-book)
This book was published according to a cooperation agreement between Corvlnus University of Budapest and The Magyar Nemzetl Bank.
Publisher: Corvlnus University of Budapest
Cover design and printed: Komáromi Printing and Publishing LTD Leader In charge: Ferenc János Kovács executive director
Contents
FOREWORD...9
INTRODUCTION... 13
I. FACTS AND THOUGHTS ABOUT GLOBALISATION...17
1. The process of globalisation... 19
2. Globalised world economy... 27
3. Recognizing global problems and the world models... 36
II. OUR GLOBAL ENVIRONMENTAL PROBLEMS... 43
4. Overpopulation and other issues related to population... 45
4.1. Population growth... 45
4.2. Demographic division of the world... 54
4.3. Urban and metropolitan grow th... 56
4.4. Growing Income equality between people...60
4.5. Infectious diseases, epidemics...63
4.6. International migration... 65
5. Global climate change and environmental atmospheric problems...72
5.1. The composition and temporal changes In the atmosphere...73
5.2. The background to global climate change...74
5.2.1. The greenhouse effect...74
5.2.2. Past climate change on Earth... 79
5.2.3. The process, background and major consequences of current climate change...81
Greenhouse gasses... 82
Global warming and Its consequences...84
Seawater acidification... 91
El Nino... 92
The Great Ocean Conveyor Belt... 93
Changing precipitation conditions... 96
Expansion of deserts... 97
The role of volcanlsm In climate change...99
5.2.4. Who or what Is responsible?... 99
5.3. The ozone problem... 106
5.3.1. The background to the changes In ozone concentration... 106
5.3.2. Ozone hole...I l l 5.3.3. Who Is responsible for ozone-layer depletion?... 117
5.4. Acid rain... 121
5.5. Air pollution...127
5.5.1. Air pollution of natural origin... 127
5.5.2. Some health consequences of anthropogenic air pollution .... 128
5.5.3. Indoor air pollution... 131
6. Global water problems... 132
6.1. Problems with freshwater...134
6.1.1. Resources and use... 134
6.1.2. Dying big lakes, suffering huge rivers...143
The Aral Sea...144
Lake Chad...148
Lake Urmia...153
Poyang Lake...157
The Yellow River (Huang He)...159
The Colorado River... 160
N ile... 162
6.1.3. Reservoirs and big dams...163
6.1.4. Water pollution as a limiting factor for water use...164
6.1.5. Signs of a water crisis...168
6.1.6. Challenges of seashores and islands... 171
6.1.7. Flood risk...174
6.1.8. Water conflicts and 'water w ars'... 175
6.2. Environmental problems with the world's seas... 178
6.2.1. Overfishing... 178
6.2.2. Pollution of the world's seas... 183
7. Deforestation: a global problem...189
8. The waste problem...198
9. Limits on non-renewable natural resources...205
9.1. Oil and the Hubbert curve...205
9.2. Rare-earth metals (REM )...214
9.3. Sand resources... 216
9.4. How long will there be enough raw materials?... 218
9.5. The environmental consequences of raw material production... 219
10. Utilization and consequences of nuclear energy...220
10.1. Civil utilization of nuclear power... 220
10.2. Nuclear accidents... 223
10.3. Non-civilian use and its consequences... 229
11. Soil: a conditionally renewable natural resource...230
12. Biodiversity... 238
12.1. Decreasing biodiversity... 239
12.2. The central role of humanity in biodiversity change...242
13. The ecological footprint: an indicator of environmental responsibility 244 III. THE HUMAN RESPONSE TO ENVIRONMENTAL CHALLENGES... 255
14. Environmental protection as a new factor... 257
15. What can science do?... 260
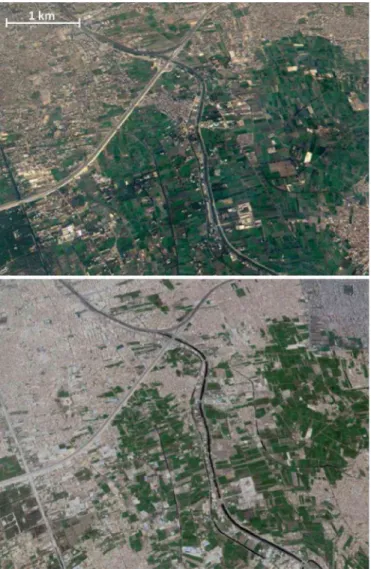
Fig. 11.5. Croplands turning into residential areas in Giza (November 2010-A p ril 2018) (Source: Google Earth)
12. Biodiversity
Life on Earth has changed continuously throughout history. For a long time, changes were controlled by natural conditions and the ability of life to adapt to varying circumstances. As mentioned earlier, the change in the composition of the atmosphere (e.g. ozone layer formation, In the conditions of which flora played a major role) allowed living beings to expand their habitat to terrestrial
areas. Changes in environmental conditions caused major extinction periods that even happened almost instantly. The most well-known example of this was when a meteorite hit the Yucatan Peninsula 65.5 million years ago, which is linked to the extinction of the dinosaurs.202 As far as Is currently known, the most catastrophic extinction period was at the end of the Permian (about 252 million years ago), when up to 96% of marine organisms and around 70% of all the Earth's wildlife died.
After such a period, significant alterations in wildlife are characteristic and previously insignificant species can become dominant. During a slower change, a significant part of all wildlife can adapt to changes in circumstances and, for example, can find more suitable areas for living. Vegetation adapted to temperature changes between the glacial and inter-glacial periods by spatial shifts in vegetation zones. Similar effects due to global warming can also be experienced nowadays.203
Humanity has become a new factor In the alteration of the natural environment on Earth - numerous examples of this can be found In earlier chapters of this book. Its role In the changes Is, of course, less dramatic than that of the meteorite mentioned above, but In terms of efficiency and speed - concerning wildlife - It Is greater than that of glacial climate change.
12.1. Decreasing biodiversity
Humanity engages In several activities that Impact living organisms.
a) Direct loss of wildlife. The related activity Is quite variable: e.g. fishing, hunting, and deforestation. The purpose Is food production (from simple foods to luxury ones, like shark fins, caviar or swallows' nests), obtaining raw materials, pursuing hobbies (hunting trophies, souvenirs) or for supposed physiological effects (e.g. the potency Increasing Impact of rhino horn).
b) Habitat loss. The biggest changes are due to changes In land cover: steppe or forest conversion to cropland, overgrazing of meadows, and built-up areas (settlements, roads).
c) Habitat fragmentation. As human Infrastructure divides landscapes, the adaptation of wildlife to changing circumstances decreases, and the niche of some animal populations is reduced. Consequently, there is growing conflict between people and animals (e.g. the elephant in Africa and Asia, and the brown bear In Europe).
202 From time to time it is claimed that this extinction process started three hundred thousand years before this date.
203 Research by the author of this volume discusses such changes. Available at:
https://www.intechopen.com/books/climate-change-geophvsical-foundations-and- ecological-effects/effects-and-consequences-of-global-climate-change-in-the- carpathian-basin
d) Pollution. The most spectacular examples of pollution involve the worldwide appearance of waste that causes many animal deaths, the effects of oil spills on marine life, or wildlife degradation resulting from polluted rivers. But animal poisoning (even unintended) or the degradation of vegetation or soil life is also frequent. The serious phenomenon of forest degradation due to the acidic deposition of air pollutants was mentioned earlier.
e) Spread o f invasive species (often introduced by humans) that displace native species. Examples include the dingo in Australia, the cat in New Zealand, a snake species in Guam Island, rats in many places, and, among plants, the ragweed that causes allergies, etc.
f) Climate change as an indirect impact of anthropogenic activities. The high rate of coral reef die off due to temperature increases was described earlier, but the climatic zones in which numerous organisms live also change as a result of modifications in the climate.
The World Wildlife Fund (WWF), founded in 1961, has been monitoring the wildlife on Earth for a long time and publishing details about this in special volume (the Living Planet Report) every two years since 198204. The assessment is based on more than fourteen thousand monitored populations of 3,706 vertebrate species. The applied Living Planet Index uses current monitoring data to compare changes with the state in 1970. The combined impact is saddening:
58% of vertebrate populations declined between 1970 and 2012. The role of humanity in the changes is indisputable.
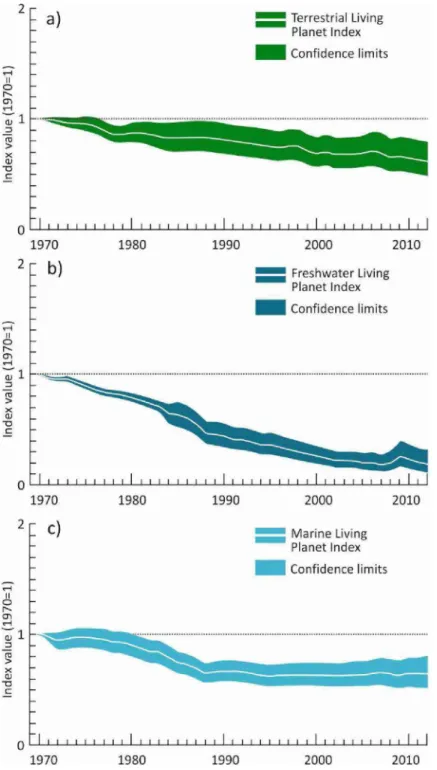
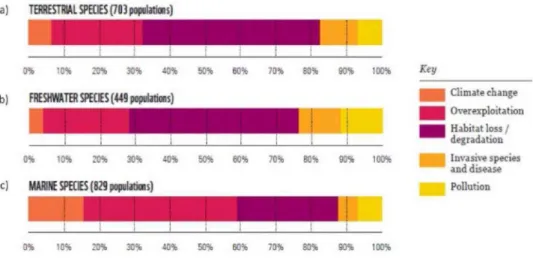
In the case of terrestrial species, the rate of decrease (based on a study that assessed 4658 populations of 1678 species) is 38%. The major cause of change is habitat degradation and overuse (Fig. 12.1a and Fig. 12.2a)204 205.Freshwater habitats are in worst condition, since the rate of decline (881 species, 3324 populations) is 81%. The main reasons here are also similar, but water pollution is evaluated as responsible for 12% of this decline (Fig. 12.1b and Fig. 12.2b).
The degradation of marine habitats is similar to that of terrestrial ones (1353 species, 6170 populations); the rate of decline is 36%, but the trend in the changes is different. While there has been a persistent downward trend in other habitat types, here the decline (in line with sea fishing) was rapid until the early 1990s, and thereafter remained substantially at the same level. The main reasons for this are habitat degradation and overuse, but this form of habitat is also the most sensitive to the impacts of climate change (Fig. 12.1c and 12.2c).
Coral destruction also affects the surrounding rich wildlife.
204 The reports are available at:
http://wwf.panda.org/knowledge hub/all publications/living planet report timeline/
205 For each habitat type, a more detailed evaluation Is available In the report.
Index value (1970=1) Index value (1970=1) index value (1970=1)
1970 1980 1990 2000 2010
Fig. 12.1. Living Planet Index between 1970 and 2012 for terrestrial (a), freshwater (b) and marine (c) populations (Source: based on WWF 2016).
As far as the geographical distribution of the changes is concerned/06 it can be concluded that the worst situation is experienced in the Indo-Pacific region (a 64% decrease) and the Neotropical region (50% decrease), including South America and its marine environment. The most favourable situation is in the Palearctic region (6% increase) including the northern parts of Europe, Asia and Africa, and furthermore in the Nearctic region (6% decrease) including North America. These big differences are due to two factors. One is the starting date of the assessment. In areas currently in a more favourable situation, intensive land-use changes occurred earlier (for example, if calculations were made using a period 300-400 years earlier, significant declines would also be obvious);
furthermore, nature protection efforts started earlier and have been more effective. The other reason is that the most sensitive coral areas with their rich wildlife are found in the Indo-Pacific region, and the tropical forests with their rich wildlife in the South American region. Beside these areas, there is hardly any adequate habitat for natural wildlife in the densely populated areas of Asia, which Is generally environmentally degraded.
a) TERRESTRIAL SPECIES (703 papuiations)
j_______ i_______ |_______ L
0% 10% 20% 30% 40% 50% 60% 70% B0% 90% 100%
b) FRESHWATER SPECIES (449 populations)
0% 10% 20% 30% 40% 50% 60% 70% 80% 90% 100%
c) MARINE SPECIES (829 populations)
0% 10% 20% 30% 40% 50% 60% 70% 80% 90% 100%
Fig. 12.2. Major reasons for changes In wildlife between 1970 and 2012 for terrestrial (a), freshwater (b) and marine (c) species (Source: based on WWF 2016).
12.2. The central role of humanity in biodiversity change
It might be assumed that humanity has realized Its Important role In preserving biodiversity for the sake of Its own future. The Increase In the number of national parks that were established following the last quarter of the nineteenth 206 206 A figure illustrating this spatial distribution Is available on Pages 34-35 of the 2012 Living Planet Report:
http://d2ouw59p0dg6k.cloudfront.net/downloads/lpr living planet report 2012.pdf
century/ the list of threatened species (the Red List), and the armed pushback against poachers may soothe some consciences. But extinctions are ongoing:
elephants and rhinos are still killed for their tusks and horns (although this is forbidden and punishable) because of market demand. Whales are killed for 'scientific research' (often circumventing agreements and international conventions). Chemicals and plastics are released into waters in such large quantities that they endanger marine life. Moreover, areas with rich wildlife are popular recreational sites. I will never forget my trip to the Amazonian forests, or the howler 'concert1 among the pyramids of Tlcal In Guatemala.
Maybe humanity does not even recognize the trouble It Is In. The problem is not really perceptible when food is available on a daily basis (for ninety percent of humanity), mobile phone signals and Internet are accessible, smartphones are In use all day, the number of cars Is growing (along with traffic jams), and the Olympic Games and the Football World Cup can be watched in any part of the world. Humanity's significant dominance over biodiversity was highlighted In a book by Hararl, published In 2015.207
Based on the previous chapter it can be concluded that we have exact knowledge about the number of wild vertebrates based on numerous pieces of research. This allows us to make a simple estimation: the mass of wild animals (larger than a few kilograms) Is approximately one hundred million tons. The 7.6 billion people on Earth weigh approx. 300 million tons, and the weight of the livestock consumed In 2018 was 350 million tons, but not all of them are a part of our menu. The global cattle population is around one billion in 2018 (with an average weight of at least 300 kg), meaning an additional 300 million tons, of which 70 million tons are consumed. Thus, the total weight of livestock can be estimated at around 700 million tons. As a result, at present, the cumulative weight of human beings and their livestock Is ten times greater than that of larger wild animals.
If we go back a half century, the weight of wild animals in 1960 was at least double the weight (minimum 200 million tons) than it is nowadays, and human consumption per person was also half that of present days (1960: 23 kg, 2018:46 kg), thus, the three billion people on Earth at that time weighed one hundred and twenty million tons and meat consumption was approx, seventy million tons.
However, the total weight of living livestock was hardly less than nowadays. For example, the number of cattle was only fifty million less compared to the nine hundred and fifty million nowadays, and there were more working stock. Thus, the weight of living livestock was also similar to nowadays (350 million tons). At that time, the cumulative weight of human beings and their livestock was only 2.7 times that of wild animals. If we go back five thousand years (BC 3000), the human 207 Y. N. Hararal: Homo Deus: A Brief History of Tomorrow. 2015.
population can be estimated at forty-five million, and these individuals did not even have livestock, while the number of wild animals was several times higher (let us calculate using double the amount of the 1960s), while meat was mostly obtained from hunting. When considering the above-mentioned fact and the knowledge that the weight of livestock is probably overestimated as twice that of humanity, the weight of people and wild animals may be calculated as 5.5 million tons and four hundred million tons, respectively, suggesting that at least seventy times more wildlife existed than humans in terms of weight. Predictions suggest that in twenty years nine billion people will exist, the livestock of which will weigh 1.2 billion tons, while eighty million tons of wild animals will remain, equivalent to one-fifteenth the amount of livestock. These stark numbers clearly indicate how humanity is using wildlife and putting pressure on it. It is difficult to think about where this process will lead. It may seem pessimistic, but the process has similarities to the spread of cancer in the human body. I leave the Respected Reader to think over these facts further.
Humanity, however, not only has an impact on wildlife via its sheer mass, but uses the results of scientific research (biotechnology) to genetically modify it. Genetically modified organisms (GMO) may offer many advantages, but at the same time they can pose many risks. Through using GMO technology, for example, crop yields can be increased and medicine can be made more effective, but the longer-term health risks are not known. This uncertainty has led to several countries banning its use.
Another type of duality characterizes the role of humanity in terms of biodiversity: while, for example, monocultural farming in large areas reduces biodiversity, humanity is now operating gene banks to preserve the genetic diversity of wildlife.
13. The ecological footprint: an indicator of environmental responsibility
Decades after the perception of increasing environmental issues, assessments generally came to the conclusion that there were serious problems in several areas, as presented in the previous chapters, and that something should be done; furthermore, that richer countries are mostly likely to be responsible for such problems due to their over-consumption. Moreover, a novel environmental ideology, the concept of sustainable development, was born in the mid-1980s which was attractive to almost everyone and diverted attention from more problems.
In 1995, however, a book was published In Canada208 that fundamentally changed the 'blurry7 environmental ideology of sustainable development. The new concept that was Introduced, the ecological footprint, provides an opportunity to define everyone's responsibility as regards the current state of the environment - Including countries, continents, and even Individuals. But what Is this new concept? The ecological footprint defines the area required to produce the goods necessary to support an individual's life without harmful consequences (i.e., in a sustainable manner!). It thus quantifies the impact of our lifestyle on the environment. In the definition emphasis Is paid to considerations of sustainability.
Thus, the footprint does not simply refer to how much space Is needed to support human lifestyles because that would also mean that, after the depletion, exploitation and contamination of an area (i.e. when resources are exhausted and an area becomes useless to us), we could move away. The method attempts to compare apples with oranges by converting human effects to territorial units using a specific logic. In the next step, it compares the land that is required with the resources that are available (firstly on a continent- or country basis).
According to the original definition, the ecological footprint of each individual is composed of six elements:
• the area required to grow the plants required for their food supply,
• the grazing land required to produce the meat they consume,
• the forest area sufficient to provide for their wood and paper consumption,
• the sea (more generally: water surface) necessary to support their consumption offish,
• land required for housing,
• the area of forest required to sequestrate the amount of carbon dioxide that is proportional to the individual's energy consumption.
The calculation method was later extended with additional elements. The most important new element is that, in parallel with the ecological footprint, the water footprint has also been determined209 - thereby recognizing the problem of fresh water shortage. (There have also been attempts to determine the nuclear footprint - using a highly debatable method - , but this was later rejected.)
The unit of measurement of the ecological footprint is a global hectare, which takes into account real natural conditions, thus is spatially differentiated.
This means, for example, that in an area with unfavourable conditions for life (e.g. an arid area) more land is necessary to supply a person with grain than on 208 Wackernagel - Rees 1995: Our Ecological Footprint: Reducing Human Impact on the Earth. Its awareness-raising effect Is shown by the fact that the method of measurement is now associated with a worldwide network.
209 WWF: Living planet report 2008 - Available at:
http://d2ouw59pQdg6k.cloudfront.net/downloads/lpr living planet report 2008.pdf
a Chernozem soil with high fertility. The calculation, therefore, evaluates not only the real consumption of individuals but also the natural background to this, or the biocapacity of the landscape.
One Important element of the evaluation Is how It takes Into account not only what It Is taken from the environment, but also what resources are available. If the whole world were Incorporated Into the assessment, the biocapacity indicator could give very unjust results as it would basically determine how successful (and maybe violent) descendants were In obtaining control over the territory of a country. Of course, there are some lucky turns here too: many of the big oil-producing countries are located In bare, desert areas that almost no one would have selected to live in one hundred years ago, while today many people are envious of them because of their riches.
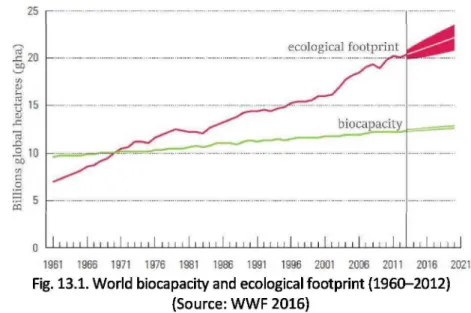
In the Living Planet Reports,210 detailed (even country-level) assessments about ecological footprint have been published since 2000. The following evaluation was made based on these. The time-series analysis shows that both biocapacity and the world's ecological footprint have increased globally over the past half century (Fig. 13.1). Concerning biocapacity, a more efficient agriculture (production and biotechnology) has had a much more favourable impact on changes than the negative impact of deforestation. The ecological footprint, however, grew much faster (about threefold) during the last half century as a result of significant population growth and a rise in individual-level consumption.
25
Q I I I I I ) I I I I 1 I I I I I I I i I I I I i I I I I I I I I I I I I I I I I 1 I I I I I I i l I I I I I I I 1I I I I I
1961 ¡966 1971 1976 1981 1986 1991 1996 2001 2D06 2011 2016 2021
Fig. 13.1. World biocapacity and ecological footprint (1960-2012) (Source: WWF 2016)
210 As previously mentioned, they are available at:
http://wwf.panda.org/knowledge hub/all publications/living planet report timeline but Information can be obtained directly from: https://www.footprintnetwork.org/
Before a more detailed assessment, it must be noted that, like all complex methods that try to compare apples with oranges, the ecological footprint may contain several measurement and evaluation errors. When calculating the ecological footprint, many important elements cannot be taken into account. Of these, for example, attempts have been made to integrate water use and nuclear energy, but they could not be properly integrated logically. But the lack of a waste indicator, or one for the consequences of environmental pollution, is also problematic. All these items could be taken into account in the calculation of biocapacity, and it would be reasonable to analyse their roles, but they do not fit the principles of the earlier calculations either. Furthermore, there is a lack of detailed enough data, which makes the accuracy of the determination of individual responsibility highly doubtful. As will be seen, however, the method is suitable for the temporal monitoring of environmental use and also for comparing the opportunities and use of resources in the related countries.
If changes per capita are assessed, a misleading picture may be obtained.
The figures show that the global ecological footprint per person has not grown since the mid-1970s, but has even moderately declined. This is, however, not due to our increasing environmental awareness, but the fact that the footprints of the countries with a lower level of economic development are about a quarter of those for developed ones (Fig. 13.2), and - as was seen in Chapter 4.2 - it is in these countries that there is much greater population growth. Until the beginning of the 1960s, almost the same number of people lived in the developed and underdeveloped countries, but nowadays the population of the latter is at least three times that of the former. Therefore, over-consumption in developed countries is being compensated for by the higher population of underdeveloped ones. Absolute growth in impact is clearly shown in the previous Figure 13.1, which also indicates that half a century ago Earth's resources were enough to meet human needs, while nowadays at least one-and-a-half Earths are necessary.
This means that resources generated over a long period of time are being consumed continuously.211 It can be seen that, since the beginning of the 1970s, ecological footprint per person has been larger than available biocapacity (Fig.
13.3). Nowadays, biocapacity per person is 1.8 global hectares, while the ecological footprint is around 2.7-2.8 global hectares. As world biocapacity can only be increased at a slower rate, it will be possible to reduce our 'overuse' to a sustainable level even assuming immediate intervention only by the middle of the century. It is also obvious that overexploitation is in the range of 5-6 global hectares in developed countries. The overall picture is even more complicated if territorial data are taken into account.
211 In the calculations, biologically productive areas are estimated at 11.3 billion hectares.
development of countries (1961-2010) (Source: WWF 2012)
Fig. 13.3. Biocapacity per person and ecological footprint per person (1961-2010) (Source: WWF 2014)
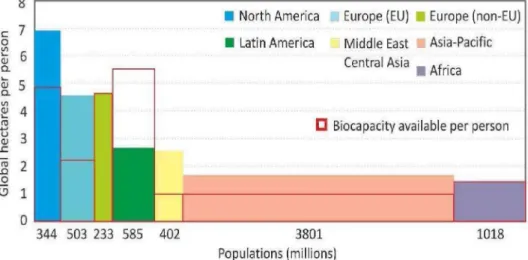
If resources and environmental loads are assessed according to continents, huge differences can be observed (Fig. 13.4).212 Only in Latin America is there less environmental load than biocapacity. Due to natural conditions, it is not 212 In the figure, column width Is proportional to population, while height Is proportional to ecological footprint and biological capacity per person. Thus, the size of the rectangles shows the total biocapacity of the continents (dashed lines) and the total ecological footprint of the population.
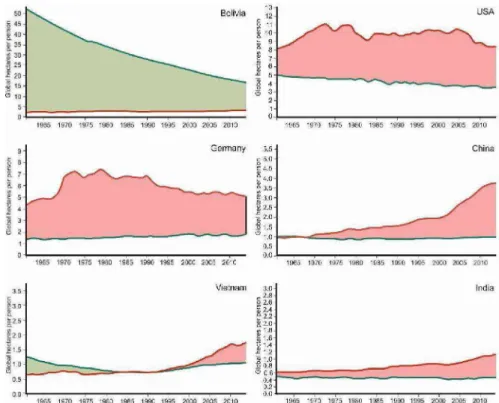
necessary to have a great ecological footprint to overuse the environment, as the example of Asia shows. There are even more prominent differences at the country level. According to data from 2014, for example, the ecological footprints of India and Zimbabwe are 1.1 global hectares/per person, which is more than twice the available biocapacity (0.5 gh/person). In the detailed analysis it is a sad fact that the long-term changes in all countries are unfavourable: countries with high levels of biocapacity use their resources at a high rate, and the (often increasing) ecological footprints are higher in the majority of these countries (Fig. 13.5).
344 503 233 585 402 3801 1018
Populations (millions)
Fig. 13.4. Biocapacity and ecological footprint according to continents in 2010 (Source: EEA213)
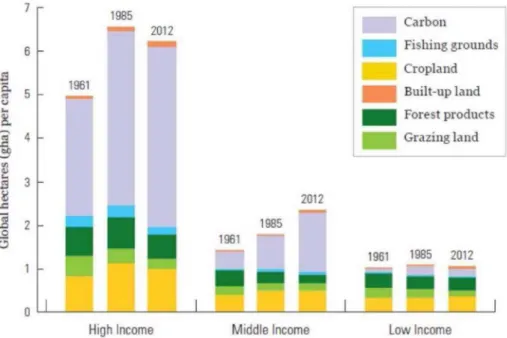
Assessment of the changes in the components of the ecological footprint shows that the carbon footprint is the most significant, and this has also changed most in past decades. This is clearly linked to the enormous use of fossil fuels.
Due to humanity's food supply, the second most important element is cropland.
Over half a century both components have multiplied in size (Fig. 13.6). It is clear from the figure that if humanity were able to reduce carbon emissions (or reduce their atmospheric concentrations), there would be a chance to harmonize biocapacity and ecological footprint. In this, developed countries could do most. In terms of the components of the ecological footprint according to economic development (Fig. 13.7), the carbon footprint is about two-thirds of the ecological footprint in developed countries, although it is also spectacularly increasing in the case of middle-income countries. 213
213 https://www.eea.europa.eu/data-and-maps/indicators/ecological-footprint-of- eu ropea n-cou ntries/ecoloeica l-footpri nt-of-eu ropean-cou ntries-2
Fig. 13.5. Some patterns characteristic of the relationship between biocapacity and ecological footprint (1961-2014) (Source: Footprintnetwork214)
Fig. 13.6. Changes in the elements of the global ecological footprint (1961-2012) (Source: WWF 2016)
214 An interactive map showing detailed data about the world's countries Is available at: http://data.footprintnetwork.Org/#/
Fig. 13.7. Changes in the elements of the global ecological footprint according to the economic development of countries (1961-1985-2012)
(Source: WWF 2016)
As can be seen, the ecological footprint is a complex indicator that creates an opportunity based on environmental data to measure and compare the level of consumption of individuals215 and countries, and also the resources available to them. The size of the footprint (i.e. consumption) in developed countries is considerably more than the resources that are available in these countries, or they have greater emissions. The fact that the footprint can be determined for Individuals may also Increase their sense of responsibility. The greatest significance of the Indicator Is that (despite Its many Inaccuracies) It confronts us with Information about the limited resources on Earth and our ever-growing needs. The combined needs assessment Integrated Into this complex Indicator reflects the fact that sustainable development as a global environmental ideology is a realistic possibility neither at a global level nor at the level o f most individual countries. It also shows us that while humanity began to be familiar with the Idea of sustainable development at the end of the 1980s, It has already exceeded the limit of sustainability because of rapid population growth (according to Wackernagel's calculations).
215 You will find a calculator for individuals here, for example:
http://footprint.wwf.org.uk/
The 'water footprint' created in 2002 had a much smaller effect. It is undoubtedly important to visualise the water supply of countries, but based on this their situation cannot be judged correctly. From the Individual consumption point of view, It Is Important to know the economic importance of water. In terms of individual water consumption, the amount of water Individuals consume per day Is Imagined (e.g., for drinking, bathing, toilet use, washing, etc.), but few people think about food. However, the production of 1 kg of chicken requires one quarter the water (3900 liters) as that of beef (15500 liters);2161500 liters of water is required to produce 1 kg of cane sugar, and 2900 liters of water Is used to produce enough cotton for a T-shirt. Just the water used for this T-shirt would be enough to supply a person with drinking water for 2-3 years. According to a cumulative index, supplying an average person with animal products requires 1150 liters of water a day.
Overall, the accuracy of the ecological footprint can be debated, but its basic idea is sound. Only facts can convince both decision-makers and individuals to act and live according to a different approach, in my opinion, it is less important if the ecological footprint of an individual is six or eight global hectares. However, If It can be shown that the footprint has Increased, for example, by three times In twenty years using the same calculation method, the goal has been achieved. This means that it will be seen that a very bad situation is approaching, and the question is when it will be reached. A responsible decision-maker can not say in such a situation that I will survive but our children should live or die in poor conditions.
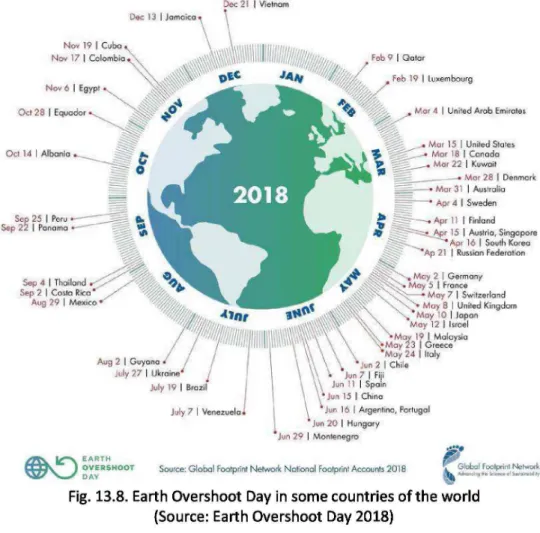
Based on the ecological footprint elements, another metric, Earth Overshoot Day, was Introduced to demonstrate environmental responsibility.
This shows in how many days annual biocapacity (renewable natural resources) on Earth Is used up. According to the latest calculations,217 this day Is 1 August In 2018, which means symbolically that In the first seven months of the year the world's renewable resources for the year are depleted. If country-level data are compared this way (Fig. 13.8), It can be seen how quickly each country reduces Its renewable resources. Thus, It shows the responsibility of countries whose
216 More information about the water footprint of foods is available at:
http://www.fao.Org/resources/infographics/infographics-details/en/c/218877/
217 https://www.overshootdav.org/newsroom/past-earth-overshoot-davs/
Note that the yearly dates on the website have already been revised. Thus, anyone tracking the changes every year would experience significant modifications. For example. In the year of the economic crisis (2008), September 24 was originally defined as overshoot day, but the later-modified date was 15 August. (This is the reason for the differences between the findings of the internet search engine from 2008 and the present website.)
biocapacity is even greater than ecological footprint (e.g. Canada, Brazil, or Peru). In particular, the data of the former two countries are unfavourable:
Canada and Brazil have renewable biocapacity of less than 2.5 and 6 months, respectively. Unfortunately, almost every country could be located on the overshoot figure (not only the nearly fifty that are illustrated), as the over-use of the environment is typical worldwide.
Fig. 13.8. Earth Overshoot Day in some countries of the world (Source: Earth Overshoot Day 2018)