Zsófia Vetőné Mózner
Analysing the environmental impact
of international trade using the Carbon Footprint indicator
I. Introduction
There is essentially a consensus that anthropogenic carbon emissions con- tribute to climate change (IPCC, 2007). The indicator of the carbon footprint, which is a well-known and accepted indicator of sustainability, can be a useful indicator to analyze the environmental impacts of emissions, and it can even be useful for political decision-making.
There is a growing trend that the countries of the world become more and more dependant on each other in economic terms in the process of globaliza- tion, and they are part of the international trading system. Because of this, the production and consumption of goods and services and their environmental impact have become fairly separated from each other in space as well, and this way, the impact on the biosphere increases (Boda-Pataki, 1995). Due to interna- tional trade, nowadays it has become possible for countries to import biocapac- ity and become dependant on other countries’ ecological stock.
It is highly essential to investigate what are the impacts of this phenomenon on the natural stock and sustainability of a country and to move forward an ap- proach where consumer responsibility is dominant.
This paper quantifies Hungarian households’ carbon footprints from a con- sumption perspective, calculating and examining the environmental pressures associated with imports and domestic consumption. The aim is to examine the role of international trade, how the delocalization of production affects the structure of the carbon footprint.
2. Theoretical background
In this section a brief overview is given about the carbon footprint and its origin, followed by a literature review on the relevant studies.
Originally, the carbon footprint was one component of the full ecological footprint analysis, but it can be calculated and discussed separately as well, and because of climate change it has risen to prominence in a very notable way.
The ecological footprint is an indicator, introduced and developed by Wack- ernagel and Rees (1996). It is defined as the corresponding area of productive land and aquatic ecosystems required to produce the resource used, and to as- similate the waste produced, by a defined population at a specified material standard of living, wherever on Earth that land may be located (Rees, 1996).
The ecological footprint can be compared to its biocapacity on an aggregate basis and if the ecological footprint exceeds its biocapacity then there will be an ecological deficit.1
During the calculation of the carbon footprint, the CO2 emission data are translated into the area, measured in global hectares, which account for absorb- ing the carbon emissions. The carbon footprint is the area of annual forestry required to sequester the CO2 emissions (Monfreda, 2004).
The significance of the carbon footprint is that it can be compared to the bio- capacity of the country, thus it can be a mean of illustrating the finite nature of natural capital and it allows quantifying the limits of sustainability. The meth- odological root of the carbon footprint goes back to the concept of “the energy cost of living” developed in the 1970s, and to the net energy analysis (Her- endeen, 1976).
When analysing the footprint, the use of input-output tables in the methodology is essential, as it can reveal the inter-industrial dependencies in the economy (e.g. services indirectly require the use of all other sectors) and by it the emis- sions and environmental impacts can be allocated to the final consumption cate- gories (Csutora, 2012). The input-output approach has the essential advantage of being able to track the transformation of goods through an economy, tracing impact from final product back to raw resources. It also captures the impact of exchanged goods and services. This application is used after Leontief, whose
1 Kiss (2012) deals with an other aspect of the Hungarian ecological footprint.
studies (Leontief (1936) and (1970)) can be a starting point for the methodol- ogy. The use of the (I–A)-1 Leontief inverse matrix in the calculation is of great importance in the sustainability evaluation of trade. Wiedmann et al. (2006) propose the application of input-output analysis to allocate footprint into de- tailed consumption categories.
In the following section a brief summary is given about studies examining the environmental impact and footprint of international trade, using input-output models.
Van Vuuren et al. (1999) were among the first ones who analysed the relation of the ecological footprint and international trade. They found that the Nether- lands uses three-four time as much land as it is geographically comprised of for sustaining its economic activities. Much research examined the regional scale;
Ferng (2002) analyzed the energy footprint of international trade in 14 produc- ing sectors, Andersson and Nevalainen (2003) conducted a study on Finnish international trade. Ahmad and Wyckoff (2003) examined in 24 countries the impact of CO2 emissions of international trade. Peters and Hertwitch (2006) used input-output analyses and structural path analyses for examining the envi- ronmental impact of international trade in Norway. Turner et al. (2007) gives a detailed insight into the methodology of the ecological footprint of international trade, using input-output tables. Peters (2007) developed this model examining 87 countries in a 57 sectoral model and Wiedmann (2008) produced a compara- tive study about using the input-output tables of MRIO analysis or the Product Land Use Matrix of the Global Footprint Network.
The calculation using the input-output analysis supports the principle of con- sumer responsibility, so in this study that kind of analysis is used.
3. Methodology
For calculating the carbon footprint of international trading activities, regard- ing the footprint of domestic and import consumption, the methodology pro- posed by Wiedmann (2006), Munksgaard (2001) and Peters (2008) was used.
The general formula calculating the carbon footprint is the following:
CF= F (I−A)-1 ycom
Where:
F is a row vector, each element representing the carbon footprint value (domestic and imported environmental load together) per unit of industry output,
(I-A)-1 represents the direct and indirect requirement matrix calculated from the symmetric input-output (industry by industry) tables. This is the so-called Leontief inverse matrix, showing the input requirements in case of one additional unit of output.
ycom is the vector of the domestic consumption’s final demand, in the con- sumption categories.
F (I-A)-1 is often referred to as the multiplier or total intensity matrix.
The aim of this study is to quantify the environmental load generated by household consumption, according to the principle of consumer responsibility;
it can be calculated by utilizing the following formula:
CFcons = F (I−A)-1 diag (y)
The vector of the domestic final demand needs to be diagonalised in order to obtain the consumer’s environmental load.
The carbon footprint of the household’s final consumption can be decom- posed into two parts.
1. The Carbon Footprint of domestically produced products and services (CFd), which has been emitted because of the domestic consumer demand.
Emissions due to exported products are not included.
CFd = F (I−Ad)-1 yd
Where Ad is the matrix of domestic industry requirements of domestically produced products, calculated from the IO table, and yd is the vector of final demand of domestic consumption.
2. The Carbon Footprint of imported goods and services, which can be fur- ther divided according to the origin of the footprint.
CFm = F {((I−A)-1 − (I−Ad)-1) yd + (I−A)-1 ym } Inputs for imports Inputs for imports used for domestic consumed directly production
The carbon footprint of direct imports shows the environmental load of im- ported products immediately and directly used for final domestic demand. The input which is needed for direct imports is the following:
(I−A)-1 ym , whereym is the vector of import consumption.
The import used for inputs in domestic production for final demand is:
((I−A)-1 − (I−Ad)-1) yd
In the calculation of the import footprint, the Leontief inverse is used and it is assumed that each commodity imported is produced by using proportionally the same kind of inputs (materials, intermediates, labour and energy) as used in the domestic production sector.
Year 2005 was chosen for the analyses, as the most recent data was available for this year. The symmetric input-output matrix from the Eurostat database was used, and the carbon footprint values were from the database of the Global Footprint Network, used in the environmentally extended matrix, also for year 2005.
As the last step of the calculation, the carbon footprint of final demand was reallocated to final consumption categories, using the COICOP international classification tables. The contribution to the carbon footprint of 12 final con- sumption categories was analysed.
Decomposing the carbon footprint allows us to identify and analyse the envi- ronmental load generated by domestic production or by imports, which can be a new and also politically relevant methodology.
4. Results and Discussion
The carbon footprint of domestic household consumption has been analysed, as there is an increasing awareness of an individual’s behaviour or lifestyle as a source of carbon emissions (Bin and Dowlatabandi, 2005). Thus it is essential to get a clear picture of consumer habits and their environmental impacts related to domestic and imported emissions.
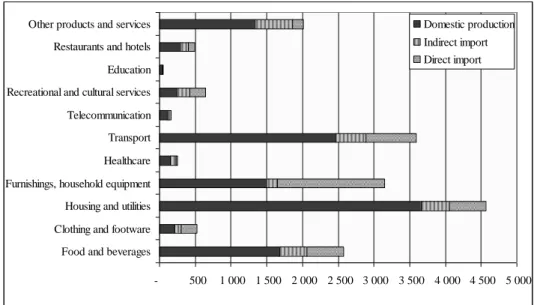
The carbon footprint has been decomposed according to the methodology and Figure 1 shows the structure of the carbon footprint.
- 500 1 000 1 500 2 000 2 500 3 000 3 500 4 000 4 500 5 000 Food and beverages
Clothing and footware Housing and utilities Furnishings, household equipment Healthcare Transport Telecommunication Recreational and cultural services Education Restaurants and hotels Other products and services
Carbon Footprint, in 12 consumption categories (thousand gha) Domestic production Indirect import Direct import
Figure 1. Hungarian household carbon footprint (gha/year) according to origin of environmental load – author’s own calculation
It can be seen that the carbon footprint of direct imports is the most signifi- cant in the consumption category of furnishings, household equipment and maintenance, followed by transportation. A major part of the energy use of Hungarian households is also covered by imports, thus the housing and utilities consumption sector is also very carbon-intensive in the final consumption sec- tor. The impact of direct imports is also notable in the clothing and footware category. The impact of indirect imports is significant in healthcare and in other products and services categories.
The footprint related to imported materials or products does not have an envi- ronmental load where the products are consumed, but rather in the producing country, thus Hungary imports a great part of biocapacity from its commercial partners.
Because of the results above, there is a need for a further and more detailed examination in the consumption categories where the carbon footprint is very high and international trade plays an important role.
Taking a closer look at the environmental load of Transportation, it can be seen that the Transport services are a major part of the carbon footprint. More precisely, it is the road transport which is the reason for a great part of the emis- sions (Figure 2). In case of the operation of personal transport equipment, it is the fuel used for operating the equipment which causes the environmental load, but a major part of this kind of emission does not appear in the producing coun- try - the part of the footprint derived from direct imports is rather significant.
- 500 000 1 000 000 1 500 000 2 000 000 2 500 000
Purchase of vehicles Operation of personal transport
equipment
Transport services
gha
Direct import Indirect import Domestic production
Figure 2. The carbon footprint of the transportation consumption category- author’s own calculation
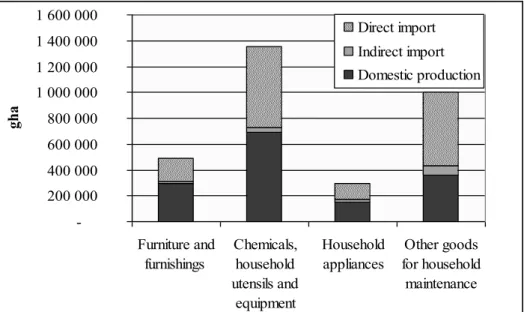
The carbon footprint of furnishings, household equipment and maintenance needs to be analysed as well. Figure 3 shows that the chemicals, household utensils and other household products categories have the highest carbon foot-
print, but only half of it is produced domestically. So, we can say in case of the chemicals, utensils used for households Hungary imports biocapacity, as the emissions do not impact the domestic environment, but that of the producing country. The domestic carbon footprint is significant in the cases of furniture and furnishings. We can conclude as well that indirect imports are not really noteworthy. Summarizing the results, it can be concluded that in this consump- tion category the impacts of the imported products and materials exceed that of the domestic ones.
- 200 000 400 000 600 000 800 000 1 000 000 1 200 000 1 400 000 1 600 000
Furniture and furnishings
Chemicals, household utensils and
equipment
Household appliances
Other goods for household
maintenance
gha
Direct import Indirect import Domestic production
Figure 3. The structure of the carbon footprint of the furnishings, household equipment and maintenance consumption categories – author’s own calculation
5. Conclusions
As international trade increases, it becomes more important to include the impact of it in environmental analyses, as partly it can be a complicating factor driving and also masking unsustainable consumption patterns. The focus of this study was to investigate the impact of domestic and imported emissions, using the carbon footprint as an indicator.
We could see that there are such consumption categories in which Hungarian households cause great environmental impact outside of the country borders, in the producing countries. Using the methodology, which has been introduced and applied here, the impact of international trading activities can easily be analysed. Not only the impacts of the final demand and consumption can be revealed, but also indirect impacts – which play an important role in the struc- ture of the carbon footprint, important to deal with.
It is an important observation that those consumption categories that are re- sponsible for the highest carbon footprint of Hungarian households are those where consumption patterns can directly be influenced by individual consumer behaviour. Consumer lifestyle has an extremely great impact on the environ- mental load which is why it is important to make analyses using the consumer responsibility principle.
The consumption categories of housing and transportation have the highest footprint, there is direct consumer influence, so it can be modified though con- scious consumption decisions. This would be desirable, but unfortunately politi- cal efforts do not entirely support this direction – they tend to favour carbon emission reductions from the production side, not promoting efficiently the possibilities of reduction by consumers.
A further investigation of international trade-related environmental impacts is needed in order to analyse the cross-effects of imported products. The method- ology of carbon footprint calculation can also be refined in the future. The de- velopment of footprinting calculation of shared responsibility principle can be a promising and useful issue, as there is increasing recognition that the impact of international trade should be allocated to the country which generated the de- mand and where it is consumed.
References
Ahmad, N., Wyckoff, A. (2003): Carbon dioxide emissions embodied in international trade of goods. DSTI/DOC(2003)15. OECD
Andersson, J. O., Nevalainen, M. (2003): Unequal Exchange in Terms of Ecological Footprints: The Case of Finland Today. Worlds System History and Global Environmental Change.
Boda, Zs.; Pataki, Gy.(1995): A nemzetközi versenyképesség és a környezet- ügy. Közgazdasági Szemle, XLII. évf. 1. 66–94.
Bin, S., Dowlatabadi, H. (2005): Consumer lifestyle approach to US energy use and the related CO2 emissions. Energy Policy 33. 197–208.
Csutora, M. (2012): One More Awareness Gap? The Behaviour–Impact Gap Problem. JOURNAL OF CONSUMER POLICY 35:(1) pp. 145–163.
Ferng (2002): Toward a scenario analysis framework for energy footprints.
Ecological Economics 40. pp. 53–69.
Herendeen, R. A.; Tanaka, J. (1976): Energy cost of living. Energy, 1, 165–178.
Hertwich, E.G. (2005): Lifecycle approaches to sustainable consumption: a critical review. Environmental Science and Technology 39. 1433–1450.
IPCC (Intergovernmental Panel for Climate Change) (2007): Climate Change 2007. The Physical Science Basis, Geneva.
Knaus, M., Lohr, D., O'Regan, B. (2006): Valuation of ecological impacts — a regional approach using the ecological footprint concept. Environment Impact Assessment Review 26. 156–169.
Kiss, Károly (2012): Mennyire terheli a környezetet a hazai háztartások fo- gyasztása? A fogyasztási szerkezet vizsgálata ÁKM-együtthatókkal, in:
Marjainé Szerényi Zs. – Podruzsik Sz. (eds.) (2012): Fenntartható fejlődés, él- hető régió, élhető települési táj. Tudományos közlemények II., Budapesti Corvinus Egyetem, p. 5-26.
Lenzen, M. Murray, J. Sack, F., Wiedmann, T. (2007): Shared producer and consumer responsibility-theory and practice. Ecological Economics 61 (1).
27–42.
Lenzen, M.Dey, C., Foran, B. (2004): Energy requirements of Sydney households. Ecological Economics, 49. 375–399.
Leontief, W. (1936): Quantitative input and output relations in the economics system of the United States. Review of Economics and Statistics, 18. 105–125.
Leontief, W. (1970): Environmental repercussions and the economics structure of input-output approach. Review of Economics and Statistics 52.
262–277.
Marjainé Szerényi Zsuzsanna, Kocsis Tamás (2012): Vízlábnyom: a fenntarthatóság egy új mérőszáma? (Water Footprint: a new indicator of sus- tainability? in Hungarian) Pp: 63–75. In: Kerekes, S., Jámbor, I. (szerk.) 2012.
Fenntartható fejlődés – Élhető régió – Élhető települési táj. Tudományos Közlemények I. Budapesti Corvinus Egyetem, Budapest. p. 279. ISBN 978- 963-503-504-5. http://korny.uni-corvinus.hu/publikaciok/ff-zarokotet/1/mar- jaine-szerenyi-zsuzsanna-kocsis-tamas.pdf
Marjainé Szerényi, Zsuzsanna, Ágnes Zsóka, Katalin Ásványi, Zsuzsanna Flachner (2011): The role of adaptation to climate change in rural development, Regional and Business Studies (2011) Vol 3 Suppl 1, 189-198, Kaposvár Uni- versity, Faculty of Economic Science, Kaposvár. ISSN: 2061-2311
Monfreda, C., Wackernagel, M., Deumling, D. (2004): Establishing national natural capital accounts based on detailed ecological footprint and biological capacity assessments. Land Use Policy 21. 231–246.
Munksgaard, J., Pedersen, K.A. (2001): CO2 accounts for open economies:
producer or consumer responsibility?. Energy Policy 29. 327–334.
Peters, G. P. (2008): From production-based to consumption-based national emission inventories. Ecological Economics, 65. 13–23.
Peters, G. P. (2007): Opportunities and challenges for environmental MRIO modelling: Illustrations with GTAP database. 16th International Input-Output Association (IIOA), Istanbul, Turkey, http://www.io2007.itu.edu.tr
Peters, G. P. and Hertwich, E.G. (2006): Structural analysis of international trade: environmental impacts of Norway, Economics System Research 18.
155–181.
Rees, W. E. (1996): Revisiting carrying capacity: area-based indicators of sustainability. Population and environment 17 (3). 195–215.
Schaltegger S, Csutora M. (2012): Carbon accounting for sustainability and Management.Status quo and challenges JOURNAL OF CLEANER PRODUC- TION 36: (Nov) pp. 1–16.
Tukker, A., Jansen, B. (2006): Environmental
impacts of products — a detailed review of studies.
Journal of Industrial Ecology 10. pp.159–182.
Turner, K., Lenzen, M., Wiedmann, T., Barrett, J. (2007): Examining the global environmental impact of regional consumption activities- Part 1: a technical note on combining input-output and Ecological Footprint analysis.
Ecological Economics 62 (1). 37–44.
Van Vuuren, D. P., Smeets, E. M. W. (1999): The Ecological Footprint of Benin, Bhutan, Costa Rica and the Netherlands. RIVM, p.64.
Weber C. L., Matthews, H. S. (2007): Quantifying the global and distributional aspects of American household carbon footprint.
Ecological Economics, 66. 379–391.
Wiedmann, T., Minx, J., Barrett, J., Wackernagel, M. (2006):
Allocating ecological footprints to final consumption categories with input-output analysis. Ecological Economics, 56., 28–48.
Wiedmann, T. (2008): A first empirical comparison of energy Footprints embodied in trade- MRIO versus PLUM. Ecological Economics 68.
1975–1990.