Applying consumer responsibility principle in evaluating environmental load of carbon emissions
Zsófia Vetőné Mózner Ph.D. student
Corvinus University of Budapest, Institute of Environmental Sciences Department of Environmental Economics and Technology
Budapest, Hungary
Email: zsofia.mozner@uni-corvinus.hu
Abstract
There is a need for a proper indicator in order to assess the environmental impact of international trade, therefore using the carbon footprint as an indicator can be relevant and useful. The aim of this study is to show, from a methodological perspective, how the Carbon Footprint combined with input-output models can be used for analysing the impacts of international trade on the sustainable use of national resources in a country. The use of the input-output approach has the essential advantage of being able to track the transformation of goods through the economy.
The study examines the environmental impact of consumption related to international trade, using the consumer responsibility principle. In this study the use of the carbon footprint and input-output methodology is shown on the example of the Hungarian consumption and international trading impact.
Moving from a production-based approach in climate policy to a consumption-perspective principle and allocation, would also help to increase the efficiency of emission reduction targets and the evaluation of the ecological impacts of international trade.
The research is part of the “Sustainable Consumption, Production and Communication”
Project financed by the Norwegian Fund.
Keywords: Embodied Carbon Footprint, International Trade, Input-ouput analysis, Households Consumption
JEL codes: C67, F18, Q56
1. Introduction
It has been widely accepted that one of the major reasons for climate change, is the increasing concentration of greenhouse gases in the atmosphere, and there is a consensus that anthropogenic carbon emissions contribute to it essentially [IPCC, 2007]. In order to evaluate the impact of the emissions and to implement effective measures, there is a need for a proper indicator. Therefore the carbon footprint can be a useful indicator helping decision-makers to define in which sector there is a high need to interfere.
Countries of the world tend to become more and more dependent on each other in economic terms in the process of globalization. Because of this, the production and consumption of goods and services and their environmental impact have become fairly separated from each other in time and space as well. Due to international trade, nowadays it has become possible for countries to import biocapacity and become dependent on other countries’ ecological stock (Prónay-Málovics 2008).
It is highly essential to investigate what are the impacts of this phenomenon on the natural stock and sustainability of a country, and to move forward towards an approach where consumer responsibility is dominant.
This paper quantifies Hungarian households’ carbon footprints from a consumption perspective, calculating and examining the environmental pressures associated with imports and domestic consumption. The importance of analysing the domestic emissions is that the current National Emission Inventories are production-based, thus it is important to know what the environmental impact of international trade is in order to satisfy domestic demand. In the Kyoto agreement this principle is presumed as well. The aim of the study is to examine the role of international trade, how the delocalization of production affects the structure of the carbon footprint. The findings can highlight the problem decision-makers are faced when trying to reduce CO2 emissions in a country embedded in a global trading system.
2. Theoretical background
In this section a brief overview is given about the carbon footprint and its origin, followed by a literature review of the relevant studies.
Originally, the carbon footprint was one component of the full ecological footprint analysis, but it can be calculated and discussed separately as well, and because of climate change it has risen to prominence in a very notable way.
The ecological footprint is an indicator, introduced and developed by Wackernagel and Rees [1996]. It is defined as “the corresponding area of productive land and aquatic ecosystems required to produce the resource used, and to assimilate the waste produced, by a defined population at a specified material standard of living, wherever on Earth that land may be located” [Rees, 1996]. The ecological footprint can be compared to the biocapacity of a nation on an aggregate basis and if the ecological footprint of that nation exceeds the biocapacity then there will be an ecological deficit.
During the calculation of the carbon footprint, CO2 emission data are translated into the area, measured in global hectares, which accounts for absorbing the carbon emissions. The carbon footprint is the area of annual forestry required to sequester the CO2 emissions [Monfreda, 2004]. According to Knaus et al. (2006) the carbon footprint refers to the land appropriated by fossil energy use or land required to absorb the CO2 or the land required to generate the amount of fuel crops equivalent to the fossil energy consumption.
The methodological root of the carbon footprint goes back to the concept of “the energy cost of living” developed in the 1970s, and to the net energy analysis [Herendeen, 1976].
The carbon footprint can be made up of the sum of two parts. The direct or primary footprint is a measure of our direct emissions of CO2 from the burning of fossil fuels including domestic energy consumption and transportation (e.g. car and plane). The indirect or secondary footprint is a measure of the indirect CO2 emissions from the whole lifecycle of products and services we use including those associated with their manufacture and eventual breakdown [Tukker and Jansen, 2006].
The carbon footprint is often associated with offsite, indirect impact, stemming from the production phase and imports. Due to increased international trade much of the proportion of the CO2 emission occurs outside the country. International trade is not only a major factor in forging a country’s economic structure, but it does have a significant impact on the carbon footprint and on the ecological impact of consumption. Thus it is highly essential to reveal the impacts of foreign commerce on the sustainable use of national resources in a country.
In the following section a brief summary is given about studies examining the environmental impact and footprint of international trade, using input-output models.
Van Vuuren et al. [1999] were among the first ones who analysed the relation of the ecological footprint and international trade. They found that the Netherlands uses three to four time as much land as it is geographically comprised of for sustaining its economic activities.
Much research examined the regional scale; Ferng [2002] analyzed the energy footprint of international trade in 14 producing sectors, Andersson and Nevalainen [2003] conducted a
study on Finnish international trade. Ahmad and Wyckoff [2003] examined the impact of CO2 emissions of international trade in 24 countries. Hornborg (2005) carried out a historical research on the agricultural trade and its impacts in the United Kingdom. Peters and Hertwitch [2006] used input-output analyses and structural path analyses for examining the environmental impact of international trade in Norway. Turner et al. [2007] gives a detailed insight into the methodology of the ecological footprint of international trade, using input- output tables. Peters [2007] developed this model examining 87 countries in a 57- sectoral model and Wiedmann [2008] produced a comparative study about using the input-output tables of MRIO (Multi-Regional Input-Output) analysis or the Product Land Use Matrix of the Global Footprint Network. A recent study of Dobos and Csutora (2010) highlights the calculation of dynamic ecological footprint by using dynamic input-output models. Kocsis (2010) analyses the relationship between GDP, ecological footprint and subjective well-being from a macro perspective highlighting the need for dematerialization of economic activities and human well-being.
The calculation using the input-output analysis supports the principle of consumer responsibility, as it allocates environmental impacts to final consumption categories, so in this study that kind of analysis is used.
3. Producer or consumer responsibility?
The current National Emission Inventories are production-based, as commonly known.
Therefore its drawback is that the emissions include all greenhouse gas emission and removal taking place within the country borders, so the emissions due to production for exports are included as well. Many critiques suggest using consumption-based inventories which include imports but subtract exports.
According to Peter and Hertwich (2008) the consumption-based National Emission Inventories (NEI) would have a number of advantages, and it would be consistent with the current logic of international trade:
Covering more global emissions with limited participation Increasing mitigation options
Encouraging cleaner production
Supporting the spread of environmental policies such as Clean Development Mechanism (CDM).
It has to be noted that the consumption-based approach has several pieces of disadvantages as well, as it would require more complex calculations, thus it would increase uncertainty.
Lenzen et al. (2007) suggest sharing responsibility between producers and consumers, where the responsibility would amount to weighting the emissions embodied in imports and exports.
Allocation of national emissions
Criteria
Production-based NEI (territorial-based NEI)
Consumption - based NEI
Emissions covered Administered territory Global
Allocation Domestic production Domestic
consumption Allocation of trade
Includes exports, not imports
Includes imports, not exports Comparability Consistent with GDP Consistent with
national consumption Consistent with trade
policy No Yes
Complexity Low High
Transparency High Low
Uncertainty Lower Higher
Mitigation analysis
Domestic mitigation
only Global mitigation
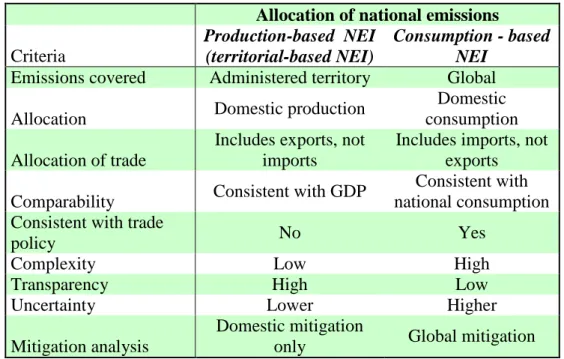
Table 1.: A comparison of the production-based and consumption-based National Emission Inventories (NEI)
Source: Peters (2008)
Table 1. gives an overview of the major differences between the production-based and consumption-based National Emission Inventories.
4. Methodology
In the analyses an environmentally extended input-output table was used combined with carbon footprint calculations. When analysing the carbon footprint, the use of input-output tables in the methodology is essential, as it can reveal the inter-industrial dependencies in the economy (e.g. services indirectly require the use of all other sectors) and by it the emissions and environmental impacts can be allocated to the final consumption categories. The input- output approach has the essential advantage of being able to track the transformation of goods through an economy, tracing impact from final product back to raw resources. It also captures the impact of exchanged goods and services. This application is used after Leontief, whose studies (Leontief [1936] and [1970]) can be a starting point for the methodology.
The use of the (I-A)-1 Leontief inverse matrix in the calculation is of great importance in the sustainability evaluation of trade. Wackernagel et al. [2006] propose the application of input-output analysis to allocate footprint into detailed consumption categories.
For calculating the carbon footprint of international trading activities, regarding the footprint of domestic and import consumption, the methodology proposed by Wackernagel [2006], Munksgaard [2001] and Peters [2008] was used.
Year 2005 was chosen for the analyses, as the most recent data was available for this year.
The Hungarian Central Statistical Office (KSH) publishes symmetric, industry by industry input-output tables once in five years time. The symmetric input-output matrix from the Hungarian Central Statistical Office’s database was used, and the carbon footprint values were from the database of the Global Footprint Network, used in the environmentally extended matrix, also for year 2005. In the database of the Global Footprint Network emission data were given in product level.
The standard input-output accounts begin with an accounting balance of monetary flows:
Where x is the vector of total output in each sector, y is a vector with each element representing final consumption (households, governments, capital) in each industry sector. e is the vector of total exports and m is the vector of total imports. A is the matrix for intermediate consumption, where Ax is the vector of total intermediate consumption.
The general formula calculating the carbon footprint is the following:
Where:
F: is a row vector, each element representing the carbon footprint value (domestic and imported environmental load together) per unit of industry output
(I-A)-1 represents the direct and indirect requirement matrix calculated from the symmetric input-output (industry by industry) tables. This is the so-called Leontief inverse matrix, showing the input requirements in case of one additional unit of output
ycom is the vector of the domestic consumption’s final demand, in the consumption categories
is often referred to as the multiplier or total intensity matrix
The aim of this study is to quantify the environmental load generated by household consumption. According to the principle of consumer responsibility, it can be calculated by utilizing the following formula:
The vector of the domestic final demand needs to be diagonalised in order to obtain the consumer’s environmental load. The result is a matrix which shows the individual carbon footprint values of the industrial sectors in the analysed category.
The carbon footprint of the household’s final consumption can be decomposed into two parts.
1. The Carbon Footprint of domestically produced products and services (CFd), which has been emitted because of the domestic consumer demand. Emissions due to exported products are not included.
Where Ad is the matrix of domestic industry requirements of domestically produced products, calculated from the IO table, and yd is the vector of final demand of domestic consumption.
2. The Carbon Footprint of imported goods and services, which can be further divided according to the origin of the footprint.
Inputs for imports Inputs for imports used for domestic production consumed directly
The carbon footprint of direct imports show the environmental load of imported products immediately and directly used for final domestic demand. The input which is needed for direct imports is the following:
where ym is the vector of import consumption.
The import used for inputs in domestic production for final demand is:
In the calculation of the import footprint, the Leontief inverse is used and it is assumed that each commodity imported is produced by using proportionally the same kind of inputs (materials, intermediates, labour and energy) as used in the domestic production sector.
As the last step of the calculation, the carbon footprint of final demand was reallocated to final consumption categories, using the COICOP international classification tables. The contribution to the carbon footprint of 12 final consumption categories was analysed.
Decomposing the carbon footprint allows us to identify and analyse the environmental load generated by domestic production or by imports, which can be a new and also politically relevant methodology.
5. Results and Discussion
In this section, I would like to analyse the carbon footprint of domestic household consumption and the carbon footprint of imported products. First, the carbon footprint of domestic household consumption has been analysed, as there is an increasing awareness of an individual’s behaviour or lifestyle as a source of carbon emissions [Bin and Dowlatabandi, 2005]. Thus it is essential to get a clear picture of the consumer habits and its environmental impacts, related to domestic emissions.
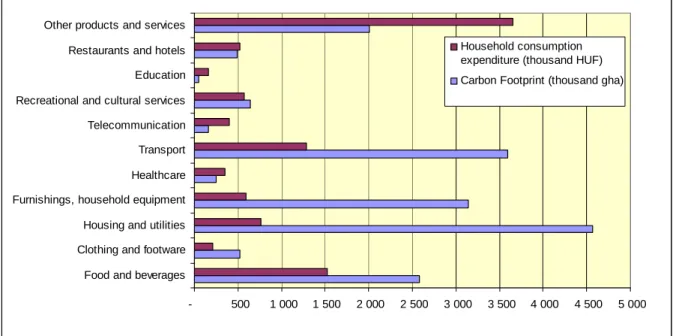
The empirical results of the carbon footprint of household consumption (Figure.1.) show that the housing and utilities (water, electricity, gas and other fuels), are highly responsible for a significant part of the domestic carbon footprint. It has to be noted that the direct carbon emissions were allocated to this consumption category, thus accounting for almost 50% of the carbon footprint in this category. The consumption category with the second largest footprint is the transportation, followed by the food and beverages consumption, where especially the animal products contribute to the footprint with a great extent. Comparing the environmental impacts with the expenditures, it can be seen that the different consumption categories have different shares of expenditures and shares of footprint, the carbon intensities vary. Transport and housing, utilities, and furnishings consumption generate higher footprint after each spent currency unit, while recreational and cultural services have a less polluting nature.
Figure 1: Final consumption expenditure (2005) and carbon footprint (gha/yr) from final household consumption of domestically produced products and services, in 12 consumption categories, author’s own calculation
- 500 1 000 1 500 2 000 2 500 3 000 3 500 4 000 4 500 5 000 Food and beverages
Clothing and footware Housing and utilities Furnishings, household equipment Healthcare Transport Telecommunication Recreational and cultural services Education Restaurants and hotels Other products and services
Household consumption expenditure (thousand HUF) Carbon Footprint (thousand gha)
In order to get a detailed picture of the emissions embodied in international trade, the carbon footprint has been decomposed according to the methodology and Figure 2. shows the structure of the Hungarian carbon footprint.
Figure 2: Hungarian household carbon footprint (gha/ year) according to origin of environmental load – author’s own calculation
- 500 1 000 1 500 2 000 2 500 3 000 3 500 4 000 4 500 5 000 Food and beverages
Clothing and footware Housing and utilities Furnishings, household equipment Healthcare Transport Telecommunication Recreational and cultural services Education Restaurants and hotels Other products and services
Carbon Footprint, in 12 consumption categories (thousand gha) Domestic production Indirect import Direct import
As the total consumption of Hungary cannot be covered by domestic production, there is a need for imports. We can see the difference between the impact of household consumption of products produced domestically, and the impact including imported products as well. It can be seen that the carbon footprint of direct imports is the most significant in the consumption category of Furnishings, household equipment and maintenance, followed by Transportation. A major part of the energy use of Hungarian households is also covered by imports, thus the Housing and utilities consumption sector is also very carbon-intensive one, in the final consumption sector. The impact of direct imports is also notable in the Clothing and footware category. The impact of indirect imports is significant in the Healthcare and in the Other products and services category.
The footprint related to imported materials or products does not have an environmental load where the products are consumed, but rather in the producing country, thus Hungary imports a great part of biocapacity from its commercial partners.
Because of the results above, there is a need for a further and more detailed examination of the consumption categories where the carbon footprint is very high and international trade plays an important role. First, the carbon footprint of Transportation is analysed.
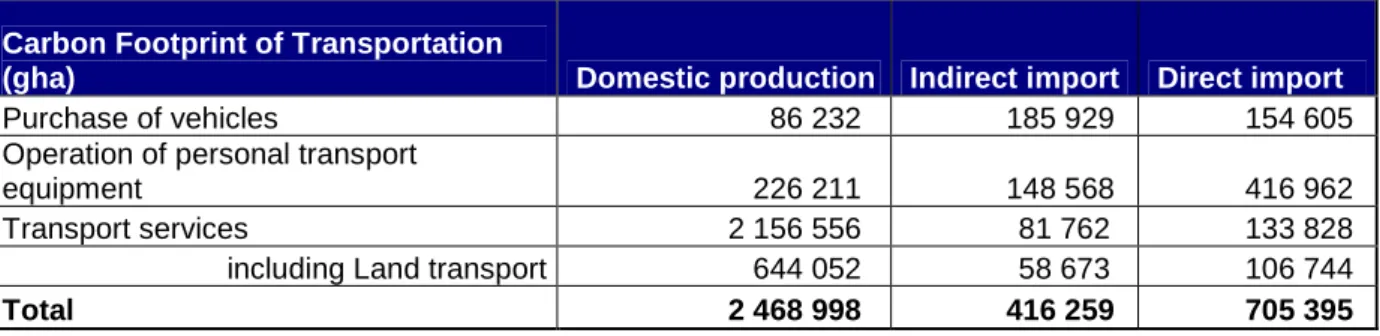
Table 2.: The carbon footprint of the Transportation consumption category- author’s own calculation
Carbon Footprint of Transportation
(gha) Domestic production Indirect import Direct import Purchase of vehicles 86 232 185 929 154 605 Operation of personal transport
equipment 226 211 148 568 416 962 Transport services 2 156 556 81 762 133 828 including Land transport 644 052 58 673 106 744
Total 2 468 998 416 259 705 395
Taking a closer look at the environmental load of Transportation, it can be seen that the Transport services are a major part of the carbon footprint. More precisely, it is the road transport which is the reason for a great part of the emissions (Table 2.).
In case of the Operation of personal transport equipment, it is the fuel used for operating the equipment which causes the environmental load, but a major part of this kind of emission does not appear in the producing country - the part of the footprint derived from direct imports is rather significant.
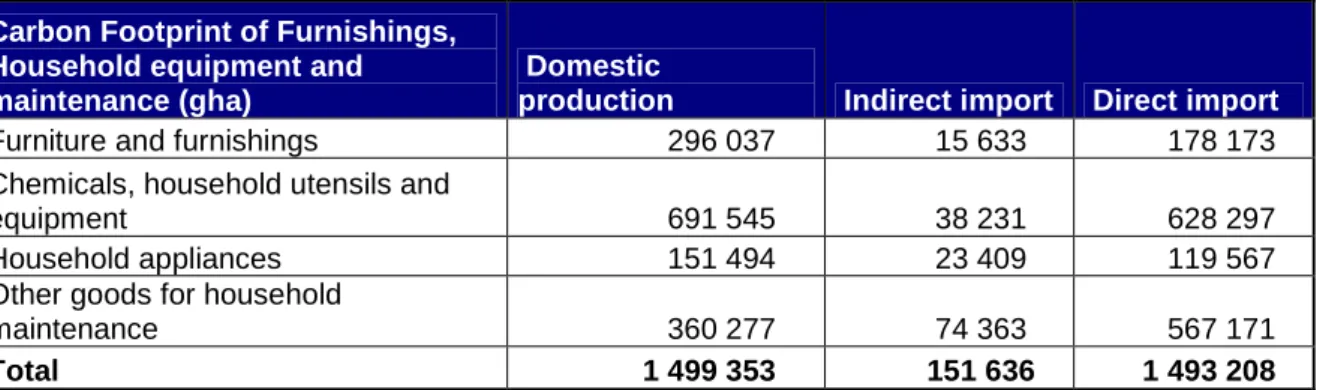
Table 3: The structure of the carbon footprint of the Furnishings, Household equipment and maintenance consumption category – author’s own calculation
Carbon Footprint of Furnishings, Household equipment and maintenance (gha)
Domestic
production Indirect import Direct import Furniture and furnishings 296 037 15 633 178 173 Chemicals, household utensils and
equipment 691 545 38 231 628 297 Household appliances 151 494 23 409 119 567 Other goods for household
maintenance 360 277 74 363 567 171 Total 1 499 353 151 636 1 493 208
The carbon footprint of Furnishings, Household equipment and maintenance needs to be analysed as well. Table 3. shows that the Chemicals, household utensils and other household products category have the highest carbon footprint, but only half of it is produced domestically. So, we can say in case of the chemicals, utensils used for households, Hungary imports biocapacity as the emissions do not impact the domestic environment, but that of the producing country. The domestic carbon footprint is significant in the cases of Furniture and furnishings. We can conclude as well that indirect imports are not really noteworthy.
Summarizing the results, it can be concluded that in this consumption category the impacts of the imported products and materials exceed that of the domestic ones.
6. Conclusions
As international trade increases, it becomes more important to include the impact of it in environmental analyses, as partly it can be a complicating factor driving and also masking unsustainable consumption patterns. The focus of this study was to investigate the impact of domestic and imported emissions, using the carbon footprint as an indicator.
We could see that there are such consumption categories in which Hungarian households cause great environmental impact outside of the country borders, in the producing countries.
Using the methodology, which has been introduced and applied here, the impact of international trading activities can easily be analysed.
Not only the impacts of the final demand and consumption can be revealed, but also indirect impacts – which play an important role in the structure of the carbon footprint, important to deal with.
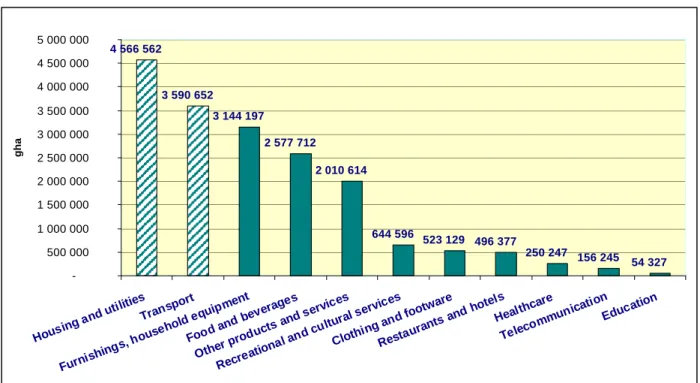
It is an important observation that those consumption categories that are responsible for the highest carbon footprint of Hungarian households are those where consumption patterns can directly be influenced by individual consumer behaviour. The consumer lifestyle has an extremely great impact on the environmental load that is why it is important to make analyses using the consumer responsibility principle. Figure 3. shows that in the first two consumption categories (Housing and utilities and Transport), having the highest footprint, there is direct consumer influence, so it can be modified though conscious consumption decisions. This would be desirable, but unfortunately the political efforts do not entirely support this direction, – they tend to favour carbon emission reductions from the production side, not promoting efficiently the possibilities of reduction by consumers.
Figure 3: The carbon footprint of households’ consumption – author’s own calculation
A further investigation of international trade-related environmental impacts is needed in order to analyse the cross-effects of imported products. The methodology of carbon footprint calculation can also be refined in the future. The development of footprinting calculation of shared responsibility principle can be a promising and useful issue, as there is increasing recognition that the impact of international trade should be allocated to the country which generated the demand and where it is consumed.
4 566 562
3 590 652
3 144 197
2 577 712
2 010 614
644 596
523 129 496 377
250 247 156 245 54 327 -
500 000 1 000 000 1 500 000 2 000 000 2 500 000 3 000 000 3 500 000 4 000 000 4 500 000 5 000 000
Housing and utilities Transport
Furnishings, household equipment Food and beverages
Other products and services
Recreational and cultural services
Clothing and footware
Restaurants and hotels Healthcare
Telecommunication
Education
gha
References
Ahmad, N., Wyckoff, A. (2003). Carbon dioxide emissions embodied in international trade of goods. DSTI/DOC(2003)15. OECD
Andersson, J. O., Nevalainen, M. (2003). Unequal Exchange in Terms of Ecological Footprints: The Case of Finland Today. Worlds System History and Global Environmental Change.
Bin, S., Dowlatabadi, H. (2005). Consumer lifestyle approach to US energy use and the related CO2 emissions. Energy Policy 33. 197–208.
Dobos, I.,Csutora M. (2010). The calculation of dynamic ecological footprint on the basis of the dynamic input-output model. Working paper, Corvinus University of Budapest
Eurostat. (2005). ESA 95 Supply Use and Input-Output tables
http://epp.eurostat.ec.europa.eu/portal/page/portal/esa95_supply_use_input_tables/dat a/workbooks
Ferng (2002). Toward a secanrio analysis framework for energy footprints. Ecolgoical Economics 40. pp. 53-69.
Global Footprint Network. (2008). National Footprint Accounts: Hungary.2008 Edition for Year 2005.
Herendeen, R. A.; Tanaka, J. (1976). Energy cost of living. Energy, 1, 165–178.
Hertwich, E.G. (2005). Lifecycle approaches to sustainable consumption: a crictical review. Environmental Science and Technology 39. 1433-1450.
Hornborg, A. (2005). Footprints in cotton fields: the Industrial Revolution as time- space appropriation and environmental load displacement. Ecological Economics 59.
74-81.
IPCC (Intergovernmental Panel for Climate Change) (2007). Climate Change 2007.
The Physical Science Basis, Geneva.
Kerekes, S. (2007). A környezetgazdaságtan alapjai [The basics of environmental economics]., Aula
Kocsis, T. (2010). Hajózni muszáj! A GDP, az ökológiai lábnyom és a szubjektív jóllét stratégiai összefüggései. [The strategic relationships of GDP, ecological footprint and subjective well-being] Közgazdasági szemle LVII. Évf.536-554.
Knaus, M., Lohr, D., O'Regan, B. (2006). Valuation of ecological impacts — a regional approach using the ecological footprint concept. Environment Impact Assessment Review 26. 156–169.
Lenzen, M. Murray, J. Sack, F., Wiedmann, T. (2007). Shared producer and consumer responsibility-theory and practice. Ecological Economics 61 (1). 27-42.
Lenzen, M.Dey, C., Foran, B. (2004). Energy requirements of Sydney households.
Ecological Economics, 49. 375–399.
Leontief, W. (1936). Quantitative input and output relations in the economics system of the United States. Review of Economics and Statistics, 18. 105-125.
Leontief, W. (1970). Environmental repercussions and the economics structure of input-output approach. Review of Economics and Statistics 52. 262-277.
Monfreda et al. (2004). Establishing national natural capital accounts based on detailed ecological footprint and biological capacity assessments. Land Use Policy 21.
231-246.
Munksgaard, J., Pedersen, K.A. (2001). CO2 accounts for open economies: producer or consumer responsibility?. Energy Policy 29. 327-334.
Peters, G. P. (2008). From production-based to consumption-based national emission inventories. Ecological Economics, 65. 13-23.
Peters, G.P. (2007). Opportunities and challenges for environmental MRIO modelling:
Illustrations with GTAP database. 16th International Input-Output Association (IIOA), Istanbul, Turkey, http://www.io2007.itu.edu.tr
Peters, G.P. and Hertwich, E.G. (2006). Structural analysis of international trade:
environmental impacts of Norway, Economics System Research 18. 155-181.
Prónay, Sz., Málovics, Gy. (2008). Lokalitás és fenntartható fogyasztás. [Locality and sustainable consumption] In.: Lengyel, I., Lukovics, M. (szerk.) (2008). Kérdőjelek a régiók gazdasági fejlődésében. JATEPress, Szeged, 184-203.
Rees, W.E. (1996). Revisiting carrying capacity: area-based indicators of sustainability. Population and environment 17 (3). 195-215.
Tukker, A., Jansen, B. (2006). Environmental impacts of products — a detailed review of studies. Journal of Industrial Ecology 10. pp. 159–182.
Turner et al. (2007). Examining the global environmental impact of regional consumption activities- Part 1: a technical note on combining input-output and Ecological Footprint analysis. Ecological Economics 62 (1). 37-44.
Van Vuuren et al. (1999). The Ecological Footprint of Benin, Bhutan, Costa Rica and the Netherlands. RIVM, p.64.
Wackernagel et al. (2006). Allocating ecological footprints to final consumption categories with input-output analysis. Ecological Economics, 56., 28-48.
Weber C. L., Matthews, H.S. (2007). Quantifying the global and distributional aspects of American household carbon footprint. Ecological Economics, 66. 379-391.
Wiedmann, T. (2008). A first empirical comparison of energy Footprints embodied in trade- MRIO versus PLUM. Ecological Economics 68. 1975-1990.