Zsófia Vetőné Mózner,
Andrea Tabi, Mária Csutora
Theoretical deficiencies in the calculation method of ecological footprint
– Comparing the environmental impacts
of intensive and extensive agricultural practices
1. Introduction
One of the greatest challenges for the mankind is how to ensure the life conditions for the growing population. The question arises how we will succeed in increasing agricultural production and in minimizing the detrimental impacts of agriculture at the same time. This question has evidently practical significance, and it also highlights a conflict between the neoclassical way of economic thinking and the ecological approach, which takes into account the biophysical limits of production as well.
The introduction of sustainable approach into agricultural practices would be the most effective solution, which sets the goal of the maximization of the net benefits for the society from the production of food and fibre and from ecosystem services (Tilman et al., 2002, Kelemen et al., 2008, Marjainé Szerényi et al., 2011a, Marjainé Szerényi et al., 2011b, Marjainé Szerényi and Eszlári, 2011).
The major issues of agricultural environmental impacts are the effective ma- nagement of fertilizer use and ecosystem services, namely: nutrient-use, water- use, maintaining the soil fertility content and sustainable livestock production.
The harmful environmental impacts of agriculture basically stem from the transformation of natural habitats to agricultural area. Agricultural practices can change the whole ecosystem through the conversion of the landscape and the usage of fertilizers and pesticides. Due to the spread of agrochemicals the cereal production has doubled in the past 40-50 years (FAO Database, 2010), in order to satisfy increasing demand for food which is the consequence of the growing population and growing income level, which has saved natural habitats from
agricultural conversion. Fertilizers and pesticides (fungicides, herbicides, insecticides etc.) are mostly nitrogen- (NOx, ammonium), phosphorus- and potassium-based. The overuse of fertilizers and pesticides through leaching into the soil causes its degradation and groundwater pollution.
Nitrates loading to lakes and rivers induce over-enrichment and eutro- phication endangering freshwater ecosystem. Crops can take up only 30–50% of nitrogen informs of nitrate (NO3
-) and ammonium (NH4
+) and approx. 45% of phosphorus fertilizers, thus great amount of the applied components are lost in the soil polluting groundwater.
Groundwater is the key element of freshwater purification and the main problem is that it can spread the nutrients and toxins in great expanse and load into the lakes and rivers in large distances as well increasing health risks for species, livestock and human beings. The health risk for mammals depends mainly on dose-effect and dose-response relationships, the physical state of the product (fertilizer, pesticide), and contact type (oral, dermal etc.).
Organophosphorus insecticides are considered to be very hazardous for animals, other pesticides are classified by the degree of hazard on the basis of LD50
(WHO, 1990). It also alters the terrestrial habitats of species, thus it affects the ecosystems by decreasing the biodiversity.
Sustainable agriculture tries to suggest an alternative, which will provide increased crop yields through more effective fertilizer, pesticide, and water use, ecologically conscious practices in soil maintaining and livestock production (Tilman et al., 2002).
In this article we aim at comparing the intensive and extensive agricultural practices and their environmental impacts on the example of three countries: the Netherlands, Hungary and Brazil. We analyze the relation between agricultural yield and its determining factors, in order the reveal the impacts of agricultural practice and in the quest for defining the amount of sustainable yield.
Furthermore a proposal is presented how the calculation of the yield factor could possibly be changed. Section 2 gives a detailed insight about the research question of the articles, its importance and focus. In section 3 a definition is given on how extensive and intensive agriculture can be defined and a brief overview is given on the agricultural features of the analyzed countries. In section 4 a literature review is given on the topic discussed here, then in section 5 the research methodology is presented and in section 6 the results and discussions can be found. Finally, conclusions are drawn.
2. Research question
The indicator of the ecological footprint aims at showing the difference between the sustainable way of living and the actual way of life and its impacts. Though, according to the calculation formula of the ecological footprint and the biocapacity, as for the cropland component, the ecological footprint cannot exceed the biocapacity.
The yield factor used in the calculation of the biocapacity is not the sustainable amount of yield for a given area, but is calculated from the real and actual yields, and this way the biocapacity and the ecological footprint for cropland give the same result.
So the biocapacity of cropland does not show the area what the sustainable amount of production would require, but the actual land used for agricultural production.
The reason for this way of calculation is that there is no available data to know what the sustainable amount is. The sustainable yield would be surely lower than the present amount, thus the overexploitation practices could be revealed. The importance of this research topic has already appeared in the study of Wackernagel et al. (2004). They suggest taking into the calculation of the productivity factor, which could be used even in time-series.
The optimal and sustainable production would be needed to calculate the ecological footprint and to show the real overshoot. In this study we aim at examining what the sustainable amount of yield could be and how it can be estimated. We start from the assumption that the regenerative capacity of the land should be taken into account in the calculation, therefore if the excessive fertilizer use cannot contribute anymore to the growth of the yield, then the yield production is beyond the limits of sustainability. A sustainable agriculture is one that is economically viable, provides safe, nutritious food and conserves and enhances the environment. Today, the drive for productivity should be combined with desire for sustainability.
Another problem is with the calculation of the cropland footprint that an increase is shown in the biocapacity, if a more efficient agricultural production manner is found, but it may not be sustainable, the overexploitation of soil by chemicals and fertilizer does not appear in the calculation and results. The real environmental load generated by agriculture is not revealed properly through
ecological footprint indicators, as the type of agricultural farming (thus the nature of the pollution it creates) is not incorporated in calculation processes.
The research question is a real challenge which is discussed here is of severe practical importance from the viewpoint of economics as well, as it incorporates a conflict between the need of providing food for the growing population and the ecological limits of the increasing crop yields. Strong yield growth would be necessary in the area of China, South Asia, Africa, but the environmental constraints will limit this process. As for Harris (1996), there is a conflict between the pressure to increase yields on the demand side and the requisites of long-term sustainability.
There is an ecological cost in achieving food supply for the world population and meeting the sustainability conditions. This cost, associated with supply expansion must be considered, not only the supply capacity of the world agriculture.
The approach of the neoclassical economics focuses classically on yield increases as a result from technological advances and increased input use. So, in this way the biophysical limits and the carrying capacity are not taken into ac- count. Neoclassical economists reject the necessity of taking into account the focus on limits, arguing the technological advances and the trading activities can solve the problem of the excessive use of agricultural land. On the contrary, the view of the ecological economics is based on the environmental limits of the growth system (Harris, 1996). Ecological economists (Martinez-Alier (1991) and Gever et al. (1991)) argued that the agricultural production is needed to be viewed in the perspective of ecological limits on carrying capacity.
3. Intensive and extensive agricultural practices:
the comparison of the Hungarian, Dutch and Brazilian agriculture
It is very difficult to define accurately the difference between intensive and extensive agricultural practices; they are usually applied on the same area combined, depending on the availability of resources and farming practices.
However, there are some peculiarities for both practice types.
Extensive agriculture generally uses larger land in order to produce the same yields than intensive agriculture and the crop yields primarily depend on the
natural fertility of the soil, climate and availability of water. Contrarily, intensive agricultural practices need larger amounts of capital and application of fertilizers and pesticides and irrigation equipment, which induces greater crop yields per unit of land than extensive agriculture. So, the main features are the scale of crop yield and fertilizer use relative to land area (Norton-Alwang, 1993).
Higher and increasing level of agricultural pollution is common in Europe. In case of Hungary, the present state of the agriculture is not desirable from ecological and social point of view, though the country is well-endowed for agricultural production; there are fertile soils and a high number of sunshine hours. The agricultural traditions are nearly a thousand years old, so because of this and the advantageous geographic features, the Hungarian agriculture can ensure good crop yields both in quality and in quantity. Hungary has a total area of 9.3 million hectares.
Almost two-thirds of the country’s total area is under agricultural cultivation, it can be considered high among the European countries. Only Denmark and the United Kingdom have higher proportions. 78% of this cultivable area was arable land and 17% was grassland, while kitchen gardens, orchards and vineyards had a combined share of only 5%. (MARD, 2009).
Agriculture has traditionally been an important sector in the Hungarian national economy. Because of the political transition, economic changes and restructuring have taken place, so the Hungarian agriculture has changed much during the last twenty years. In 1989, when the changes and transition started to take place, the agriculture accounted for 13.7% of the GDP, twenty years later, in 2009, it was only 3.7%.
As for the employment, 4.5% of the total active population is working in the agriculture, the sector does not use a relatively high amount of labour force, and from a social point of view, it does not provide them safe and adequate way of living.
The cereal production is important in Hungary, as in the foreign trade balance the cereal export contributed most to the food export. Hungary produces cereals on half of its agricultural area. The fertilizer application was very high in the 1980s, but after the transition it had fallen significantly. From an environmental point of view, the fertilizer use is not desirable, as in Hungary the rate keeps growing and the dominant practice is the unilateral nitrogenous fertilization, the
phosphorus- and potassium-based fertilization is of less importance. The irrigation is not significant in Hungary, it accounts only for 2% of the total cultivable area (MARD, 2009).
In case of the Netherlands, the country has long practices of intensive production. The Dutch agriculture can be divided into three main areas: crop production, dairy and livestock production, and horticulture. Therefore, the agricultural land can also be divided into three types: grasslands, farmlands, and horticultural lands. The agriculture in the Netherlands corresponds to 10% of the national value added and also the employment is higher, which is also around 10% (AER, 2008).
Because of the geographic situation of the country, extensive waterways and network of dams and dikes have been developed and built, which allow for easy irrigation and have produced very fertile soils. The fertilizer use is of great scale, which has created environmental pressures, as the application is very intensive, because of land shortage.
In the Netherlands without some sort of fertilization, much more land would be required to achieve the same yields as found with fertilized crops.
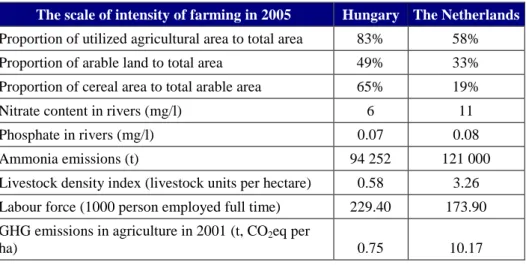
Table 1. Comparison of the main features of the Hungarian and Dutch agriculture The scale of intensity of farming in 2005 Hungary The Netherlands Proportion of utilized agricultural area to total area 83% 58%
Proportion of arable land to total area 49% 33%
Proportion of cereal area to total arable area 65% 19%
Nitrate content in rivers (mg/l) 6 11
Phosphate in rivers (mg/l) 0.07 0.08
Ammonia emissions (t) 94 252 121 000
Livestock density index (livestock units per hectare) 0.58 3.26 Labour force (1000 person employed full time) 229.40 173.90 GHG emissions in agriculture in 2001 (t, CO2eq per
ha) 0.75 10.17
Source: authors’ compilation using Eurostat data (2011)
As the biocapacity in Hungary is greater, there is a rationale for extensive farming. For the Netherlands, land is a scarce resource, so intensive farming processes are utilized. The features of the different types of farming are shown in Table 1., where it can be seen that the Netherlands has smaller scale labour force and lower agricultural labour input and the share of agricultural product- specific inputs is lower as well. The Netherlands can be a typical example for intensive agricultural practices. Hungary, using larger proportions of its land for farming, is typically conducting extensive farming. The livestock density index confirms these statements as well.
Comparing extensive farming with intensive, environmental impacts can be seen through the listed categories. Because of intensive farming, spending on fertilizers and soil improvers is 2.55 times higher, and spending on plant protection products is 5.6 times higher in the Netherlands than in Hungary. It is the same story with natural elements when considering the supply of nitrogen and phosphates, and ammonia emissions. The groundwater nitrate content can be a good proxy for evaluating the environmental damages caused by agricultural fertilizer use.
After comparing these figures, we may conclude that intensive farming processes contribute to a higher environmental burden, and it should be indicated by the biocapacity values.
Our third selected country in the analysis is Brazil, because of its transforming situation from extensive to more and more intensive agricultural practices. Over the last decades Brazil became from food importer to the world’s largest net agricultural exporter having the largest trade surplus, and crop production has been increased fivefold between 1996 and 2006 (The Eco- nomist, 2010). Agriculture belongs to the most dynamic growing sectors in the country, which accounts for 8% of the country's GDP. In 2006 Brazil was the world’s largest exporter of the following products: soy products, orange juice, coffee, beef, ethanol, sugar, tobacco, poultry, and a significant world supplier of pork, cotton, cocoa, corn and fresh fruit (Ministry of agriculture of Brazil, 2007).
Due to the pressure for production of emerging countries, the rain forest area have been transformed mostly to cropland during the last decades losing be- tween 1990 and 2005 about 8.1% of its forest cover. The agricultural land area has grown by 70% from 1961 to 2007 (Mongabay, 2010).
4. Literature review – The sustainable yield and the impact of agriculture
The calculation of the cropland and the environmental impact of agricultural practices have already appeared in many studies. Fiala (2008) argues that the environmental impact of agricultural practices does not appear properly in the ecological footprint. If there is a need for increased food production and two countries are given with different efficiency in producing food, then a new equilibrium will be reached by producing and consuming more food, but the amount of land used and its environmental impact is unknown, as the extensive or intensive way of agricultural production cannot be indicated by the footprint of food production.
There would be a need to know what the amount of sustainable yield is in order to calculate the real environmental impact of agriculture. It is highly difficult to define and measure what sustainable yield is. The agricultural yield is affected by soil quality, climate and of course management practices.
According to Ferng (2005) the agricultural management practices affect the crop yield directly through the pest control, water supply, and indirectly through the influences on soil quality. As for Doran and Zeiss (2000), soil quality is determined by natural factors, e.g. geography and climate and it can be altered by farming practices as well.
The difficulty in defining the amount of sustainable yield is also that the factors which are influencing the yield, are changing themselves as the time goes by and there might be interactions as well. The agricultural management practices can be dominant determining factors of the agricultural yield (Ferng, 2005) and the yield potential of a crop can be estimated through a long-time field study on the relationships between the yield crop and its establishes growth environment. In the study of Gilland (1979), he examined the food prospects and yield ceilings up to 2025, which was an ecologically-oriented study of the world agriculture. He calculated a sustainable amount of cropland and yield.
Harris (1996) argues that the application rate of chemical fertilizers is a representative of a whole package of agricultural practices, which characterizes a high-yield farming system. That is why we intend to show the relationship between fertilizer use and crop yield. The cumulative effects of soil erosion and degradation, water overdraft or water shortage, and the environmental impacts of fertilizer and pesticide use, these all combined undermine the yield potential
of agriculture and the sustainability conditions. The chemical and especially fertilizer use of agriculture is regarded as a major source of lake, river and groundwater pollution, loading nitrogen, phosphorus and sediment in the waterways. The agricultural chemicals detected in groundwater may be harmful for human health and the aquatic ecosystems.
Studies, examining the effect of fertilizer use on the production can be positive, but looking at the marginal rates studies have proven that in some circumstances it already became stagnant or even declining. In some regions and countries, the fertilizer use does not add much anymore to the growth of the crop yield and despite the increased use, the yield patterns are characterized by stagnating yields. The diminishing returns to fertilizer use may lead to yield ceilings in many areas. So, the trend of growing crop yields seems to be reaching its limits.
Ko et al. (1998) examined the environmental impacts of economic activities and estimated ecological footprints in five countries (Costa Rica, Korea, Mexico, the Netherlands and the United States). In general, there is a remarkable linearity between resource use and economic and agricultural production over all countries and all years, suggesting severe biophysical constraints to sustainable objectives. Ko et al. found that there is an inverse relationship between the fertilizer use and the yield per unit fertilizer use in the examined five countries.
They also pointed out that the yield per unit fertilizer use can only be increased by reducing intensity of fertilizer use and reducing the intensity of land use. It is a highly important observation.
Tong et al. (2003) carried out a research on the land use change and the relationship between crop production and fertilizer use in China, looking a greater time span, from 1961 to 1998. The overall results have shown that despite that China has increased its yield per capita dramatically, in order to feed its growing population, it has been done through a high increase in the use of fertilizer, so it increased the ecological cost. It could have been done as the government gave subsidies to farmers who produced certain extra cereal, which meant using more fertilizers in the agricultural process. The chemical fertilizer used per unit of area of total cereals has increased from 4.6 kg/ha in 1961 to more than 200 kg/ha in 1995. There was a positive relationship between 1961 and 1996 between chemical fertilizer use and cereal yields. The yield per unit fertilizer use has decreased dramatically over the years from 1961 to 1995. An
important conclusion is that there is a clear inverse relation between fertilizer input intensity and yield per unit chemical fertilizer input: the higher the fertilizer input the lower is the yield per unit fertilizer input. The decline can be explained by the saturation of fertilizer use, which is the outcome of agricultural industrialization. The soil degradation, the inefficient use of fertilizer, the improper ratios between organic and inorganic fertilizers may also explain this phenomenon.
So it can be seen that the excessive fertilizer use results no more in higher yields, but it has negative impact on the soil quality thus does not contribute anymore to higher yields, not to speak of the environmental harm it causes. The efficiency of using fertilizer has decreased because of fertilizer saturation.
5. Methodology
In this study we aimed at showing how the sustainable amount of yield could be analyzed in order to show the overshoot in agricultural production and the cropland as well. We conducted statistical regression analyses between production yields and the main determining features: temperature, precipitation and the amount of fertilizer used, in case of three countries: Hungary, the Netherlands and Brazil. Hungary was chosen to represent a country where farm- ing is mainly extensive, and the Netherlands to represent intensive farming practices. Brazil is an emerging country, having transforming agriculture.
The regression and correlations were calculated for different time periods between the years 1961 and 2007, using data from Eurostat, IFA, EEA Waterbase, FAO and KNMI Climate Explorer.
Furthermore, we constructed a marginal function for each country, representing the relation between chemical fertilizer use and yield per unit fertilizer input. We take fertilizer (per hectare) as a fairly good proxy for the group of agricultural inputs (pesticide, irrigation, mechanization), which characterize and are used by the intensive, high-yield focused agriculture. We use this proxy as historically yields are very strongly correlated with the input of fertilizers. The function can show in what extent an additional amount of fertilizer can contribute to the yield and it questions the rationale behind the excessive use of fertilizers.
In this article, we focus on the cereal production, more specifically on wheat production and yields, examining the regional impact of biophysical constraints.
We take wheat yields as a proxy for overall agricultural production and food supply, which is commonly accepted and used in the literature.
In order to specify the amount of sustainable yield, which could be used in the biocapacity calculation, we constructed a marginal curve showing the groundwater nitrate content per fertilizer unit in the case of the Netherlands.
Our assumption is that the intersection of the marginal curve of the yield and groundwater nitrate content can show the amount of fertilizer, by the use of which the yield can be sustainable.
6. Results and Discussion
6.1. Analyzing the connection between yield growth and fertilizer use
In order to reveal the sustainable amount of fertilizer used in agricultural production we have to examine other factors, which can influence the national yields. The main determining features are temperature in the growing season of the crop examined, precipitation and agricultural practices, and technology such as irrigation, fertilizer and pesticide use. The area of land under irrigation is not significant in Hungary, thus we carried out a correlation analysis on monthly average temperature (Celsius) and precipitation (mm) variables for April, May and June from 1961-2007, the total fertilizer consumption (nitrates + phosphates + potash) and yields. Wheat was chosen for our analysis, as it is the most important processed crop in Hungary and on global scale as well, it has a strategic role in feeding the humanity.
A linear regression (at 5% significance level) analysis between temperature (the sum of April, May and June), precipitation (the sum of April, May and June) was carried out on wheat yields; the yields as dependent variable and average temperature and precipitation and fertilizer use as independent variables.
In the model a third dependant variable has been taken into account, the cross effect of the temperature and precipitation. These might influence each other, and as for the yields, in case of higher temperatures the water demand increases in the growing season, which impacts the growth of the crop, thus the yield values. Calculating the regression model, the break points of the trend line in
fertilizer use were taken into account, therefore in the case of Hungary the analysis on three time intervals was conducted.
The main goal of this analysis is to point out the ecologically optimal level of using fertilizers and to define the switching point when the amount of fertilizer begins to reduce the yields or not increase them at all, namely: the level of sustainable yield.
I. Hungary
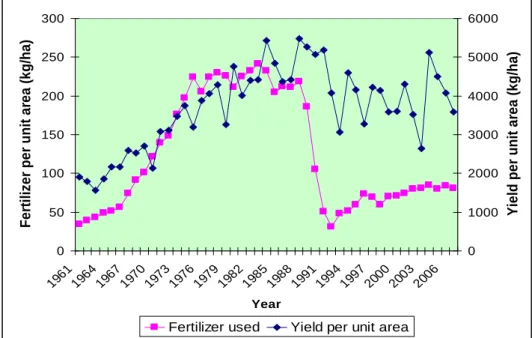
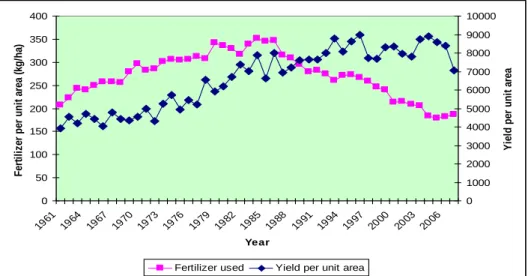
The total fertilizer consumption (kg/ha) in Hungary from 1961 to 2007 has drastically changed two times during this period, it is indicated on Fig. 1.
Because of the breaking of the trend, we calculated for three periods the regression functions, considering the break points of the trends as the end point of a period and a starting point of another. It can be seen that in the first period from 1961 to 1974 the fertilizer used in production has exceedingly increased and the wheat yield followed the growth of the fertilizer use with a bit of time lag, but in a liner growing trend.
0 50 100 150 200 250 300
1961 1964
1967 1970
1973 1976
1979 1982
1985 1988
1991 1994
1997 2000
2003 2006 Year
Fertilizer per unit area (kg/ha)
0 1000 2000 3000 4000 5000 6000
Yield per unit area (kg/ha)
Fertilizer used Yield per unit area
Figure 1. Total wheat production yield per unit area and chemical fertilizer used in Hungary
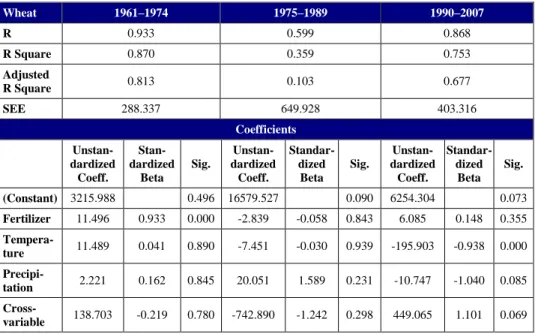
Having a look at the regression results for this period, significant correlation can be detected only between wheat yields and the amount of fertilizer, which shows a very strong positive connection (r = 0.930, p = 0.000). The regression analysis resulted, that fertilizer use has a positive effect on wheat yields between 1961 and 1974.
Table 2. Regression analysis results on wheat production in Hungary, in three time periods
Wheat 1961–1974 1975–1989 1990–2007
R 0.933 0.599 0.868
R Square 0.870 0.359 0.753
Adjusted
R Square 0.813 0.103 0.677
SEE 288.337 649.928 403.316
Coefficients Unstan-
dardized Coeff.
Stan- dardized
Beta Sig.
Unstan- dardized Coeff.
Standar- dized
Beta Sig.
Unstan- dardized
Coeff.
Standar- dized
Beta Sig.
(Constant) 3215.988 0.496 16579.527 0.090 6254.304 0.073
Fertilizer 11.496 0.933 0.000 -2.839 -0.058 0.843 6.085 0.148 0.355 Tempera-
ture 11.489 0.041 0.890 -7.451 -0.030 0.939 -195.903 -0.938 0.000 Precipi-
tation 2.221 0.162 0.845 20.051 1.589 0.231 -10.747 -1.040 0.085 Cross-
variable 138.703 -0.219 0.780 -742.890 -1.242 0.298 449.065 1.101 0.069
In the next period from 1975 to 1989 it can be observed that the fertilizer use has stagnated around the level of 200 kg/ha, and at the time of transition it has drastically decreased due to the structural changes and the sudden rise in fertilizer prices. As for the yield values, it kept on increasing with a modest rate on average, but looking at Fig. 1, we can see that there were great variations in the examined years. So, it can be concluded that in this time spell there were other significant determining factors concerning the yields. So, there is a need to analyze further the variation of the wheat yield and the influencing factors.
The regression analysis confirms this observation, as during this period the variables only explains the 35.9% of variation, so our model has a very weak goodness-of-fit. Even the temperature, precipitation and cross effect variables are not enough to explain the deviation of the yield values. Additionally, in this time interval we can observe, that fertilizer use and temperature and cross
variable show negative connection with wheat yields. On the whole we can conclude, that from 1975 to 1989 wheat yields are not affected (or negatively influenced) by fertilizer overuse, which also corresponds with our assumption, namely: there is a point where fertilizer use does not contribute any more to increasing the yields and it can even decrease the yields.
As of 1990, a drastic break can be observed in the trend of fertilizer use (Figure 1) the amount of fertilizer has been reduced by one third, due to the price pressure around the time of the political transition and structural changes in the economy. In time interval 1990-2007, wheat yields were negatively influenced the most by the temperature and secondly by precipitation and at least by fertilizers. Although, in the first two examined period the total wheat yield and the yield per unit have been increasing, it can be revealed in our analysis that the yield per unit fertilizer used has been in deed decreasing.
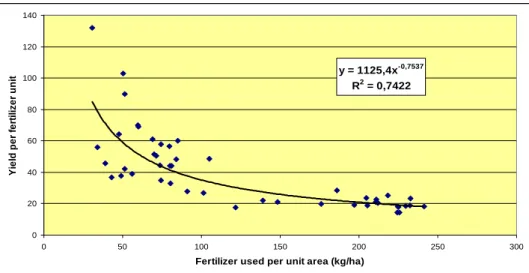
The relation between the fertilizer used per unit area (kg/ha) and the yield per fertilizer unit have also been analyzed, shown on Figure 2.
y = 1125,4x-0,7537 R2 = 0,7422
0 20 40 60 80 100 120 140
0 50 100 150 200 250 300
Fertilizer used per unit area (kg/ha)
Yield per fertilizer unit
Figure 2. The relation between chemical fertilizer use and yield per unit fertilizer input in Hungary
The relation, which is depicted, can be actually viewed as a marginal curve of fertilizer use. There is a clear inverse relationship between the amount of fertilizer used in the Hungarian agricultural production and the yield per fertilizer unit. The more amount of fertilizer is used the lower is the yield per
fertilizer unit. This result confirms our hypothesis according to which, there is a saturation point of the soil and the additional fertilizer input decreases the marginal yields, and subsequently the ecologically sustainable yield is where the saturation point meets the marginal function.
II. The Netherlands
In case of Netherlands the fertilizer used and the yield per unit area can be seen on Figure 3. Having a look at the fertilizer using trends, it can be seen that there is a breaking point in the trend around 1985. Until that time the chemical fertilizer used shows an explicitly growing trend, from 1960 the use of fertilizer has been increasing until 1984, which is followed by the continuous growth of the wheat yields as well. There was a peak in agricultural fertilizer use around the year 1985, and after it the fertilizer use has been steadily decreasing.
Because of this major change in agricultural practice, we have divided the examined period into two parts by the break point of fertilizer use.
From 1961 to 1984 the positive effect of fertilizer use is absolutely detected by regression analysis, in addition, fertilizer use is the key variable in the model.
So, the amount of fertilizer used determined very significantly the increase of yields.
0 50 100 150 200 250 300 350 400
1961 1964
1967 1970
1973 1976
1979 1982
1985 1988
1991 1994
1997 2000
2003 2006 Year
Fertilizer per unit area (kg/ha)
0 1000 2000 3000 4000 5000 6000 7000 8000 9000 10000
Yield per unit area
Fertilizer used Yield per unit area
Figure 3. Total wheat production yield per unit area and chemical fertilizer used in the Netherlands
Looking at the yield trends after 1985, it can be observed that in spite of the decrease in fertilizer use, the yield values did not decrease, they kept on growing with a smaller growth rate than before, after 1995 the variation of the yields started to grow. There were years with higher yield, but a stagnating trend can be observed, which could turn easily and not surprisingly into a decreasing trend. This phenomenon can be explained by the saturation of the soil, that even less amount of fertilizer can result in the same level of yield, and another fact, is that it is not only the fertilizer use which determined the yield.
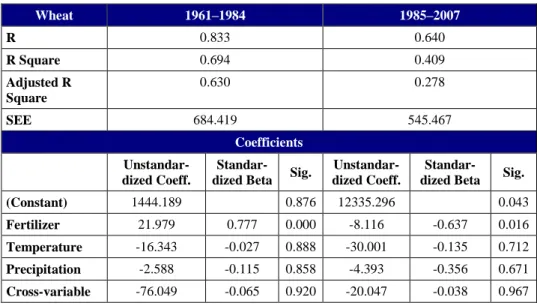
As for the regression results for the second time period examined, after 1984, it is shown in Table 3, that the goodness-of-fit of the model decreases, and fertilizer use have a significantly negative impact on yields.
Table 3. Regression analysis results on wheat production in the Netherlands, in two time periods
Wheat 1961–1984 1985–2007
R 0.833 0.640
R Square 0.694 0.409
Adjusted R Square
0.630 0.278
SEE 684.419 545.467
Coefficients Unstandar-
dized Coeff.
Standar-
dized Beta Sig. Unstandar- dized Coeff.
Standar- dized Beta Sig.
(Constant) 1444.189 0.876 12335.296 0.043
Fertilizer 21.979 0.777 0.000 -8.116 -0.637 0.016
Temperature -16.343 -0.027 0.888 -30.001 -0.135 0.712 Precipitation -2.588 -0.115 0.858 -4.393 -0.356 0.671 Cross-variable -76.049 -0.065 0.920 -20.047 -0.038 0.967
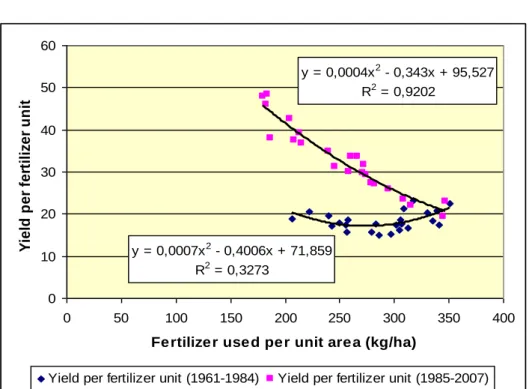
The relation of the fertilizer input intensity and the yield per fertilizer unit shows us an inverse relation, but because of the breaking of the trend and drop in fertilizer use, two branches can be seen when illustrating this relation (Figure 4.).
y = 0,0004x2 - 0,343x + 95,527 R2 = 0,9202
y = 0,0007x2 - 0,4006x + 71,859 R2 = 0,3273
0 10 20 30 40 50 60
0 50 100 150 200 250 300 350 400
Fertilizer used per unit area (kg/ha)
Yield per fertilizer unit
Yield per fertilizer unit (1961-1984) Yield per fertilizer unit (1985-2007)
Figure 4. The relation between chemical fertilizer use and yield per unit fertilizer input in the Netherlands
In case of the Netherlands, we found it important not only to look at the yield of wheat, but also examining the yield of potato can give us additional information, as the vegetable and potato production is more typical and of greater scale in the Netherlands than the wheat production.
From the results of the regression, we can conclude mainly the same as in case of the wheat production, as in the first period the fertilizer use is a significant driving force of the yield values. The cross effect of the temperature and precipitation is dominant here. During the second time span the significance of the fertilizer drops, the coefficient becomes negative.
Table 4. Regression analysis results on potato production in the Netherlands, in two time periods
Potato 1961–1984 1985–2007
R 0.791 0.334
R Square 0.626 0.112
Adjusted R Square 0.548 -0.086
SEE 2836.432 2268.702
Coefficients Unstandar-
dized Coeff.
Standar- dized Beta Sig.
Unstan- dardized Coeff.
Standar- dized Beta Sig.
(Constant) -50073.097 0.200 29721.339 0.223
Fertilizer 72.681 0.686 0.000 -5.609 -0.130 0.665
Temperature -1163.953 -0.510 0.024 31.021 0.041 0.927 Precipitation -151.768 -1.793 0.019 -18.442 -0.440 0.668 Cross-variable 7193.805 1.637 0.031 886.017 0.494 0.662
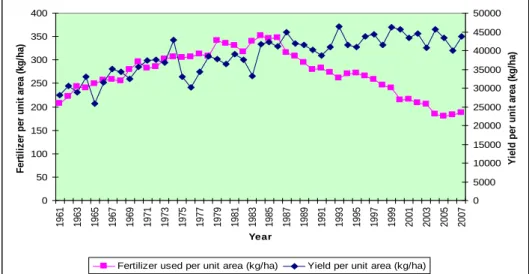
The Figure 5 showing the fertilizer use in potato production and the yields per unit area, indicates similar trends as in the wheat production. After 1985, the variance of the potato yields is greater, where seasonal impacts can play a major role.
0 50 100 150 200 250 300 350 400
1961 1963 1965 1967 1969 1971 1973 1975 1977 1979 1981 1983 1985 1987 1989 1991 1993 1995 1997 1999 2001 2003 2005 2007
Year
Fertilizer per unit area (kg/ha)
0 5000 10000 15000 20000 25000 30000 35000 40000 45000 50000
Yield per unit area (kg/ha)
Fertilizer used per unit area (kg/ha) Yield per unit area (kg/ha)
Figure 5. Total potato yield per unit area and chemical fertilizer used in the Netherlands
III. Brazil
Brazil is the third country under examination of its wheat production, which has been permanently growing over the last decades. In Brazil we can observe (Figure 6.) an exponential trend in chemical fertilizer use and wheat yields, due to the permanently increasing agricultural area from 1961 to 2007. As there is no significant breaking point of the trend, we do not need to split the time interval.
0 5 10 15 20 25 30 35 40 45
1961 1964 1967 1970 1973 1976 1979 1982 1985 1988 1991 1994 1997 2000 2003 2006
Year
Fertilizer used per unit area
0 500 1000 1500 2000 2500 3000 3500 4000
Yield per unit area
Fertilizer used per unit area (kg/ha) Yield per unit area (kg/ha) Figure 6. Total wheat production yield per unit area and chemical fertilizer used
in Brazil
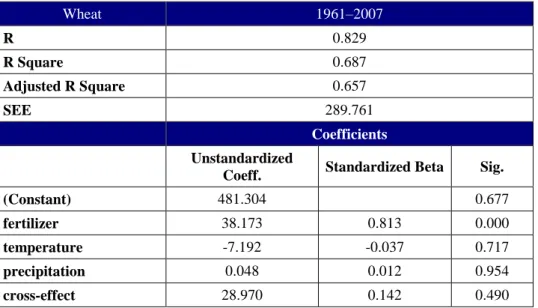
The strong relationship between fertilizers and wheat yields is absolutely demonstrated by the regression analysis. The fertilizer is the major factor and cause in the increase of the yields.
Table 5. Regression analysis results on wheat production in Brazil
Wheat 1961–2007
R 0.829
R Square 0.687
Adjusted R Square 0.657
SEE 289.761
Coefficients Unstandardized
Coeff. Standardized Beta Sig.
(Constant) 481.304 0.677
fertilizer 38.173 0.813 0.000
temperature -7.192 -0.037 0.717
precipitation 0.048 0.012 0.954
cross-effect 28.970 0.142 0.490
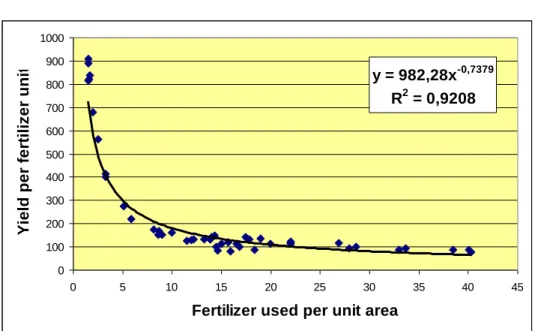
Although the constant rise in fertilizer applied, the decreasing marginal curve is illustrating the Brazilian fertilizer use as well (Figure 7.), from which it can be forecasted that after some point the fertilizer use will not be able to contribute to the yield growth and decreasing trends might occur. Today, the Brazilian wheat production and yields are growing, but the effective fertilizer use should be considered in the future.
y = 982,28x-0,7379 R2 = 0,9208
0 100 200 300 400 500 600 700 800 900 1000
0 5 10 15 20 25 30 35 40 45
Fertilizer used per unit area
Yield per fertilizer unit
Figure 7. The relation between chemical fertilizer use and yield per unit fertilizer input in Brazil
6.2. Proposal for defining the sustainable yield
As mentioned above, the paper aims at proposing a modification as well, concerning the yield factors in the calculations of biocapacity and at offsetting the distortion stemming from different agricultural practices in different countries. Thus, the aim of the analyses was to find out the relations effecting the agricultural yield, and to find out how the amount of sustainable yield can be defined.
In order to represent the real biological capacity, we have to take into consideration primarily the consequences of applied agricultural practices during the calculation process of the biocapacity. The increased yield values show the real amount of land required, but not what the sustainable amount would be and they generate environmental load. The yield factor represents the national yield relative to global average yields, which does not include the harmful impacts of fertilizer and pesticide use or the animal waste. So, the yield factor applied in the calculation of the biocapacity does not show the sustainability limits.
We reckon, that there is a need for modifying the calculation process of the biocapacity, taking into account the polluting features of agriculture.
Though intensive agriculture gives higher yields at the moment, in the following decades harmful effects such as soil degradation, soil acidification, groundwater pollution, etc. are liable to become significant.
These pollution-related damages do not appear in the biocapacity calculations, but it is important to take them into account and there is a need to quantify the amount of sustainable yield through its influential factors.
In the previous section it has been investigated, that fertilizer applied has the greatest impact on yields, until the soil becomes oversaturated with nitrate, phosphate and other elements, and after the point fertilizer use begin to be ineffective for yields and degrade the soil, groundwater and surface water.
Therefore, we suggest, that the national yield factors should be recalculated through the caused damages of over-fertilized soil. As the nitrate contamination nowadays belongs to the most crucial problems of soil conservation, we would thus propose the determination of sustainable yield in terms of harmful nitrate content of soil. The modification of yield factor should include the level of national sustainable yield correlated to real yields expressing whether the extent of yields is in accordance with the sustainability of soil.
Figure 8. shows the yield per fertilizer unit and the groundwater nitrate content per fertilizer unit in the case of the Netherlands. The amount of fertilizer used is within the sustainability limits where the groundwater nitrate content per fertilizer unit is lower than the yield per fertilizer unit. The maximum point of the fertilizer which can be used within the sustainability limits is where the intersection of the two functions is. Thus, it can be specified in case of each country, what the amount of fertilizer to be used could be, the use of which does not exceed the regenerative capacity of the soil. From the amount of fertilizer, the amount of the sustainable yield could be defined.
To put it in numbers, in the case of the Netherlands, the amount of fertilizer to be used in agriculture is 215 (kg/ha). Calculating the amount of sustainable wheat yield the maximum value of it can be 8100 (kg/ha), this value could be used in the biocapacity calculation, thus it indicates the real land area which could be used taking into account the biophysical limits.
y = -0,0734x2 + 1,5865x + 17,674 R2 = 0,3038
y = -1,1615x + 46,921 R2 = 0,8765
0 10 20 30 40 50 60
180 182 184 186 205 208 214 215 239 246 258 261 266 271 272 274 279 282 294
Fertilizer used per unit area
Yield per fertilizer unit
0 5 10 15 20 25 30 35 40
Groundwater nitrate content per fertilizer unit
Yield per fertilizer unit Groundwater nitrate content per fertilizer unit Figure 8. The yield per fertilizer unit and the groundwater nitrate content per
fertilizer unit, in case of the Netherlands (Source: EEA Waterbase, 2010 and IFA Database, 2010)
Table 6 shows, how the use of the sustainable yields modify the value of the biocapacity, which this way shows a more realistic picture and can be a good indicator of the sustainable amount of land.
Table 6. Modification of the yield factor
2005 The Netherlands
Wheat yield (t/ha) 8.6
Yield factor of wheat 3.03
Sustainable yield (t/ha) 8.1
Modified yield factor of wheat 2.85
7. Conclusions
As the population of the world grows there will be an increasing demand for greater agricultural output, but this demand conflicts with the claim for a sustainable agriculture. This study has shown the importance of defining the sustainable yield, both from ecological and economical point of view.
In calculating the ecological footprint, we conclude that the structural differences in agriculture have a great impact on the calculation of biocapacity, which indicates rethinking the way this indicator has been estimated so far. We suggest that the long-term environmental impacts of intensive agricultural practices should be built into the ecological footprint model - in this case in the national yield factors should be modified when calculating the biocapacity of a country, and this way it can represent the dominant agricultural structure and its environmental impacts of a country.
The fertilizer use and its marginal contributions appeared to be a great proxy in order to evaluate the impact and efficiency of its use. It is indicated from the results that there are countries where there is no more rationale in the excessive use of fertilizers.
As for the sustainable yield amount, we have shown one possible way how it can be estimated and proposed a modification of the yield factor. Using the sustainable amount of yield in the calculation of the biocapacity in case of cropland is heavily needed. It should be indicated what the biocapacity of a country is, which is within the sustainability limits and could be used for agricultural production without making irreversible harms to the ecosystem.
References
AER (2008): Agricultural Economic Report 2008, Report 2008-030, Agri- cultural Economics Research Institute, The Hague, The Netherlands, ISSN 0924-0764, http://www.lei.dlo.nl/publicaties/PDF/2008/2008-030.pdf
Doran, J. W., Zeiss, M.R. (2000): Soil health and sustainability: managing the biotic component of soil quality. Applied Soil Ecology 15, 3–11.
EEA Waterbase, Groundwater data (2010): http://www.eea.europa.eu/data- and-maps/data/ waterbase-groundwater-6, Eurostat, 2011, Farm input consump-
tion http://epp.eurostat.ec. europa.eu/portal/page/portal/product_details/da- taset?p_product_code=AEI_PS_INP
FAO Database (2010): http://faostat.fao.org/
Ferng, J. (2005): Local sustainable yield and embodied resources in ecological footprint analysis — a case study on the required paddy field in Taiwan, Ecological Economics 53, 415–430
Fiala, N. (2008): Measuring sustainability: Why the ecological footprint is bad economics and bad environmental science. Ecological Economics, Volume 67, Issue 4, 519–525
Gever, J., Kaufmann, R., Skole, D. and Vörösmarty, C. (1991): Beyond Oil:
The threat to Food and Fuel in the Coming Decades. University Press of Colo- rado, CO.
Global Footprint Network (2010): http://www.footprintnetwork.org/en/ in- dex.php/GFN/page/footprint_for_nations/
Gilland. B. (1979): The Next Seventy Years: Population. Food and Resources. Abacus Press, Southborough, UK.
Harris, J. M. (1996): World agricultural future: regional sustainability and ecological limits. Ecological Economics 17, 95–115.
IFA Database (2010): http://www.fertilizer.org/ifa/ifadata/search
Kelemen, E., Pataki, Gy., Podmaniczky, L. (2008): Farming and Ecosystem Services in an Environmentally Sensitive Area (Homokhátság). In: E. Kovács–
Láng, Gy. Kröel–Dulay, S. Barabás (eds): The Kiskun LTER: Long-term eco- logical research in the Kiskunság, Hungary. MTA ÖBKI, Vácrátót. p.21–22.
KNMI Climate Explorer (2010): http://climexp.knmi.nl
Ko, Y.-Y., Hall, C. A. S., López Lemus, L. G. (1998): Resource use rates and efficiency indicators of regional sustainability: an examination of five countries.
Environmental Monitoring and Assessment 51, 571–593.
MARD – Ministry of Agriculture and Rural Development (Hungary) (2009):
The Hungarian Agriculture and Food Industry in Figures.
http://www.fvm.gov.hu/doc/upload/ 201001/english_2009.pdf
Marjainé Szerényi, Zsuzsanna, Sándor Kerekes, Zsuzsanna Flachner†, Simon Milton (2011a): The possibility of the economic evaluation of ecosystem ser- vices described through a domestic case study. pp.: 63–74, in: Nagy, Gergő Gábor, Kiss, Veronika (szerk.): Borrowing services from nature. Methodologies of ecosystem services based on Hungarian case studies. Budapest, CEEweb.
ISBN 978-963-87218-7-7.
Marjainé Szerényi, Zsuzsanna, Ágnes Zsóka, Judit Rákosi (2011b): Imple- mentation of Water Framework Directive Obligations in Hungary: Estimating Benefits of Development Activities in Two Pilot Areas. P. 301–315, In: Burritt, R.; Schaltegger, S.; Bennett, M.; Pohjola, T.; Csutora, M. (Eds.): Environmental Management Accounting and Supply Chain Management, Series: HYPERLINK
“http://www.springer.com/series/5887” Eco-Efficiency in Industry and Science, Vol. 27, 1st Edition, 2011, XI, 338 p., ISBN: 978-94-007-1389-5, June 2011.
Marjainé Szerényi, Zsuzsanna, Nikolett Eszlári (2011): How to take into ac- count of ecosystem services of various habitats in integrated cost-benefit analy- sis, Regional and Business Studies (2011) Vol 3 Suppl 1, 299–306, Kaposvár University, Faculty of Economic Science, Kaposvár. ISSN: 2061-2311
Martinez-Alier, J. (1991): Ecological Economics: Energy, Environment and Society. Blackwell Publishers, Oxford.
Mongabay, (2010): rainforests.mongabay.com/deforestation
Norton, G. W., Alwang, J. (1993): Introduction to economics of agricultural development, McGraw–Hill, Toronto
The Economist (2010): The miracle of the cerrado http://www.econo- mist.com/node/16886442
Tilman, D. G., Cassman, K. G., Matson, P. A., Naylor, R., Polasky, S.
(2002): Agricultural sustainability and intensive production practices, Nature, vol. 418, Nature Publishing Group
Tong, C., Hall, C. A. S., Wang, H. (2003): Land use change in rice, wheat and maize production in China (1961–1998). Agriculture, Ecosystems and Environment 95, 523–536.
Wackernagel, M., Monfreda, C., Schulz, N. B., Erb, K.-H., Haberl, H., Krausmann, F. (2004): Calculating national and global ecological footprint time series: resolving conceptual challenges. Land Use Policy 21, 271–278.
WHO (1990): Public Health Impacts of Pesticides Used in Agriculture (WHO in collaboration with the United Nations Environment Programme, Geneva, 1990).
