S
USTAINABLEC
ONSUMPTION: F
ROME
SCAPES
TRATEGIEST
OWARDSR
EALA
LTERNATIVESMária Csutora, Zsófia Mózner and Andrea Tabi
Corvinus University of Budapest, Fővám tér 8., 1093 Budapest, Hungary E-mail: maria.csutora@uni-corvinus.hu
Better sustainability policy is supposed to lead to better sustainability performance. Nonetheless, recent research predicts further growth of the ecological footprint and stable ecological deficit in Europe and North America despite their impressive policy efforts (Lenzen et al. 2007) [1]. Similarly, individual strategies result in somewhat reduced load for committed consumers, but this reduction cannot offset the total impact of the socio-economic configuration: consumers in higher income countries tend to pollute more.
Committed consumers „offset“ a part of their environmental load by carrying out green purchases. A radical change assumes a change in lifestyles (Shove, 2004) [2].The conference paper is the first step of the study that aims at measuring the significance of attitude elements as compared to the significance of the socio-economic system on different elements of consumption and environmental aspects. This paper focuses on measuring the ecological footprint impacts of consumption in different product groups as well as in different income groups of the society.
The research is part of the “Sustainable Consumption, Production and Communication” Project financed by the Norwegian Fund.
I. INTRODUCTION
Countries with the best sustainability policies and highest ESI rankings ‘boast’ the largest ecological footprint. Better sustainability policy is supposed to lead to better sustainability performance. Nonetheless, recent research predicts further growth of the ecological footprint and stable ecological deficit in Europe and North America despite their impressive policy efforts (Lenzen et al. 2007) [1]. Similarly, individual strategies result in somewhat reduced load for committed consumers, but this reduction cannot offset the total impact of the socio-economic configuration: consumers in higher income countries tend to pollute more. A radical change assumes a change in lifestyles (Shove, 2004) [2]. Committed consumers „offset“ a part of their environmental load by carrying out green purchases. The study aims at measuring the significance of attitude elements as compared to the significance of the socio-economic system on different elements of consumption and environmental aspects. (See Figure 1)
The environmental impacts of different social segments of Hungarian consumers are compared to each other and this way we hope to separate the impact of environmental factors (e.g. climate in defining heating requirements), income, and lifestyle elements.
At the first stage of our research we have calculated the ecological footprint of consumption by income deciles, as income is perhaps the most important factor of the socio-economic configuration. Thus we will such how much is the difference in ecological footprint between rich and poor that should be compensated by higher environmental consciousness of high income groups. Our hypothesis is that individual attitude is able to somewhat modify, but not able to offset the difference in income-defined ecological footprint totally.
The impact of the socio-economic configuration
The impact of the individual’s attitude Environmental load from consumption
Ecologically committed consumers
Consumers following the normal practice
FIGURE 1: THE IMPACT OF THE INDIVIDUAL’S ATTITUDE ON THE ENVIRONMENTAL LOAD
II. MEASURINGTHEECOLOGICALFOOTPRINTOFCONSUMPTION In order to measure the sustainability, the human impact on the natural capital, a proper indicator is needed. Finding and developing such indicator has been the research subject of many scientists, so this issue has a rich literature from the last two decades.
The very early researches focused on the calculation of the number of population, which can be sustained by a defined area. The question of how much nature people use to sustain themselves, was first raised by Wackernagel and Rees (1996) [3], and the breakthrough came with their study, where they introduced a new method and measure – the Ecological Footprint.
The definition of the Ecological Footprint is the following: ‘the Ecological Footprint is a resource accounting tool that measures how much biologically productive land and sea is used by a given population or activity, and compares this to how much land and sea is available, using prevailing technology and resource management schemes’ (Wackernagel et al., 1996) [3]. It measures human demand on nature, by assessing how much biologically productive land and sea area is necessary to maintain a given consumption pattern. As a result the physical areas are expressed in so-called global hectares, making the comparison between regions, nations easier.
In this analysis the unsustainable populations have a larger ecological footprint than the land available for them. The method also calculates with the waste flows of human production and activity, distinguishing between biological waste, toxic materials and wastes of materials which are directly sent to landfills. Treating the water usage in the calculations is a critical issue as well.
It is important not to mix up the Ecological Footprint method and result with the carbon- footprint calculations. They are not the same, the Ecological Footprint calculations use the data on carbon dioxide emissions. The importance of the carbon dioxide data and the
calculated carbon footprint lies in the fact that it contributes to the easier understanding and use of Ecological Footprint. The area based carbon-footprint becomes comparable to the demands of the productive land, and thus making the so-called spill-over effects more visible.
As for the ecological footprinting method, today there exist two different approaches.
The so-called ‘compound’ footprinting introduced by Wackernagel et al.; and the so-called
‘component-based’ footprinting of Simmons et al. (2000) [4]. The ‘component-based’
method reflects a bottom-up analytical approach, thus it focuses on the measurement of smaller groups, sub-regions, organisations.
The consumption of goods and services results in the direct and indirect degradation of the environment. The indirect environmental impact is an impact that occurs during the production process or waste treatment of the product, thus not during the use of the product by a consumer. We consider that the examination of the indirect effects should be brought into prominence; the reason is that there have been only a few studies which have comprised the indirect consequences in their analyses.
Bicknell et al. (1998) [5] were the first to introduce generalised input– output analysis, incorporating it into the method of the ecological footprint calculations. Lenzen and Murray (2001) [6] revised the method of Ecological Footprint (in the following EF). They have made modifications on the original concept in order to make it suitable for input−output analysis. Thus a regional, disturbance- based approach is taken in their study, including actual Australian land use and emissions data.
Wackernagel et al. (2006) [7] have also shown a combination of Ecological Footprint accounting with monetary input–output analysis.
Tukker and Jansen (2006) [8] were those who have worked out a review on the studies focusing on extended environmental impacts, using the methodology of the input-output analyses. They concluded that the major part of environmental impacts is associated with the following consumption categories, namely the housing, transport and food. These categories seem to have the major influential force.
Kerkhof et al. (2008) [9] came up with a novelty in their analysis on the household expenditures of the Netherlands, because they were the first to make a consistent analysis of the expenditure elasticities of the four impact categories. This analysis allows the examination of the elasticities by regression analyses and a comparison regarding the product level. The study deals with exclusively household expenditures as household characteristics are the major drivers and explanatory variables in energy requirements and environmental impact (Lenzen et al. 2004 [10], Pachauri, 2004[11]).
Using the top-down technique of the input-output analyses, the first step of Kerkhof et al. was the quantification of the impact intensities of household goods and services. After it the results came from the combination of household consumption data. The indirect impact intensities were calculated by means of environmentally extended input-output analysis.
The study analysed the annual expenditures on six aggregate product groups by equivalent expenditure deciles, showing that high-expenditure households spend more money on
’development, leisure and traffic’ and on ‘house’, but with the growing expenditure volume, the demand on food relatively decreases, thus it is important to examine the consumption patterns changing by the expenditure level.
In a recent study of Druckman and Jackson (2009) [12], the authors have put up the research question that how much CO2 is attributable to the different kinds of needs and
desires and to what extent decoupling is occurring between household expenditures and CO2 emissions. They aimed at defining the carbon footprint of different segments of the UK’s society compared to each other. Taking the direct and indirect consumption (embedded in trade) into account as Kerkhof et al. (2008) [9] did, they have worked out a quasi-multi-regional input–output (QMRIO) model. It is a modification of the multi- regional model, already used before in other studies, but it allows bigger accuracy, transparency and a bigger scale of sectors being taken into the model. Because of the rebound effect, it was vital to take into account the overall expenditure on good and services beyond the country borders as well.
The authors give a deep insight into the methodology of calculating embedded CO2 emissions. It is based on a two-region model (Proops et al, 1993) [13] and Jackson et al.
(2007) [14] with modifying the CO2 intensity of imported goods, by calculating it for each importing partners in 12 world regions.
The results have shown that though the proportion of embedded goods have risen slightly, the embedded CO2 emission through imports have significantly increased from 1990. The great proportion of embedded goods highlights the importance of examining the cross-sector and cross-country impacts of consumption. It is worthy of note, that the quarter of the emission of an average household stems from the recreation and leisure (including personal aviation), the most well-off Supergroup having the greatest carbon footprint.
Quite a few criticisms have been raised in the literature concerning the method of the Ecological Footprint. The major objections are related to the measurement and the calculation of the ecological footprint. Though all these criticisms, in many studies and analyses it has already been shown that the Ecological Footprint concept is an appropriate indicator for capturing the relation between consumption patterns and environmental impact.
III. THE CALCULATION METHOD USED IN THE HUNGARIAN CASE STUDY
In this study we have calculated the ecological footprint of Hungarian households’
consumption as well as the ecological footprint intensities by using the method of input- output analysis as suggested by Bicknell et al. and Wiedmann et. al. This method quantifies the direct and indirect ecological footprint of different consumption categories.
By following their approach we are able to compute the total effects of each product or service groups on the ecological footprint. Thus, we can move forward from holding industries responsible for all ecological impacts they cause, and will be able to face the reality that industries use the environment in order to produce products for us. Final consumers must hold responsibilities for the impacts their consumption induce.
Direct impacts refer to using of a product by the consumer and it is characterised by direct intensity vector. Indirect impact is defined as the impact that occurs during the production process or waste treatment of a product (Moll et al., 2008).
The total intensity vector expresses the direct and indirect impacts of industrial activities (total ecological footprint per expenditure). Basically, it represents the entire industrial supply chain of deliveries from industry to industry up to the final demand, where the households purchase the product (Wiedmann et al., 2005). E.g. ecological impacts of
tourism industry include not only the direct impacts, which are sometimes minimal, but also the ecological footprint of travelling or the laundry services.
Calculation follows the following steps:
1. Production of the environmentally extended input-output table that complements the industry transaction matrix A with industry aggregate ecological footprint data. It requires assigning all ecological footprint data to industrial sectors using data provided by the Ecological Footprint Network as well as cross coding tables. At this step we used the CORINE database to assign built-environment footprint to industries and households. We also used OECD, Eurostat and COICOP cross- coding tables to allocate products to industries.
2. Calculation of the physical coefficient vector.
3. Calculation of the Leontief inverse matrix, (I-A)-1, using the industry by industry symmetric input-output matrix from the EUROSTAT database. We used 2005 data as it was the latest available year for input-output as well as Ecological Footprint data.
4. Calculation of the total intensity vector capturing both direct and indirect impacts 5. Calculation of total requirements by households by multiplying the diagonalised
intensity vector and the final demand by household vector.
6. Reallocation of final demand into consumption categories using KSH statistics, COICOP tables and TEAOR.
7. Adding direct ecological impacts of household to the table. Those impacts are not present at the market, so they are not captured by the transaction matrix. They include direct greenhouse gas emission from fuel burning and built up land.
8. Calculation of the EF/expenditure vector for different product groups.
9. Calculation of total requirement by income deciles. At this step we combined KSH consumption by income deciles statistics with the EF/expenditure vector.
IV. RESULTS
Fig.2. shows the ecological footprint of households by product groups. Total household consumption includes the direct consumption of built land and fuels for housing, built land and fuels for private transport and all other consumption of households. The demand categories with the highest ecological footprint are:
- food which is gives almost half of the total ecological footprint of Hungary, - direct energy use by households (9% utilities and 9 % direct CO2 emission by
individual fuel use or travelling)
- and services, which includes hotels, restaurants and public services.
The ecological footprint of food is dominant in the EF of each country, but it is still very high in Hungary as compared to other countries. This phenomenon requires further research, particularly because the consumption of animal products, a potential major driver in high EF, stays bellow the Western European average.
FIG 1:ECOLOGICAL FOOTPRINT OF CONSUMPTION
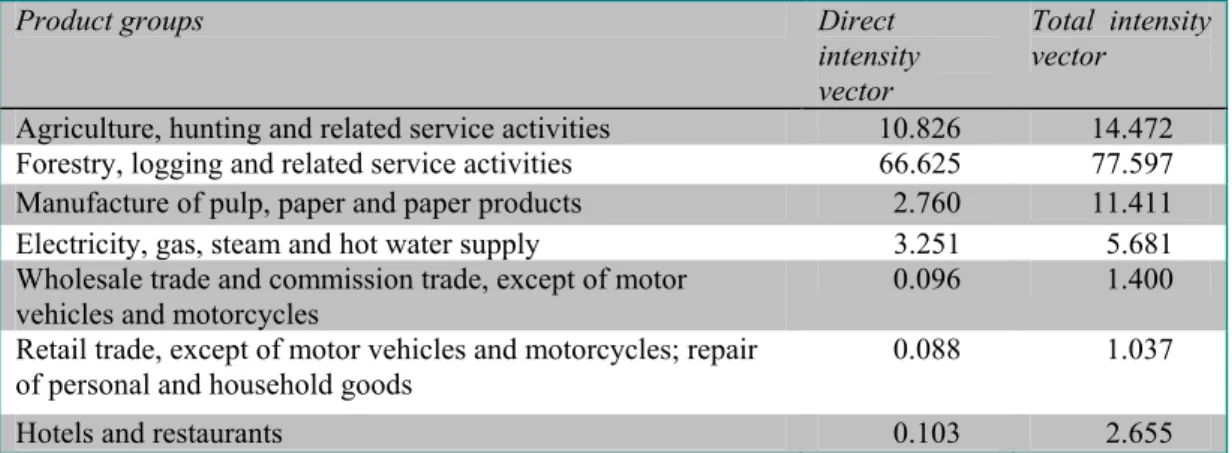
Comparison of direct and total intensities
Total intensity vector expresses the ratio of the spending of one unit of national currency on a product and the ecological footprint .
Consumption activities with the highest total footprint are agriculture, forestry and paper products, utilities and services. The cause of the high ecological footprint of forestry and wood products can be explained with the extensive nature of forestry due to the large lifecycle of trees. That is we need very large areas in order to produce 1 m3 wood annually. It does not equal saying forestry is polluting, though. Actually we must be happy if we have a high percent of forested land in the country. Using wood products is acceptable as soon as those are produced by sustainable forestry practices. So we have to be very careful with interpreting direct and total intensity vectors.
The difference between direct and total impacts shows the environmental impacts that happen in the value added chain. This is especially high in the hotels and restaurants sector and in the services sector. These sectors are traditionally regarded as environmentally friendly ones, but we should rethink this interpretation. Basically, service industries are at the end of the value-added chain, hence we tend to think of these industries as ones less harmful for the environment, but detailed analysis shows the opposite. The total ecological
footprint of the hotel and restaurant industry, for example, is 26 times higher than their direct footprint and this number does not capture the impact of individual travelling to these institutions. The ecological footprint per expenditure is the 3rd highest here of all industries.
Product groups Direct
intensity vector
Total intensity vector
Agriculture, hunting and related service activities 10.826 14.472 Forestry, logging and related service activities 66.625 77.597 Manufacture of pulp, paper and paper products 2.760 11.411 Electricity, gas, steam and hot water supply 3.251 5.681 Wholesale trade and commission trade, except of motor
vehicles and motorcycles
0.096 1.400 Retail trade, except of motor vehicles and motorcycles; repair
of personal and household goods
0.088 1.037
Hotels and restaurants 0.103 2.655
TABLE 1:DIRECT VERSUS TOTAL IMPACTS OF INDUSTRIES
HU
Ecological footprint/expenditure
Gha/HUF 10-6 Food and non-alcoholic beverages 8.6
Alcoholic beverages 1.7
Clothing and footware 3.4
Housing and utilities 4.2
Furniture and household 7.3
Healthcare 1.3
Transport 5.3
Telecommunication 0.4
Recreational and cultural services 1.7
Education 1.4
Catering and accommodation services 5.6 Other products and services 4.4
TABLE 2:ECOLOGICAL FOOTPRINT PER EXPENDITURE
Household expenditures by income deciles
The aim of this paper is to explore the variation in ecological footprint among different segments of society. Therefore we use income deciles.
Table 1 shows the ecological footprint on 12 aggregate product groups by equivalent income deciles. We can observe how the consumption pattern changes with the increasing total income. The Hungarian households spend mostly on food and beverages their incomes. and its share of income decreases from 52.69% to 33.69%. In contrast. the share of expenditures on transport increases from 9.88% to 17.10%. Households with higher
income level generally spend more money on holidays and leisure activities at weekends than poor families.
The share of expenditures on wearing and footwear. alcohol. tobacco. education.
communication and other products to total income nearly remains constant. The categories
‘other products and services’. ‘health care’. ‘culture’. ‘hotels and restaurants’ increase proportionally.
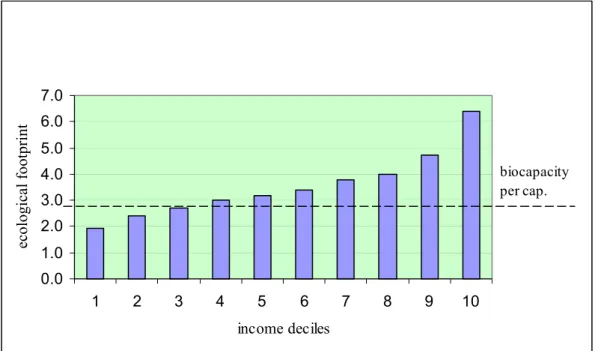
Fig.2. shows the composition of ecological footprint in increasing income deciles. The annual ecological footprint of households of the first income group 1.9 gha per capita and of the last deciles is 6.4 gha per capita. When the volume of the consumer basket increases.
the demand for food levels off. while the demand or expenditures on transport. recreation or services increases more than proportionally. This observation indicates a consumption pattern common to other countries. too.
The results can be easily misinterpreted in a way that suggests a less harmful consumption structure for the wealthy. For example. food. as major driver of the ecological footprint has a lower proportion in their spending. We must note. however. that high income groups do not reduce their expenditure on any of the product groups either in HUF or in natural dimension. They just add luxury items to the top of their shopping list.
Thus. increasing income. although apparently improves the structure of ecological impacts.
will still go ahead with enlarged ecological footprint.
0.0 1.0 2.0 3.0 4.0 5.0 6.0 7.0
1 2 3 4 5 6 7 8 9 10
income deciles
ecological footprint
biocapacity per cap.
FIGURE 3: ECOLOGICAL FOOTPRINT PER CAPITA BY INCOME DECILES IN HUNGARY
The biocapacity of Hungary is 2.82 global ha per capita meaning that about 30% of our population lives within the biological limits of the country. Deciles 4. 5 and 6 are close to the margin: environmental conscientious individuals within these income groups might live in a sustainable ways. The highest income group is characterized by about 2.5 times higher environmental impact than the biocapacity. It is unlikely that such big difference could be offset by proper purchasing behavior.
More radical changes in the infrastructure. technology and lifestyle are necessary.
Further research is needed though to measure the impact of environmental attitude.
Table 3 and Table 4 show the bias often prevalent when comparing wealthy countries with less well-off. United Kingdom seems more efficient in ecological footprint/GDP or ecological footprint/expenditure terms than Hungary. The root of this apparent
“efficiency” can be found in higher prices as well as in buying more expensive products by the wealthy consumers. The ecological footprint per capita by product groups shows some variation across product groups. but the total per capita footprint without direct impacts of households is actually about the same in the two countries. (UK has a total of 5.3 gha per capita and Hungary has a 3.5 gha per capita when also taking direct ecological impacts of private transport. fuel burning and built up land into account.) The bias is very similar to that of comparing the highest income deciles to the lower ones. Thus. we cannot expect reduced ecological impact as a result of increasing income.
Hungary UK
EF/expenditure EF/expenditure Ratio
gha/HUF*10-6 gha/HUF*10-6 Food and non-alcoholic
beverages 9.321 3.237 2.9
Alcoholic beverages 1.726 1.549 1.1 Clothing and footware 3.366 0.278 12.1 Housing and utilities 4.247 0.795 5.3 Furniture and household 7.326 0.567 12.9
Healthcare 1.273 0.371 3.4
Transport 5.323 0.726 7.3
Telecommunication 0.427 0.248 1.7
Recreational and cultural services
1.670 0.794 2.10
Education 1.410 0.326 4.3
Catering and
accommodation services
5.654 0.935 6.0
Other products and services
4.365 0.394 11.08
TABLE 3: ECOLOGICAL FOOTPRINT INTENSITY OF EXPENDITURE IN HUNGARY AND IN THE UK(WITHOUT DIRECT IMPACTS BY HOUSEHOLDS)
HU UK
EF/cap Food and non-alcoholic beverages 1.42 0.72
Alcoholic beverages 0.04 0.09 Clothing and footware 0.10 0.03 Housing and utilities 0.50 0.58 Furniture and household 0.22 0.20
Healthcare 0.04 0.02
Transport 0.18 0.37
Telecommunication 0.02 0.02
Recreational and cultural services 0.09 0.32
Education 0.01 0.02
Catering and accommodation services 0.14 0.41 Other products and services 0.24 0.25
Summa 3.0 3.0
TABLE 4: ECOLOGICAL FOOTPRINT PER CAPITA BY PRODUCT CATEGORIES (WITHOUT DIRECT IMPACTS OF HOUSEHOLDS)
V. CONCLUSION AND FUTURE RESEARCH
Our analysis revealed that end-of-supply chain industries has much higher environmental impact than what is usually supposed. It also showed that consumption of food. utilities and fuel are dominant within the ecological footprint. We must interpret these results with caution. The high EF of food production is due to the high area requirements of the sector. rather than to its polluting nature. Ecological agriculture might even have higher EF than intensive agriculture. characterized by high input of pesticides and artificial fertilizers. as its crop yield is lower. The same analysis will be carried out for environmental indicators other than EF in order to complete the picture.
We also found that highest income deciles consumers boast more than three times higher EF than the lowest income deciles. although the relationship between income and EF is regressive. A part of that might be compensated by environmental conscientious behaviour. but the difference seems to be too high for a complete offset.
In our future research we intend to refine the methodology of measuring the environmental impact of consumption and will also measure the potentials in voluntary changes in the lifestyle. We will also link ecological footprint to the measuring of happiness and life satisfaction in order to check how much ecologically sustainable lifestyle is associated with reduced life satisfaction. Identification of social groups with sustainable lifestyle and high level of life satisfaction will be targeted in order to reveal the
“miracle” of living happily and sustainably.
VI. REFERENCES
[1] Lenzen M. Wiedmann T. Foran B. Dey C. Widmer-Cooper A. Williams M and Ohlemüller R 2007:
Forecasting the Ecological Footprint of Nations: A Blueprint for a Dynamic Approach. ISA Research Report 07-01
[2] Shove. E: Changing human behaviour and lifestyle: a challenge for sustainable consumption?. In: L.
Reisch and I. Ropke. Editors. The Ecological Economics of Consumption. Edward Elgar.
Cheltenham (2004). pp. 111–
[3] Wackernagel. M.. Rees. W.E.. 1996. Our Ecological Footprint- Reducing Human Impact on the Earth. New Society Publishers. Gabriola Island. B.C
[4] Simmons. C.. Lewis. K.. Barrett. J.. 2000. Two feet—two approaches: a component-based model of ecological footprinting. Ecological Economics 32. 375–380.
[5] Bicknell. K.B.. Ball. R.J.. Cullen. R.. Bigsby. H.R.. 1998. New methodology for the Ecological Footprint with an application to the New Zealand economy. Ecological Economics 27. 149– 160.
[6] Lenzen. M. and Murray. S. A.:2001. "A Modified Ecological Footprint Method and Its Application to Australia." Ecological Economics 37(2): 229−55.
[7] Wackernagel et al.; 2006: Allocating ecological footprints to final consumption categories with input-output analysis– Ecological Economics 56 (2006). 28-48
[8] Tukker. A.. Jansen. B.. 2006. Environmental impacts of products. A detailed Review of Studies. In:
Tukker. A. (Ed.). Special Issue on Priorities for Environmental Product Policy. Journal of Industrial Ecology. vol. 10. pp. 159–182.
[9] Kerkhof A. C.. Nonhebel. S.. Moll. H.C.; 2008: Relating the environmental impact of consumption to household expenditures: An input–output analysis. Ecological Economics 68. 1160-1170
[10] Lenzen. M.Dey. C.. Foran. B.. 2004. Energy requirements of Sydney households. Ecological Economics 49. 375–399.
[11] Pachauri. S..2004. An anlysis of cross-sectional variations in total household energy requirements in India using micro survey data. Energy Policy 32. 1723–1735.
[12] Druckman. A.. Jackson T.;2009: The carbon footprint of UK households 1990–2004: A socio- economically disaggregated. quasi-multi-regional input–output model. Ecological Economics 68.
2066-2077
[13] Proops. J.L.R.. Faber. M.. Wagenhals. G.. 1993. Reducing CO2 emissions. A Comparative Input–
Output Study for Germany and the UK. Springer-Verlag. Berlin. Germany.
[14] Jackson. T.. Papathanasopoulou. E.. Bradley. P.. Druckman. A.. 2007. Attributing UK carbon emissions to functional consumer needs: methodology and pilot results. RESOLVE Working Paper 01-07. University of Surrey.
[15] Wiedmann. Thomas - Minx. Jan – Barrett. John – Wackernagel. Mathis (2005): Allocating ecological footprints to final consumption categories with input-output analysis (Ecological Economics 56 (2006) 28-48)