Influence of Vehicle Aerodynamical Devices on Fuel Consumption Evaluated Using Telematics Tools
Tomas Skrucany
Department of Road and Urban Transport University of Zilina
Zilina, Slovakia
tomas.skrucany@fpedas.uniza.sk
Tomasz Figlus Department of Transport Silesian University of Technology
Katowice, Poland tomasz.figlus@polsl.pl Jiří Čupera
Department of Technology and Automobile Transport Mendel University of Brno
Brno, Czech Republic jiri.cupera@mendelu.cz
Borna Abramovic Department of Railway Transport
University of Zagreb Zagreb, Croatia borna.abramovic@fpz.hr
Csaba Csiszar
Department of Transport Technology and Economics Budapest University of Technology and Economics
Budapest, Hungary csiszar.csaba@mail.bme.hu
Abstract-This paper connects two new technology trends in vehicle fleets of road transport - the new informatics technology, especially telematics software used for evaluation transport, driver and vehicle characteristics. The second one is new technology which makes lowering of fuel consumption - aerodynamical devices of road semi-trailers. The main scope of the paper is evaluation of differences in vehicle fuel consumption and estimation the influence of aerodynamical devices. Three different tracks of haulage were chosen for evaluating the influence of aerodynamical devices on the fuel consumption. The measurement was done on one vehicle with one driver and other variable characteristics were logging for accurate evaluation.
The telematics tool is logging many operational parameters.
aerodynamical devices influence on vehicle fuel consumption was estimated according to this measured values by using the correlation between different chosen operational factors of haulage.
Keywords—fuel consumption, measurement, aerodynamical devices, heavy good vehicle, transport telematic tool
I. INTRODUCTION
New technology in transport are used for efficiency increasing of the operation. One of the most actual and watched factor is fuel consumption [1, 2, 3]. This factor is very important from the economical [4] and also environmental point of view of the enterprise and also the whole society. The vehicle fuel consumption directly related to the energy efficiency and the emissions production of the transport [5, 6]. Many legislation tools and acts aimed their scope to the decreasing of the energy consumption and GHG production of the transport sector [7, 8, 9]. One of the way how to reach this target is the decreasing of the vehicle fuel consumption.
Variable factors influencing the fuel consumption are acting during the vehicle movement and haulage realisation.
The fuel consumption is influenced by variables like vehicle velocity, vehicle gross weight, ambient weather conditions, traffic flow, driving technique of the driver and many others [10, 11, 12]. Their mixture and value is very dynamical during the transport process.
Different technologies do their effect by different way.
Decreasing the vehicle resistances, exactly the air drag, is one of the possibilities how to reduce the fuel consumption and emissions production [13, 14]. Lower value of aerodynamical drag effects the actual power of vehicle engine during its movement [15, 16, 17, 3]. The value of consumed fuel and energy depends on the value of spent engine power. This two quantities are proportional, though not directly.
Aerodynamical devices are using for improving the aerodynamcal characteristics of the vehicle [18, 19]. This fact was estimated also by experimental methods in wind (aerodynamical) tunnels [20, 21, 22]. The most actual for the HDVs is using additional devices located on the rear door of the trailer – rear deflector known as aerodynamical tail [23, 24].
There are many possibilities for measuring the fuel consumption. Volumetric methods like measuring the fuel flow, fuel level in tanks or evaluating the signal from CAN bus or OBU are often used nowadays [7, 14, 18, 24 ]. The most suitable method for measuring and evaluation fuel consumption in the operation during a haulage is logging the data from CAN bus or OBU. Measuring device for such measurement is telematics tool – telematics software.
II. TELEMATIC TOOLS
This is one of the most modern ways to measure fuel consumption that it is currently also the most used. One reason is that no intervention into the vehicle fuel system is needed [2, 13]. The operator can track all the data simply using a telematics system that collects data from the vehicle's
control unit. The OBU of vehicle is able to calculate the amount of fuel flowing through the fuel system by opening the injectors. Subsequently, these data will appear in the telematics system (data flow from OBU to telematics tool).
The system is becoming more and more popular for its increasing modernization and accuracy.
This tools play an important role in the transport of. The majority transport companies use the telematics application for simplification and more efficient managing its transport fleet. They can save us time, finances, reduce the negative impact to the environment and increase road safety.
A. Fleet management
These systems are managed by the fleet. They relate to the entire IT vehicle monitoring group and their parameters, which differ in the range of user-provided functions. The offered features are
Tracking- vehicle location logging.
Monitoring - evaluation of data from vehicle collectors. It is a tool from which it is possible to read characteristics from CAN bus, FMS, or by other way from OBU.
Communication technology – driver to dispatching.
Fleet controlling connection of more systems into one unit with added value a functions, like:
Track optimisation.
Accounting and invoicing systems (with own data exchange).
Time schedule planning (schedule of the driver, crew or haulage).
Fuel management (everything about fuel consumption, security of fuel filling).
The data transmitted between the vehicle and the dispatching may include, in addition to the vehicle's location, vehicle performance data, data related to the goods as well as data related to the crew of the vehicle.
The purposes of telematics applications are:
Operational management.
Supervision of the operation of vehicles.
Increasing operating efficiency.
Reduce operating costs.
Improving service quality.
Collection of operational characteristics and data for next evaluation and usage.
III. AERODYNAMICAL DEVICES
Aerodynamical drag is the highest resistance force acting during vehicle movement in higher velocity. This drag is rising exponential according to actual vehicle velocity and it is higher than rolling resistance from the velocity of 80 km∙h-
1 by the road trailers.
Figure 1. Resistance power of truck with semitrailer [3, 23]
Nowadays the trend is to increase the transport velocity.
This fact is possible to realise thanks to higher share of motorways and highway to the local regional roads and higher power of vehicle engines. New vehicle is able to drive higher velocity mainly in situation like climbing, acceleration, or by full loaded vehicle. On the other side, production technology and used materials for tires support decreasing of rolling resistant value. Aerodynamical drag takes increasing value in the vehicle drive resistances mixture.
Examined devices are deflectors situated on the trailer rear door. According to theirs shape and visual look of the equipped vehicle, they are known also as tails.
The using of this devices in public traffic is an actuality.
Because of the legislative change in EU sector (Directive 2015/719 - amending Council Directive 96/53/EC laying down for certain road vehicles circulating within the Community the maximum authorised dimensions in national and international traffic and the maximum authorised weights in international traffic) and its application in to national legislations, it is possible to equipped vehicle by aerodynamical devices even if they cause the oversizing vehicle maximum length.
Figure 2. Side view of devices [23]
The functional principle of this devices is in directing the air behind the rear part of vehicle and thereby preventing air turbulence. This reduces the air pressure differences around
0 20 40 60
0 10 20 30 40 50 60 70 80 90
Resistance power (kW)
Velocity (km.h-1) Pv - air drag
Pf - tires rolling Pp - mecha nical losses
vehicle bodywork surface and overall aerodynamic resistance. Driver must be able to recline (close) this device because of traffic safety (manevours in low velocities, city traffic, etc.). Both device position (close/open) are shown in the following picture.
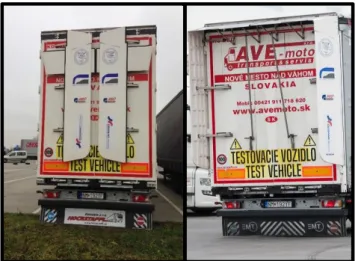
Figure 3. Device operation positions – close (left) and open (right) IV. MEASURING VEHICLE
Measuring vehicle was semitrailer set. The tractor vehicle was MAN TGX 18.460 and the semi-trailer Koegel Light SNCO MAXX in the design MEGA – lower deck with higher load height. Technical information about vehicle are in the table 1.
TABLE I. VEHICLE PARAMETERS
MAN TGX 18.460 EURO VI
Type of cabin XLX
Cabin dimensions L/W/H (mm) 5 875 x 2 500 x 3 530 Engine
MAN D2676 LF 52 6 valves in-line, diesel, 12,5 l
displacement Engine power (kW) at engine
speed (rpm) 338 / 1800
Torque (Nm) / engine speed
(rpm) 2300 /1050
Gearbox MAN TipMatic 12,
retarder Axles (tractor/trailer) 4 X 2 / 3 axles
Tractor wheelbase (mm) 3 600 mm
Tractor axle payload F/R (kg) 7 500 kg / 11 500 kg Trailer axle payload (kg) 8000 / 8000 / 8000
Payload (truck set) 25 000 kg
Tires 315 / 70 R / 22,5
Figure 4. Measuring vehicle
V. MEASRUED TRACK
The route Nové Mesto nad Váhom (SK) - Jihlava (CZ) is 215 km long. The route leads through urban areas (towns and villages) and extra urban, rural areas (regional routes, motorway, and highway). MAN Telematics develops a route speed profile and evaluates the average vehicle speed during transport. A detailed development of the route Nové Mesto NAD Váhom (NM) – Jihlava (JIH):
13.4 km driving through the towns and villages,
30 km of the route along the first class roads and
171.6 km by the motorway on the motorways and the international road E50.
In percentage terms, 79.8% of the route was crossed by motorways and international routes, 14% by way of class I and 6.2% of the route going through cities and municipalities.
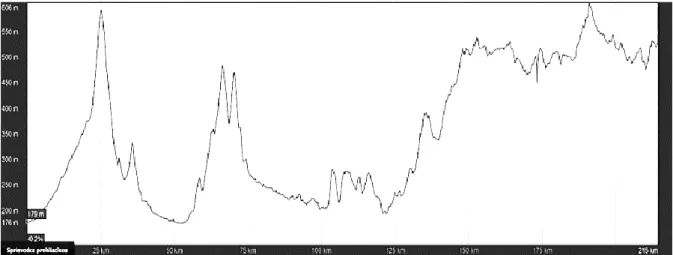
Looking at the figure of the elevation profile (fig. 5 on the following page) of the route guidance, it should be noted that most of the route is heading to the climb. The steepest slope is located across the border.
This slope caused the increased fuel consumption. F.e., the beginning of the track is at an altitude of 179 m.a.s.l. and the route destination is situated at an altitude of 526m.n.m.
After crossing the 25 km from the beginning, the vehicle will climb 427 rising meters up to an altitude of 606 m.a.sl.
When analysing the climbing and descending of the vehicle during the transport (direction NM – JIH), the maximum gradient of 8% and the maximum slope of -5.6%
was set. Total elevation meters is 2378 uphill and 2038 downhill. This direction is considered as uphill direction, the opposite direction is downhill. Thanks to this fact, it is possible to evaluate the result for two types of route and for them both together also.
Figure 5. Measuring track
VI. MEASURMENT METHODOLOGY
Telematics management system of vehicle fleet (TMS) MAN Telematics was chosen for data logging and evaluation.
This tool is authorized telematics support of vehicle producer MAN.
Fuel consumption is very dynamic variable which is effected by many different factors. This value is a result of engine actual efficiency (to engine speed) and sum of driving resistances.
The engine efficiency is constructional attribute which can be influenced from the vehicle operator only a few (gear shifting, accelerator position). Resistance sum can be decreased by aerodynamical devices (air drag), tire option (lower rolling resistance, vehicle mass), track option (slope) or accelerator position (vehicle acceleration / deceleration).
Measuring and evaluating of influence of one chosen parameter on fuel consumption is difficult for burdening of many variables in time. By such evaluating, restraining of all
or almost all other parameters is necessary. Only this method can bring results of influence of chosen parameter.
The principles for securing of right measurement and filtrating irrelevant factors were:
Driving with the same vehicle
Driving with the same driver
Driving on the same track
Driving with the same vehicle mass
Alternating usage of aerodynamical devices (on/off) In spite of these principles, many parameters were been logged and evaluated. This was caused by diversity of some variables – driving technique of the same driver is not every day the same, traffic condition are not the same every day. It was no table to restrain one parameter – weather condition.
TABLE II. OVERALL DATA FROM MEASUREMENT
Date
Load Weight
(t)
Temperature
(°C) Aerodynamical
Devices
Fuel Consumption (l∙100km-1)
Average Vehicle
Speed (km∙h-1)
Average Engine Speed
(min-1)
Average Accelerator Positioning
(%)
13.6
8 16 Off 25,9 79,5 1167 21
3,5 16 Off 21,6 76,3 1177 24
20.6
8 21 On 26,1 75,1 1121 24
5,8 17 On 21,7 77,2 1181 21
21.6
8 27 Off 27,6 75 1072 25
5,4 17 Off 23,6 78,7 1111 21
27.6
8 17 On 25,6 80,2 1181 23
7,2 19 On 23,9 74,6 1121 25
28.6
7,4 13 Off 26,4 77,9 1154 24
4,8 19 Off 21,7 67,3 1096 23
Date
Load Weight
(t)
Temperature (°C)
Aerodynamical Devices
Fuel Consumption (l∙100km-1)
Average Vehicle
Speed (km∙h-1)
Average Engine Speed
(min-1)
Average Accelerator Positioning
(%)
1.7
8 23 On 25 79,6 1182 21
8,7 16 On 22,8 80,9 1204 20
4.7
8 13 Off 25,6 80,1 1166 20
5,1 18 Off 21,5 75,4 1143 23
11.7
8 34 Off 28,9 73,6 1144 34
3,2 28 Off 24 77,7 1158 22
12.7
8 29 On 26,9 69,9 1097 29
3,2 20 On 23,7 75,1 1149 25
19.7
8 14 Off 26,7 76,9 1153 26
3,4 24 Off 21,8 75,4 1162 26
20.7
8 14 On 26 81,5 1227 22
5,5 21 On 20,6 71,6 1109 25
4.8
8 16 On 25,4 80,5 1198 22
5 24 On 22,2 75,5 1150 24
16.8
8 24 Off 25,7 69,6 1132 30
8,5 21 Off 23 76,8 1167 25
18.8
8 28 On 26,5 76,9 1135 27
5,2 21 On 23,6 81,1 1209 24
30.3
8 15 On 27,4 76,8 1164 28
5 15 On 22,8 75,7 1105 20
31.3
8 21 Off 26,4 78,3 1157 26
5 21 Off 25 78,5 1157 23
5.4
8 8 Off 26,8 80,4 1196 21
5 8 Off 23,3 76,9 1176 23
6.4
8 10 On 26,8 79,8 1179 19
5 10 On 22,8 76,8 1188 26
Correlat
ion 0,697 0,140 0,188 -0,008 0,336
Data introduced in the table 2 were measured on route NM – JIH and the opposite direction (circuit transport).
Analysis of the whole circuit begins by creating a summary master table of all the necessary data. From these data, it was possible to establish the graphic evaluations and to calculate the fuel consumption differences. The table consists of both transports, which were carried out in the territory of the Czech Republic and the Slovak Republic. At every date two rows of different types of data are entered. First line at each date expresses data from the route NM - JIH and the second line indicates each opposite direction, JIH – NM. From the summary table 2, the remaining tables were created. The following step was to calculate the correlation between parameters and the fuel consumption (the last row from table
2). The correlation values represents the dependence of individual parameter impact on the change of fuel consumption.
As can be seen, during the measurement of the entire transport circuit the greatest dependence was the change in fuel consumption of the quantity of goods transported during transport.
The second highest the correlation value was recorded at the accelerator pedal position. The reason for the high values for these effects is the type of route and vehicle guidance during shipment. The route NM - JIH is characterized by an uphill character and a transition through the mountains.
Conversely, the opposite direction has a downhill character.
VII. EVALUATION
The evaluation method used for estimation valuable results was - Pairing the most similar measurements according to the correlation of parameters,
This evaluation method is based on pairing of the parameters with largest correlation values that occurred in the given measurements. For the direction NM - JIH, the correlation of the accelerator pedal position is the highest, the
second is the average vehicle speed, and the third is the weight of load.
This method is suitable for estimation the fuel consumption differences caused by aerodynamical devices without external influences because it is comparing two measurements (devices on and off) with the most similar characteristics and parameters.
TABLE III. PAIRING OF SIMILAR MEASUREMENTS
Temperature (°C)
Aerodynamical devices
Fuel Consumption
(l∙100km-1)
Average Vehicle Speed
(km∙h-1)
Average Engine
Speed (min-1)
Average Accelerator Positioning
(%)
Fuel Consumption
Savings (l∙100km-1)
Average Vehicle
Speed (km∙h-1)
Average Accelerator Positioning
(%)
16 Off 25,9 79,5 1167 21
0,9 79,55 21
23 On 25 79,6 1182 21
34 Off 28,9 73,6 1144 34
2 71,75 31,5
29 On 26,9 69,9 1097 29
13 Off 26,4 77,9 1154 24
0,3 76,5 24
21 On 26,1 75,1 1121 24
8 Off 26,8 80,4 1196 21
0,8 80,95 21,5
14 On 26 81,5 1227 22
13 Off 25,6 80,1 1166 20
-1,2 79,95 19,5
10 On 26,8 79,8 1179 19
24 Off 25,7 69,6 1132 30
-1,7 73,2 29
15 On 27,4 76,8 1164 28
27 Off 27,6 75 1072 25
2,2 77,75 23,5
16 On 25,4 80,5 1198 22
14 Off 26,7 76,9 1153 26
1,1 78,55 24,5
17 On 25,6 80,2 1181 23
21 Off 26,4 78,3 1157 26
-0,1 77,6 26,5
28 On 26,5 76,9 1135 27
One of the results is the graphical processing of fuel savings based on actual vehicle speed and accelerator pedal positioning. The following charts, are the X, Y fuel consumption dependency graphs which represent the impact
of specific parameters on fuel consumption while driving the vehicle. They contain functions that determine the accuracy and the progress of the factors examined individually.
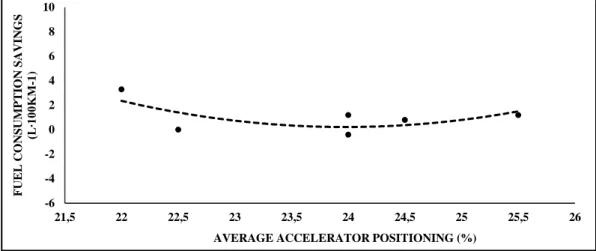
Figure 6.Accelerator positioning impact on fuel consumption savings
The curve run in Figure 6 shows the impact of the accelerator position on fuel economy. Highest saving is achieved with low positioning, when the driver drives defensively. Subsequently, its impact decreases and increases again after about 24%. This may be due to the fact that in the defensive drive, the air resistance of the vehicle reaches a higher proportion in the amount of driving resistances (lower
resistance of inertia, resistance of climbing). However, when the driver drives the highway higher velocity), the air resistance also reaches higher values, so the use of the aerodynamical devices has a greater output to reduce fuel consumption. During driving at higher velocity, the accelerator (end of the curve) needs to rise more.
Figure 7.Vehicle velocity impact on fuel consumption saving
Figure 7 represents the curve of vehicle velocity impact on the fuel consumption savings. Its shape is antagonistic. Its course is antagonistic to the course of the accelerator position curve. At the lowest speeds, the lowest savings are achieved, due to the fact that the air resistance has a minority in the sum of resistance mixture at such velocity. However, with increasing vehicle velocity, the value of air drag increases exponential. However, the vehicle should achieve the highest savings at the highest speed, but the curve does not match.
This may be due to the nature of the route where, when driving in mountainous terrain at lower speeds, the air resistance is portable and thus the aerodynamic devices do not work effectively. With these mountain passes, increasing the speed of the vehicle is an increase in fuel consumption and not savings due to the reduction of air resistance.
For more detailed evaluation, the velocity profile should be logged through whole route.
-6 -4 -2 0 2 4 6 8 10
21,5 22 22,5 23 23,5 24 24,5 25 25,5 26
FUEL CONSUMPTION SAVINGS (L∙100KM-1)
AVERAGE ACCELERATOR POSITIONING (%)
-5 -4 -3 -2 -1 0 1 2 3 4 5
73 74 75 76 77 78 79 80 81
FUEL CONSUMPTION SAVINGS (L∙100KM-1)
AVERAGAE VEHICLE VELOCITY (KM∙H-1)
VIII. RESULTS
Results were estimated by using average statistical function – the simple arithmetic mean with the exclusion of limit values. This was the send step (after the pairing) to exclude all irrelevant and confusing parameters and results.
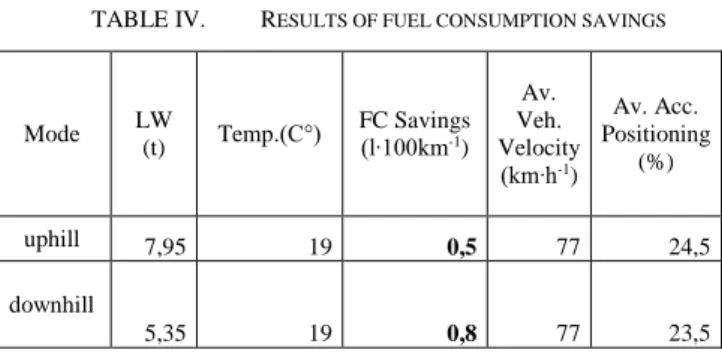
TABLE IV. RESULTS OF FUEL CONSUMPTION SAVINGS
Mode LW
(t) Temp.(C°) FC Savings (l∙100km-1)
Av.
Veh.
Velocity (km∙h-1)
Av. Acc.
Positioning (%)
uphill 7,95 19 0,5 77 24,5
downhill
5,35 19 0,8 77 23,5
(LW – load weight, Temp. – temperature, FC – fuel consumption, Av. Veh. Velocity – average vehicle velocity, Av. Acc. Positioning – average accelerator positioning)
The table 4 represents final results evaluated by the method of pairing similar measurements. FC savings were measured at the value of 0,5 l∙100 km-1 in the transports with uphill character and 0,8 l∙100 km-1 during average downhill driving.
It is caused by driving resistance mixture, there is a higher proportion of air drag in overall resistance mixture during the downhill driving. In this case, the air drag reduction reach higher efficiency in FC savings.
The FC savings are not possible to ascribe only to the route climbing because also the load weight was higher in uphill mode. Ambient condition and vehicle velocity were the same. Accelerator position was higher in uphill mode because of the higher climb resistance.
From the results, it is possible to set conclusions that aerodynamical devices works more effective:
1. With increasing vehicle velocity (valid by flat routes, not for hilly routes),
2. by downhill character of the route, 3. by flat routes,
4. by lower load weight, or lower total vehicle weight, 5. by defensive driver´s technique
All this above mentioned parameters of individual vehicle operation contribute to fuel consumption savings.
After experience with this measurement, it is possible to set some statements and improvements for next similar measurements:
1. Casual telematics software is suitable for estimating fuel consumption savings of changes some operational characteristics of vehicle,
2. accuracy of results is increasing with increasing of measured mileage,
3. estimated results have sufficient reliability for transport operator or haulier,
4. higher accuracy can be achieved by excluding as much as possible variable parameters (lock their values),
5. higher accuracy can be achieved by measuring as much as possible variable parameters – logging their values during the whole measurement.
ACKNOWLEDGEMENT
This publication is the result of two the project funds:
1. Centre of excellence for systems and services of intelligent transport, ITMS 26220120028 supported by the Research Agency, Research and Development Operational Programme funded by the ERDF (European Regional Development Fund). "Podporujeme výskumné aktivity na Slovensku/Projekt je spolufinancovaný zo zdrojov EÚ." "We support research activities in Slovakia/Project is co-financed by EU sources. "
2. Institutional project of Department of Road and Urban Transport, University of Žilina, „Vplyv aerodynamických vlastností vozidiel v cestnej doprave na ich prevádzku” (Influence of aerodynamical characteristics on road vehicle operation, 6/KCMD/2018.
REFERENCES
[1] A. Altaf, A. O. Omar, W. Asrar, “Passive drag reduction of square back road vehicles,” Journal of Wind Engineering and Industrial Aerodynamics, vol. 134, pp. 30-43, 2014, [2] M. Barth, K. Boriboonsomsin, “Energy and Emissions Impacts of a Freeway-Based Dynamic Eco-Driving System,” Transportation Research, Part D: Transport and Environment, vol. 14, pp.400-410, 2009,
[3] V. Rievaj, O. Stopka, J. Vrábbel, L. Mokričkovám C. Schmidt, “The Impact of Air Resistance on the Fuel Consumption in Real Conditions within the Transport Operation, ”Communications - Scientific Letters of the University of Žilina, vol. 18, pp. 57-61, 2016
[4] G. Kovács1, M. Gubán, “Planning of Optimal Fuel Supply of International Transport Activity,” Periodica Polytechnica Transportation Engineering, vol. 45, pp. 185-196, 2017,
[5] R. Rajamani, Vehicle dynamics and control, Springer, New York, 2012 [6] B. Jereb, S. Kumperščak, T. Bratina, “Factors Influencing the Purchasing Decisions of Low Emission Cars: A Study of Slovenia,
“FME Transactions, vol. 46, pp. 278-284, 2018, [7] J. Van der Krieke, G. Van Raemdonck, “Analyzing Fuel Savings of an Aerodynamic Drag Reduction Device with the Aid of a Robust Linear Least Squares Method,” SAE Int. J. Commer. Veh., vol. 7, 2014, [8] J. Caban, P. Droździel, D. Barta, Š. Liščák, “Vehicle tire pressure
monitoring systems,” Diagnostyka, vol. 15, pp. 11 – 14, 2014 [9] G. Ling, et. Al, “Fuel-efficient Model Predictive Control for Heavy
Duty Vehicle Platooning using Neural Networks,” Proceedings of the American Control Conference, vol. 2018, pp. 3994-4001, 2018, [10] I. Johansson, J. Jin, X. Ma, H. Pettersson, “Look-ahead speed planning
for heavy-duty vehicle platoons using traffic information,”
Transportation Research Procedia, vol. 22, pp. 561-569, 2017, [11] G. Zamboni, M. André, A. Roveda, M. Capobianco, “Experimental
evaluation of Heavy Duty Vehicle speed patterns in urban and port areas and estimation of their fuel consumption and exhaust emissions,
“ Transportation Research Part D: Transport and Environment, vol.
35, pp. 1-10, March 2015,
[12] J. Ondrus,b L. Cernicky, “Usage of polcam device for parameter monitoring and traffic flow modelling,“ Communications - Scientific Letters of the University of Zilina, vol. 18, pp. 118-123, 2016 [13] V. Konečný, F. Petro, “Calculation of selected emissions from
transport services in road public transport,” MATEC Web of
Conferences, vol 134, November 2017,
[14] S. Hausberger, M. Rexeis, J. Blassnegger, G. Silberholz, “Evaluation of fuel efficiency improvements in the Heavy-Duty Vehicle (HDV) sector from improved trailer and tire designs by application of a new test procedure,” TU Graz, Gra, 2011
[15] J. McNally, et al,”Drag reduction on a flat-back ground vehicle with active flow control,” Journal of Wind Engineering and Industrial Aerodynamics, vol. 145, pp. 292-303, 2015, [16] H. Choi, J. Lee, H. Park, “Aerodynamics of Heavy Vehicles. Annual
Review of Fluid Mechanics,” vol. 46, pp. 441–468, 2014,
[17] F. Rahimi-Ajdadi, Y. Abbaspour-Gilandeh, “Artificial Neural Network and stepwise multiple range regression methods for prediction of tractor fuel consumption,” Measurement, vol. 44, pp. 2104–2111, 2011 [18] G. Fontaras, et al, “An Experimental Methodology for Measuring of Aerodynamic Resistances of Heavy Duty Vehicles in the Framework of European CO2 Emissions Monitoring Scheme,” SAE Int. J.
Commer.Veh, vol. 7, 2014,
[19] H. Chowdhurya, B. Loganathana, I. Mustarya, H. Moriab, F. Alama,
“Effect of various deflectors on drag reduction for trucks,” Energy Procedia, vol. 110, pp. 561 – 566, 2017, [20] D. Gunes, "On the similarity of wind tunnel experiments and numerical simulation of heavy-duty trailer flow,” Progress in Computational Fluid Dynamics, vol. 10, pp. 168–176, 2010, [21] J. Holt, K. Garry, S. Velikov, “A wind tunnel investigation into the effects of roof curvature on the aerodynamic drag experienced by a light goods vehicle,” International Journal of Vehicle Design , vol.
67, pp. 45–62, 2015,
[22] O. Hubova, L. Konecna, P. Lobotka, “Influence of Walls and Ceiling on a Wind Flow in BLWT Tunnel,” Applied Mechanics and Materials vol. 617, pp. 257–262, 2014
[23] J. Vrabel, J. Jagelcak, J. Zamecnik, J. Caban, “Influence of Emergency Braking on Changes of the Axle Load of Vehicles Transporting Solid Bulk Substrates,” Proceedia Engineering, vol. 187, pp. 89-99, 2017, [24] T. Skrucany, B. Sarkan, J. Gnap, “Influence of Aerodynamic Trailer
Devices on Dragreduction Measured in a Wind Tunnel,” Eksploatacja i niezawodnosc – Maintenance and reliability, vol. 18, pp. 151–154, 2016,
![Figure 1. Resistance power of truck with semitrailer [3, 23]](https://thumb-eu.123doks.com/thumbv2/9dokorg/1423646.120615/2.892.480.837.82.295/figure-resistance-power-truck-semitrailer.webp)