Global and Geopolitical Environmental
Challenges
Corvinus Geographia, Geopolitica, Geoeconomia
Institute of Geography, Geoeconomy and Sustainable Development Book Series
Series editors: László Jeney – Márton Péti – Géza Salamin
János Rakonczai
Global and Geopolitical Environmental
Challenges
Corvinus University of Budapest
Budapest, 2018
Authors of Chapter 12:
János Rakonczai – Viktoria Blanka – Zsuzsanna Ladányi Authors of Chapter 14:
János Rakonczai – Márton Péti – Géza Salamin Professional proofreader: Attila Kerényi
Translated by:
Edit Balog (Chapters 1-3, 14-19) András Petz (Chapter 4)
Viktoria Blanka and Zsuzsanna Ladányi (Chapters 5-13) English language proofreader: Simon Milton
Figures and Technical Editing:
Viktoria Blanka and Zsuzsanna Ladányi Photos:
János Rakonczai
ISSN 2560-1784 ISBN 978-963-503-740-7 ISBN 978-963-503-745-2 (e-book)
This book was published according to a cooperation agreement between Corvinus University of Budapest and The Magyar Nemzeti Bank.
Publisher: Corvinus University of Budapest
Cover design and printed: Komáromi Printing and Publishing LTD Leader in charge: Ferenc János Kovács executive director
Contents
FOREWORD ... 9
INTRODUCTION ... 13
I. FACTS AND THOUGHTS ABOUT GLOBALISATION ... 17
1. The process of globalisation ... 19
2. Globalised world economy ... 27
3. Recognizing global problems and the world models ... 36
II. OUR GLOBAL ENVIRONMENTAL PROBLEMS ... 43
4. Overpopulation and other issues related to population... 45
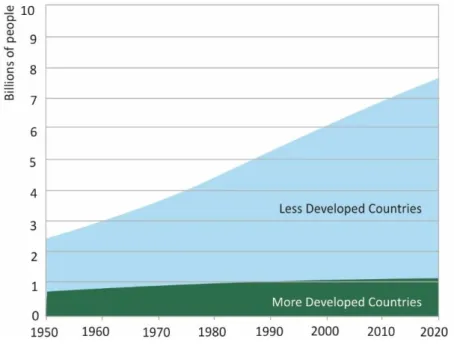
4.1. Population growth ... 45
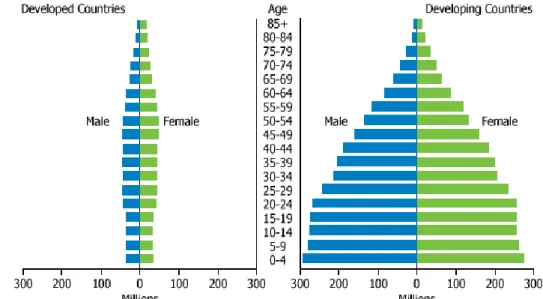
4.2. Demographic division of the world ... 54
4.3. Urban and metropolitan growth ... 56
4.4. Growing income equality between people... 60
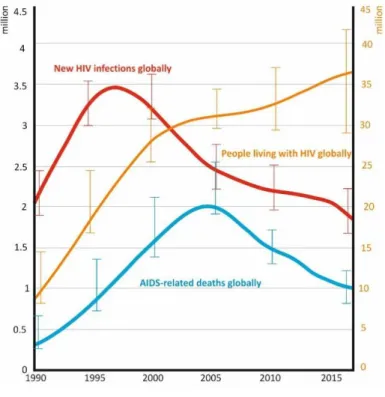
4.5. Infectious diseases, epidemics ... 63
4.6. International migration ... 65
5. Global climate change and environmental atmospheric problems ... 72
5.1. The composition and temporal changes in the atmosphere ... 73
5.2. The background to global climate change ... 74
5.2.1. The greenhouse effect ... 74
5.2.2. Past climate change on Earth ... 79
5.2.3. The process, background and major consequences of current climate change ... 81
Greenhouse gasses ... 82
Global warming and its consequences... 84
Seawater acidification ... 91
El Niño ... 92
The Great Ocean Conveyor Belt ... 93
Changing precipitation conditions ... 96
Expansion of deserts ... 97
The role of volcanism in climate change ... 99
5.2.4. Who or what is responsible? ... 99
5.3. The ozone problem ... 106
5.3.1. The background to the changes in ozone concentration ... 106
5.3.2. Ozone hole ... 111
5.3.3. Who is responsible for ozone-layer depletion? ... 117
5.4. Acid rain ... 121
5.5. Air pollution ... 127
5.5.1. Air pollution of natural origin ... 127
5.5.2. Some health consequences of anthropogenic air pollution .... 128
5.5.3. Indoor air pollution ... 131
6. Global water problems ... 132
6.1. Problems with freshwater ... 134
6.1.1. Resources and use ... 134
6.1.2. Dying big lakes, suffering huge rivers ... 143
The Aral Sea... 144
Lake Chad ... 148
Lake Urmia ... 153
Poyang Lake ... 157
The Yellow River (Huang He) ... 159
The Colorado River ... 160
Nile ... 162
6.1.3. Reservoirs and big dams ... 163
6.1.4. Water pollution as a limiting factor for water use ... 164
6.1.5. Signs of a water crisis ... 168
6.1.6. Challenges of seashores and islands ... 171
6.1.7. Flood risk ... 174
6.1.8. Water conflicts and ‘water wars’ ... 175
6.2. Environmental problems with the world’s seas ... 178
6.2.1. Overfishing... 178
6.2.2. Pollution of the world’s seas ... 183
7. Deforestation: a global problem ... 189
8. The waste problem ... 198
9. Limits on non-renewable natural resources ... 205
9.1. Oil and the Hubbert curve ... 205
9.2. Rare-earth metals (REM) ... 214
9.3. Sand resources ... 216
9.4. How long will there be enough raw materials? ... 218
9.5. The environmental consequences of raw material production ... 219
10. Utilization and consequences of nuclear energy ... 220
10.1. Civil utilization of nuclear power ... 220
10.2. Nuclear accidents ... 223
10.3. Non-civilian use and its consequences ... 229
11. Soil: a conditionally renewable natural resource ... 230
12. Biodiversity ... 238
12.1. Decreasing biodiversity ... 239
12.2. The central role of humanity in biodiversity change ... 242
13. The ecological footprint: an indicator of environmental responsibility ... 244
III. THE HUMAN RESPONSE TO ENVIRONMENTAL CHALLENGES ... 255
14. Environmental protection as a new factor... 257
15. What can science do?... 260
16. The undertakings of politics ... 261
16.1. Earth summits ... 262
16.1.1. Stockholm 1972 (the UN Conference on the Human Environment) ... 262
16.1.2. Rio de Janeiro, 1992 (UN Conference on Environment and Development) ... 263
16.1.3. The World Summit in Johannesburg in 2002 (UN World Summit on Sustainable Development)... 267
16.1.4. Rio de Janeiro 2012 (UN Conference on Sustainable Development – Future We Want) ... 268
16.2. The most significant environmental summits and conventions according to sector ... 269
16.2.1. The ozone convention and its consequences... 269
16.2.2 Conventions on greenhouse gases ... 272
16.2.3. Agreements related to the effects of acid rain ... 278
16.2.4 Major international agreements about the marine environment ... 282
16.2.5 International conventions on fresh water ... 284
16.2.6 Conventions on nature protection ... 286
16.2.7 International conventions on waste disposal ... 287
16.2.8 Acceptance of international conventions ... 288
16.3 Further opportunities for international environmental policy ... 289
16.4 The significance of countries’ national environmental policy ... 290
17. Economic traps ... 291
17.1 Production constraints ... 291
17.2. Selling off our environment ... 292
17.3 The profit trap ... 293
18. Where are we now? ... 294
19. Should we pack or should we stay? ... 297
List of references ... 299
FOREWORD
Foreword from the Publisher Consideration of environmental issues cannot be avoided in current conversations about geopolitical processes, global challenges, and the long- term future of our World. Therefore, it is highly important to analyse the environmental features of the contemporary global issues that we deal with in our publications.
This book provides an overview of the current state of play of our global environment, citing examples to illustrate common challenges from all around the world. The Author also summarizes the findings of preexisting global models about the future of development and the worldwide policies and activities that have thus far been proposed to handle environmental challenges. This book ends with conclusions about our highly uncertain next few decades. The Author believes that there might still be grounds for a relatively optimistic long-term outlook; however, not without great effort. Therefore, with this book we would like to reach as many readers as possible, including different expert groups, future professionals, and also the general public.
Our school is committed to disseminating geographical knowledge and providing evidence of the importance of geographical information. Professor Rakonczai applies a geographical approach to describing challenges and policies:
he synthesizes many different sectoral and thematic issues at the regional and global level, and his evaluations are spatially differentiated. This serves as appropriate proof that the application of a geographical and information-based lens is a must when analysing environmental structures and problems.
Professor Rakonczai has been a mentor of some of the members of our school, and we have learned from him as students and also as professionals. We will be happy if this publication disseminates his knowledge and attitude to a wider audience.
Márton Péti Director, CUB GEO Institute
INTRODUCTION
The management of globalisation and the related economic, social, political and environmental effects is one of the greatest challenges faced today. Although almost everybody experiences the ever-accelerating process in their own way, individual positions and standpoints generate widely different views about its intrinsic features. The primary aim of this book is to summarize the environmental effects of globalisation and evaluate their social consequences, since at first sight, globalisation-related problems are of a socio-economic nature. However, as far as their effects and relations are concerned, they represent environmental problems in almost all cases as well. It is also obvious that global environmental problems can be tackled successfully only by pursuing a socio-economic approach.
In our everyday lives we have rather mixed impressions of the short- and long-term effects of our rapidly changing world. The vast majority of the population live better and longer than their ancestors in previous centuries. On the other hand, the media bombards us with news that appears to threaten our lives and quality of life. If we could eliminate such news about terror attacks, local wars, the migrant crisis, disasters, or the effects of contaminants on sea organisms stemming from the pollution of the oceans, we could lead a pretty good life. Growing lifespans, increasing levels of consumption, and the markedly improving environmental conditions of developed countries make us forget about their environmental impacts. Nonetheless, even living at today’s hectic pace we should still pay attention to world-renowned philosophers such as Pope Francis or the recently deceased physicist Stephen Hawking. The Pope’s Encyclical,1 issued in 2015, highlights many of today’s environmental issues (Fig.
1), while only a year before his death Hawking warned that within approximately one hundred years we should start colonising a new planet if we intend mankind to survive. If such written signs are insufficient to encourage us to think about our planet’s environmental crisis, we may take a look at a photo album2, which confronts us with evidence about what we have done to our environment.
The past two decades have clearly demonstrated that the process and possibilities of learning advance in parallel. One of the greatest achievements of globalisation, the internet, makes information accessible to nearly everyone.
Taking advantage of this situation we would like to encourage the Reader to think together with us. To facilitate this, we provide plenty of references with which the Reader may update the book’s content, or collect more data about specific topics (although the sources presently available might change or become inaccessible).
1 http://w2.vatican.va/content/dam/francesco/pdf/encyclicals/documents/papa- francesco_20150524_enciclica-laudato-si_en.pdf
2 https://populationspeakout.org/the-book/view-book/
Fig.1.Two excerpts from the index of the Encyclical about our environment issued by Pope Francis in 2015
This book attempts to point out essential relationships. In some cases, our work was hampered by a lack, or the opposite – an abundance – of information (for example, changes in data collection methods, or contradictory data even in the case of reliable sources). Also, we needed to weigh up the reliability of
‘virtual information’. Material from professional sources was supplemented by personal experience from around the world. We have done our best to provide the Reader with the most creditable information, while we encourage everybody to draw their own lessons and on the basis of up-to-date information form their own opinions.
I. FACTS AND
THOUGHTS ABOUT
GLOBALISATION
1. The process of globalisation
Globalisation is thought to be a phenomenon of the late twentieth century. In fact, while the term is new, the phenomenon isn’t. Earlier, its content was so different that we hardly recognized the evidence for it. Moreover, it also moved at a significantly different pace. The roots of globalisation can be traced back to the Age of Discovery, if not earlier, when exchanges of goods and raw materials played a central role, overshadowing the significance of information flows.
During the process of globalisation, the emphasis has shifted. Crucial roles have been played by religion, culture, and science, while lately the economy has been a major player. In the last third of the twentieth century, the environment was forced to take a backseat alongside this, then information technology exploded, and now it seems that politics are also about to gain the upper hand. Events and processes that we have little influence over, such as increases in energy prices, environmental pollution without boundaries, or decisions made hundreds of miles away about the establishment or shutting down of a factory are gaining momentum.
A vital new element of the change is that the representatives of the still dominant economy have had to realize that the relationship between the global economy and global ecology has changed direction. While some decades ago, after becoming cognisant of environmental problems, we worried about the environmental consequences of economic development, we now need to find solutions for the socio-economic effects of ecological stress. Similarly, while in the past the commercial dependence of countries used to be a decisive factor, present-day environmental interdependency can contribute to problems through global warming or regional pollution, for example.
How else has globalisation changed – that makes us think of it as a new phenomenon? This process is called the explosion of globalisation, and it started in the late 1980s. The Eastern European political transition, the disintegration of the Soviet Union, and the end of bipolar world politics opened the door to fundamental political and economic changes. Technological liberalisation began (with the abolition of the so-called CoCom list the markets for modern technology opened up), and the movement of capital accelerated.
Simultaneously, an informal revolution took place (in computerisation and telecommunications) generated by developed countries. Basically, this was the era in which the conditions for an accelerating globalisation were laid down. The world witnessed fundamental changes in technical development
(transportation was supplemented by flows of information), economic policy (the free movement of capital and material assets has accelerated) and political conditions and intentions.
In attempting to outline what globalisation means to our contemporaries, we can say that it has a significant impact on almost every area of our lives, and it has changed the opportunities of not only individuals but also whole sectors by many orders of magnitude. Without taking all the factors into consideration, it is worth attempting to estimate the rate of change of some typical elements of globalisation.
Progress in transportation has increased by about three orders of magnitude, meaning that while in the past we travelled and transported at a few kilometres per hour, travelling at anything less than one thousand kilometres per hour is now not extraordinary. This allows us to take short holidays in distant places. Similarly, we are able to obtain fruit and other perishable goods from all over the world – this involves only a question of making a market assessment.
On the other hand, it takes just moments for infectious diseases to spread around the planet. Voyages used to take longer than the incubation period of most diseases, and epidemics could be stopped by imposing quarantine at ports.
In our fast-paced world it is now difficult even to detect the source of many diseases of this kind. No wonder the film industry has exploited this topic.
‘Innocent’ transport can also cause substantial ecological change. On Guam, for example, a certain species of snake that was accidentally brought onto the island is now held responsible for the extinction of bird and mammal species.
The globalisation of healthcare may best be measured in terms of accelerated population growth, with an efficiency estimated as 1-2 orders of magnitude. This means that in earlier periods of history it took hundreds or even thousands of years for the population to double. In the middle of the twentieth century, however, this process took only 35-40 years. (For more details, see Chapter 4.1)
This multi-layered progression of science and technology has brought about consequences that can hardly be described. The transformation of the environment has accelerated. Instead of spades and shovels, enormous excavators reshape the landscape. Instead of fly swatters, 'efficient' chemicals with often incalculable effects 'protect' us from the damage that insects cause.
However, these substances also played a major role in bringing about the so- called Green Revolution. The warlike achievements of science have resulted in a 106-7 rise in the efficiency of weapons. High-precision measurement has supported the theory and practice of science in various fields (e.g. satellite navigation, astronomy, and material testing). The perspectives created by information technology, medical science and biotechnology are barely comprehensible to mankind.
The first step in economic globalisation involved the simple exchange of goods. For decades this was fuelled by the predominant, efficiency-based process of exporting and importing. Companies’ profit-oriented attitudes won out over demand for national self-sufficiency. The former produce where it is cheaper, often ignoring social and environmental consequences. Multinational companies often internally shape important segments of the trade in global merchandise, and their decisions frequently directly influence other countries’
economies. Processes that take place in another hemisphere may often have massive impacts on actors totally independent of them. For instance, it can pay to intensely watch developments in interest rates in the United States, as these can determine fundamental economic processes. We find it self-evident that we can set off and discover the world with dollars or euros (the world currencies) in our pockets. There is hardly a place in the world where we can’t enjoy Coca Cola or a hamburger, products which are the simple consequences of economic globalisation. The list goes on.
Both the speed of transmission and the globalisation of information have undergone a revolutionary change. How far we have come from the pace of the Inca couriers, or native American smoke signals! We take for granted the watching of any live broadcast, whether a football match, the main events of the Romanian revolution, the bombing of Baghdad during the invasion of Kuwait, or 9/11. Financial specialists wake up with data about the Far Eastern stock market and go to bed with data about New York’s. It is not unusual for the participants of virtual teleconferences to meet only through a screen. About 25 years ago, cell phones were available only to the ‘privileged’. With slight exaggeration, we can say that many of the present young generation now change their phones more frequently than their shoes, and even two- or three- year-old children use them more confidently than their grandparents.
The globalisation of information collection has changed dramatically as well.
Developing safe ways of remote sensing played an essential role in ending the Cold War (it wasn’t necessary to physically spy on the spot, and the vital instruments of war couldn’t be hidden from satellites either). We can find increasing amounts of useful public information on the internet, which allows us to learn about almost anything from our armchairs. Previously, it was mainly the omniscient professor, who brought books from the West and carefully locked up after showing it to the colleagues, thus, could hinder the spreading of modern science for even a decade. Today, the internet allows us to collect information about the most recent scientific achievements and bring students more up to date about topics than their teachers. The author of this book made good use of such knowledge as he was able to continuously update his material and check potentially contradictory data. Such information, however, may be misleading, since with such an abundance of sources we may come across
material of dubious scientific background. Web cameras that promote public security may increase security, and even help identify cases of criminality. Also, we are able to monitor our homes from thousands of kilometres away. At the same time, the web poses numerous threats to its users, such as various types of cybercrime, leaks of personal information, the enhancement of swift communication between terrorists, or even external intervention in elections (as alleged with the recent American election). A couple of decades ago, geographical maps at a scale of 1:200 were classified as top secret (e.g. in Hungary – although we didn’t understand why). Now, with Google Earth we can not only count the swimming pools in the neighbourhood, but archaeological objects in distant countries have also been discovered using this tool. Unfortunately, the program is also a ‘perfect’ device for planning explosions.
Data about cell phone and internet use reveal (Fig. 1.1) that the advantages of globalisation are increasingly being used by mankind. Cell phones and the internet, whose success story started in the early 1990s, are now part of our everyday lives. While the internet was initially mainly used in developed countries, after 2000 there was a real revolution in its use in less developed regions. It is a notable fact that between 2000 and 2016 the number of internet users increased sixfold in Europe, but in the meantime in the Middle East it increased by fifty times, and in Africa almost by a hundred (Table 1.1).
Consequently, the internet has become an integral part of our lives across the world (Fig. 1.2).
Fig.1.1. Number of mobile cellular subscriptions, internet users and fixed phone lines (1990–2017) (Source: IWS, Worldbank3)
3 https://www.internetworldstats.com/stats.htm ,
https://data.worldbank.org/indicator/IT.MLT.MAIN?view=chart
Table 1.1. Internet users per region at the end of 2017 (Source: based on data from IWS4)
Continent/
region
Popu- lation (million)
Proportion of global population
(%)
Number of internet
users (million)
Proportion of internet users in the region
(%)
Increase in number
of users (%) 2000- 2018
Proportion of global
internet users (%)
Africa 1288 16.9 453 35.2 9941 10.9
Asia 4207 55.1 2024 48.1 1670 48.7
Europe 828 10.8 705 85.2 570 17.0
Latin-America/
the Caribbean 652 8.5 437 67.0 2318 10.5
Middle East 254 3.3 164 64.5 4893 3.9
North
America 364 4.8 346 95.0 219 8.3
Oceania/
Australia 41 0.6 28 68.9 273 0.7
World 7634 100 4157 54.4 1052 100
Fig. 1.2. Percentage of internet users in different regions of the world in January 2018 (Source: data from IWS)
At the beginning of 2018 more than four billion people enjoyed its benefits.
At a regional level there are only two African regions where less than one third of the population access it (although life expectancy is outstandingly low in these areas). Cell phones have become seemingly indispensable in a similarly
4 https://www.internetworldstats.com/stats.htm
short time. At the beginning of 2018, the eight-and-a-half billion appliances in circulation were being used by 5.1 billion people, with many having two or three phones. Although there was a surge in the number of landline phones at the beginning of the 1990s, with the appearance of cell phones their popularity quickly decreased, with a significant drop since 2006 (1.26 billion compared to fewer than 1 billion in 2017). Owing to the rapid spread of smartphones, the lovechild of the internet and the cell phone, since 2016 – only seven years after their debut on the market – internet use using a smartphone is more common than through a desktop computer (Fig. 1.3). This is how cell phones have become the most widespread technological wonder in less than a quarter of a century.
With the speedy spread of the internet, the role of television in providing information to people has gradually declined. There are now about 1.6 billion appliances in use by some 3-4 billion people.
Fig. 1.3. Landline and mobile internet access compared (October 2009 – March 2018) (Source: data from StatCounter,5 supplemented)
The globalisation of environmental problems had become clear by the last third of the twentieth century. With the escalation of industrial activity, water and air pollution increased. The phenomenon of acid rain and the potential for the greenhouse effect were mentioned as early as in nineteenth-century scientific articles. Still, recognizing the hazards of these took more than a hundred years. The first program for measuring carbon dioxide, the main element responsible for the greenhouse effect, was only launched in the late 1950s. It was mainly in the USA that attempts were made to discredit research findings about global warming through the deliberate
5 http://gs.statcounter.com/press/mobile-and-tablet-internet-usage-exceeds-desktop- for-first-time-worldwide
spread of misinformation. At first, forest damage caused by acid rain was thought to have natural origins, and only became the centre of analysis as an environmental issue at the end of the 1970s. Recognition of the atmospheric phenomenon known as the ‘ozone hole’ occurred in 1985. (We discuss the above-described problems in later chapters.)
The second half of the twentieth century was a significant period in the globalisation of politics, too. After the end of the Cold War, the UN also took significant political role. Associated with the UN the globalisation of environmental politics began in 1972 with environmental conventions and conferences in Stockholm, Rio and Johannesburg.
In the past decades, in the form of a silent guest, a common language, an important element of social globalisation, joined the club. It is becoming obvious that English is the language of international communication. Not long ago, at high-level international scientific conferences multilingual simultaneous interpretation was provided, which is nowadays only typical at political events. This tendency is supported by the fact that in Japan the introduction of English as an official language has been contemplated.
Another example comes from the present author’s personal experience.
About 20 years ago I heard a Chinese organiser of a conference in Singapore complaining how difficult it was to enrol his son at a university where courses were taught in English. Of course, social globalisation has both centuries-old and new elements as well, like global migration flows (e.g. the colonization of America by Europeans) or the mixed marriages that are virtually commonplace these days. Also, due to our globalized social relations, it is not unusual that foreign players predominate in the teams that play in major football championships.
The dynamic development of international tourism can be regarded as part of the phenomenon of social globalisation, and has grown by more than 60 times in about 50 years. Although it can be slowed by a major international event such as the Iraq War, 9/11 or an economic crisis, this soaring tendency appears to be unstoppable (Fig. 1.4). International tourism has become a real industry. In 2016, on average, every sixth person took part in it (1.235 billion people). Revenues between 1990 and 2014 almost increased sixfold (in 1990 they reached $264 billion, while in 2014 tourism was worth $1522 billion), equal to half of the revenue from fuel, and slightly exceeding revenue from food exports (worth $1486 billion in 2014). The main tourist destination is Europe, which ‘owns’ half of all international tourism (Fig. 1.5). In 2016, the most popular tourist destinations were France, the USA, Spain, China and Italy, but it was the Chinese who spent most on international trips ($261 billion), almost equalling the total spending of the USA, Germany and Great Britain ($268 billion).
Fig. 1.4. Number of international tourists (1995–2016) (Source: based on data from UNWTO)
Fig.1.5. International tourism destinations in 2016 (million people/%) (Source: based on data from UNWTO 2017)
2. Globalised world economy
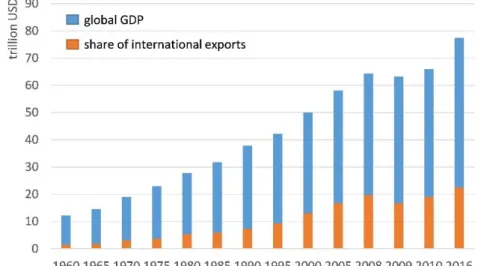
Since World War II, the world economy has been profoundly transformed. A significant increase in production has been combined with dynamic development in trade, and once strictly closed national economies have become open and market sensitive. This change is clearly demonstrated by the fact that while global production increased 12 times between 1950 and 2007, international trade grew thirtyfold. This increase has accelerated sharply since the mid-1970s. International markets expanded dynamically until the economic crisis of 2008, when more than 30% of all production was exported (Fig. 2.1).
The effects of the crisis caused a slight drop in the international trade in goods.
Now it seems that, owing to changes in the structure of goods, a period of stagnation has begun, starting in around 2006.
Fig. 2.1. Global GDP and the share of international trade in goods in GDP6 (1960–2016) (Source: Worldbank data)
There has been extensive change in the structure of trade, especially considering the proportions of agricultural and industrial goods. During the past 50 years or more, as a result of the increase in industrial products, trade in agricultural products has been relegated to the background (Fig. 2.2). In 1950, agricultural exports accounted for nearly 47% of total turnover. By 2005, this figure had fallen to below 10%, while the proportion of industrial products had
6 GDP calculated in 2010 prices.
risen from 38% to 72%, meaning that the declining share of agriculture (already shrunk to one-fifth of the size of earlier) was juxtaposed against a nearly doubling industry. We should not be surprised at this if we take the material situation into account. Even if there were an abundance of food, food consumption wouldn’t increase in a manifold way, not even in the most famine- stricken areas. Conversely, the market for consumer goods has reached almost biblical proportions in the past fifty years. Mechanization means that products previously barely known (the television, washing machine, refrigerator, telephone, etc.) have become part of our everyday lives, and a wide range of brand-new products (computers, hi-fis, videos cameras, cell phones, etc.) have appeared and spread across the world.
Fig. 2.2. World merchandise trade volume by major product group (1950–2015) (Volume indices, 1950=100) (Source: WTO 20167)
Since 2006, a minor change has been taking place in the trade in world merchandise. The growth rate of the market share for agriculture, which was 5%
on average between 2006 and 2016, has overtaken that of the processing industry (although the latter still plays a dominant role), while the share for raw materials has suffered a severe setback since 2013. As a result, in 2016 the share of agricultural trade was 60% larger and industrial trade 37%, but trade in raw materials was 10% less than in 2006 (Fig. 2.3). As many suspect, this dramatic turn might be due to reasons beyond petroleum production and related prices,
7 https://www.wto.org/english/res_e/statis_e/world_commodity_profiles16_e.pdf
which are sometimes difficult to understand (we discuss these later), and the broad distribution of renewable energy resources.
World merchandise trade, both in exports and imports, is dominated by five economic superpowers (the EU, China with Hong Kong, the USA, Japan, and South Korea) that account for more than two-thirds of total trade. (It is important to point out that roughly two-thirds of EU trade takes place within the Union.)
Fig. 2.3. World merchandise trade by major product groups (2006–2016) (billion USD) (Source: WTO 2017)
An illustration8 designed in 2017 that displays leading national exports communicates a great deal of interesting information. It shows that exports are dominated by fuel according to the size of territory (North America, North Africa, the Middle East, Russia, and the former Soviet countries in Asia). Western and Central Europe, Japan and Mexico mainly export cars, Southeast Asia is the leading exporter of computer products, and Australia and the southern and western regions of Africa primarily export ores.
Apart from the exchange of goods, working capital investments have increased significantly, and the average daily turnover of stock markets has multiplied, entailing dynamic growth in international financial flows.
These data indicate that the interdependency of countries has never been so developed throughout history. The main losers of the drastic restructuring of the trade in world merchandise described above have been underdeveloped, non-industrialized countries with continually decreasing exports and rising imports. This process has led a number of countries into a dead-end debt trap.
Conversely, countries with substantial petroleum reserves which had previously
8 At the time of writing this book, available at
https://d36tnp772eyphs.cloudfront.net/blogs/1/2017/09/export_map.png . By zooming in on the map you can obtain more information: e.g., the main export product of Nepal is flavoured water, Brazil, which used to be the biggest coffee exporter, is now engaged in exporting soy, and Moldova exports insulated wire.
been lagging behind have emerged as the outright winners of the accelerating global economy and have been able to achieve unthinkable prosperity, although there are some exceptions.
The economic strengthening of countries and multinational companies was needed for the acceleration of trade in world merchandise. Since the second half of the twentieth century there has been far-reaching change in the economic performance of countries. The most spectacular change involves Japan, China, India, South Korea, Brazil, Mexico, Spain and Italy, while the latter two were less developed in the 1950s. These countries, and the great petroleum exporting ones, have contributed to the fact that formerly developing countries are today literally developing. Their share of trade in world merchandise is continuously increasing, to which inflowing external capital also contributes.
Table 2.1. GDP of the world’s 15 economically strongest countries (1960–2018) (Source: based on data from Worldbank and IMF)
Rank order 2016
Country
GDP (billion USD 2016) GDP ratio GDP/ppp 1960 1990 2000 2016 2016/
1990 1990/
1960 2016/
1960 2016 2018*
1 USA 543 5980 10285 18624 3.1 11 34.3 18624 20200
2
China (with Hong Kong)
61 361 1376 11520 31.9 5.9 188.8 21451 25478 3 Japan 44 3140 4888 4940 1.6 71.4 112.3 5267 5546
4 Germany 1765 1950 3478 2 4041 4308
5 UK 72 1093 1635 2648 2.4 15.2 36.8 2828 2980
6 France 63 1275 1368 2465 1.9 20.2 39.1 2774 2932
7 India 37 317 462 2264 7.1 8.6 61.2 8718 10340
8 Italy 40 1177 1142 1859 1.5 29.4 46.5 2324 2378 9 Brazil 15 462 655 1796 3.9 30.8 119.8 3147 3330 10 Canada 41 594 742 1530 2.6 14.5 37.3 1598 1336 11 South
Korea 4 279 562 1411 5.1 69.8 352.7 1832 2127
12 Russia 517 260 1283 2.5 3397 4143
13 Spain 12 535 626 1237 2.3 44.6 103.1 1694 1848 14 Australia 19 311 415 1205 3.9 16.4 63.4 1129 1296
15 Mexico 13 263 684 1047 4 20.2 80.5 2280 2498
World total 1366 22595 33568 75848 3.6 16.5 55.5 120603 167782
* Estimated data (IMF)
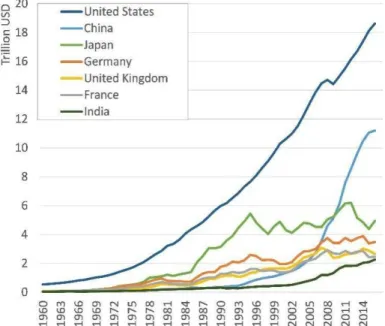
Based on their economic performance in 2016, there are 15 countries whose yearly GDP exceeds $1000 billion (Table 2.1). However, in the past fifty years these countries have taken distinctly different development paths before reaching their current positions. Many countries, but mainly Japan, South Korea, and Spain, significantly progressed between 1960 and 1990. China and India, on the other hand, have been continuously rising since 1990. China’s development is particularly fast. In 1960 its economic performance amounted to only one- ninth of the USA’s, while in 2016 the figure was 62%. According to some predictions, in the first half of 2020 China may well have the strongest economy in the world. As far as purchasing power parity (PPP) is concerned, it has already overtaken the USA. The path of GDP growth highlights many interesting things (Fig. 2.4). Remarkably, the Japanese economy, traditionally considered to be strong, has been stagnating since 1995. With the exception of a short hiccup following the crisis of 2008, the economy in the USA has been expanding steadily and dynamically. The Chinese economy has been improving rapidly since 2005, although in the past one or two years it has slightly slowed down. Also, the Indian economy was kick-started in 2005, but the rate of growth was only a little more than that of the leading economies in Europe.
Fig. 2.4. Evolution of growth of the world’s seven economically strongest countries (1980–2016) (USD 2010) (Source: Worldbank9)
9 Find data for more countries at
https://data.worldbank.org/indicator/NY.GDP.MKTP.KD
The price of petroleum greatly affects the economic efficiency of petroleum-market-dependent countries which are rushing up behind the seven most powerful economies (Fig. 2.5). These countries experienced rapid development between 2000 and 2008, and following a slowdown in 2009 took off again until 2013. Russia suffered the greatest economic decline resulting from the decrease in petroleum demand which led to a significant decrease in price. Special mention should be made of Saudi Arabia, which can be found in twentieth place on the size-of-GDP list of 2016. Its economic performance decreased and stagnated following the first oil price shock of the late 1970s until the year 2000, then due to another price increase it grew considerably. In spite of the fact that it has a more single-product-type economy than Russia, insecurity about oil prices affected the latter much more deeply.
Fig. 2.5. Evolution of growth of some economically strong but petroleum- dependent countries (1980–2016) (USD 2010) (Source: Worldbank) In the process of globalisation it is multinational companies that come under most attack. They receive criticism for taking an indifferent attitude towards citizens, while having tremendous economic power. Their activities are driven by pure economic interest, not by social sensitivity. The average citizen can hardly imagine the economic power of these supernational companies. At the end of the 1990s the total annual sales of the 200 biggest companies exceeded the total GDP of all the world’s countries, excluding the top ten
countries. These 200 biggest companies account for more than one-quarter (27.5%) of global economic activity, while they employ only about 1% of the world’s workforce. These cumulated data mask a couple of interesting facts, however. From the formerly mentioned 200 companies, 82 were American, a fact which might be fuelling anti-American attitudes in many parts of the world.
Forty-one were Japanese, 20 were German, and 17 were French, meaning that four countries own four-fifths of the biggest companies.
After the millennium the role of multinational companies increased.
Indeed, the brake on economic development in the second half of the 1990s resulted in the public sector’s gradual withdrawal from international economic processes. Meanwhile, the private sector, which is technically equivalent to multinational companies, spread dynamically.
As regards the distribution of power at an international level10 there has been a major transformation in the past twenty years. Although USA-centered corporations still prevailed in the group of the 200 biggest companies in 2016, their number has now declined to 63. Conversely, in China the rapid development of economy brought about the strengthening of large companies.
There are 41 of them in the top 200, but the strongest ones have worked their way up to 2nd-4th place. The stagnation of the Japanese economy is well reflected in the decline in the position of their large companies, while their number in the ranked list of 200 has halved to 20. Germany and France have also lost some of their economic importance (14 companies each on the list)11. Nevertheless, these five countries account for more than three-quarters of the 200 strongest companies, with these 200 companies responsible for 23.2% of world GDP.
According to a survey12 conducted in 2017 that examined the 500 biggest companies, the former are responsible for 36% ($27.7 trillion) of world GDP while employing only 67 million people.
Comparison with national economic performance demonstrates the size of the corporate giants. On a common list that includes country GDP and the revenue of large companies, the biggest company (Walmart) occupies only 25th place, while there are five companies among the first 50 places. However, in the
10 These are mainly multinational companies, but there are some national ones, too.
11 There are two reasons why we decided not to go into more detail on a country level.
Many large companies are involved only in one or two branches of industry (e.g. the oil or car industry), so a global market rift involving one branch may result in significant changes in the ranking order in a short time. On the other hand, at the bottom of the list three-quarters of the differences in position are minimal.
12 http://fortune.com/global500/list/ (March 2018)
order of over $100 billion there are 53 large companies and 58 countries. At over
$50 billion companies comprise the majority (86 companies and 78 countries).
The interactive map included below indicates that the strongest companies are concentrated in three areas of the world: the USA, Western Europe, and Eastern Asia (Fig. 2.6).13
Fig. 2.6. Location of the world’s 500 largest companies (Source: based on fortune.com)
(Note: areas of circles are proportionate to company revenue)
In the case of multinational companies, what was originally national capital has become international due to mergers and international trading in shares (in which owners can hardly be identified). This international capital can take full advantage of national specificities: cheap labour, the shortcomings of environmental regulations, the ineffectiveness of trade unions, the weaknesses of consumer protection and social networks, and the reliance of certain governments on international financial institutions. By playing a role in modifying the disadvantageous elements of national regulations such as tax liabilities and duties, they often take advantage of markets, causing many small businesses to go bankrupt. Once such benefits are withdrawn, they relocate. An OECD survey revealed that while in the OECD countries company revenues grew faster than total GDP, the proportion of company taxes as a share of all taxes had not changed.
Despite the fact that today’s multinational companies have considerable influence on national economies and societies, developing countries in
13 For a more detailed territorial analysis, see
http://fortune.com/global500/visualizations/?iid=recirc_g500landing-zone1
particular accuse them of being non-transparent, non-accountable, and able to obtain shadowy political capital from their economic power.
Concerning the globalising economy we encounter a paradox, however.
Oddly enough, the arch-enemy and threat to multinational capital which is considered the spearhead of globalisation is globalisation itself. Large companies enjoy a favourable position as long as there exist nation states and borders between them and poor and vulnerable countries where citizens are content with a fraction of the wealth of richer societies, where concessions related to jurisdiction, health and social benefits can be won or there are environmental requirements that are much less stringent. These conditions enable such companies to deftly manoeuvre between regulations and to relocate. Our world is divided between globalisers and the globalised, where only with international cooperation (and more uniform national legislation) will the globalised have the chance to fight off the harmful effects of globalisation.
The problem is that the advantages of globalisation are extremely attractive to outsiders in the short term, whilst long-term challenges are generally ignored.
But life goes on, heightening tensions and the disproportionate situation.
As we have seen, there is an abundance of data proving the existence of globalisation. However, if we try to specify the essence of globalisation, we come across plenty of – often hardly compatible – conclusions about it which are all true in their own context. Here are three typical interpretations that seek to identify the essence of the phenomenon. One states that globalisation is nothing but a form of global colonisation in which money is used instead of arms. It happens almost voluntarily, meaning that those who are ‘subjugated’ often appreciate it, while the identity of the ‘coloniser’ remains unclear. Another interpretation describes it as the aggressive dissemination of a consumer society culture. Being imperfect humans, we do not object to consumerism. The third approach highlights freedom of access. We can access almost anything in any part of the world provided we have the money. Our actual situation determines which aspect of globalisation we feel is dominant, and helps us determine the truth of this list. Still, the bottom line is fixed: whatever you choose to call the process, you can’t avoid it, even if you would like to. Imagine a situation – which is close to reality – that proves this. Natives living in the rainforests along the Amazon River have no knowledge about globalisation and have no intention of establishing contact with anyone. However, sooner or later they realise that the forest surrounding them is getting smaller and smaller, and (due to the inefficient protection of species) insects and game are disappearing, their rivers are lacking in fish (due to the water pollution of distant areas), and the tribe is developing mysterious diseases, although they haven’t done anything ‘wrong’.
The sad truth is that, in reality, that such individuals are often massacred, too.
3. Recognizing global problems and the world models
For centuries nations and companies have ignored their harmful effects on the environment and lacked a global perspective. A peculiar exception is the geopolitical events related to World War II, namely the actual economic divide.
Following World War II – and especially during the 1970s –, rapid economic progress and newly emerging globalisation drew attention to some phenomena that needed to be examined on a global scale, including population growth and associated world food management, the limitations of renewable and non- renewable natural resources, and the more obvious environmental pollution.
U Thant, Secretary-General of the United Nations, made a powerful speech about global thinking and action at a UN meeting in 1969: ‘the Members of the United Nations have perhaps 10 years left in which to subordinate their ancient quarrels and launch a global partnership to curb the arms race, to improve the human environment, to defuse the population explosion and to supply the required momentum to development efforts. If such a global partnership is not forged within the next decade, then I very much fear that the problems I have mentioned will have reached such staggering proportions that they will be beyond our capacity to control.’ The extensive document that makes up the background material for the speech (Problems of the human environment)14 provides a comprehensive evaluation of our planet’s complex socio- environmental problems and sets forth several specific tasks. With its own tools, the UN took the leading position in the process, although it did not have sufficient political weight to carry them through. Its special body, UNESCO, launched the Man and Biosphere (MAB) program in 1970. In 1972, the first UN conference on the human environment was organised (See Chapter 16.1.1).
The global problems that were identified already appeared to be only superficially independent. Larger populations need more food and resources, and cause more pollution. This socio-environmental-economic correlation is indisputable, as is the fact that these fields require comprehensive analysis. It was suggested that adaptation to problems should become a core activity of mankind (i.e., learning and action). In the case of failure, we were told to expect major conflicts and a sequence of collapses. Although on a governance level
14 The 66-page-long document can be accessed through the following link:
http://repository.un.org/bitstream/handle/11176/295838/E_4667- EN.pdf?sequence=1&isAllowed=y
these concerns were cast aside, luckily professional groups realized the importance and complexity of these challenges. Also, the development of computer science offered assistance in unfolding the consequences. So it is hardly surprising that the years of the 1970s, especially the first half, were a golden age for the creation of world models.
The establishment of the Club of Rome in 1968 was an important event in respect of global thinking and world model creation. The organization was founded with the collaboration of independent philosophers. At the beginning, 30 scientists from ten countries were involved in the work. In the early 1990s the club included 70 professionals from 25 countries, with researchers representing various fields and cultures. According to their working method a team of experts undertook an analysis of a comprehensive topic, which was then discussed, and the summarized results were shared with the public. The team played a major role, particularly at the beginning of the process.
Relevant to the Club of Rome, the most influential and controversial world model was The Limits to Growth15 from 1972, created by D. Meadows and his team. The more extensive book version of this was published in 1974 (Meadows et al.: Dynamics of Growth in a finite World). This model tried to forecast future events by using 99 global indexes16 and empirical data from 1900–1970.
A great credit of the model is that it elaborates the possible effects of environmental pollution in spite of the fact that this was a neglected matter at the time. Environmental pollution rates and individual cost components were specified on the basis of countries’ development status. The model even put forward cost estimates for eliminating forms of pollution. Concerning the evaluation of pollutants’ effects on the environment, their natural dissemination and multistage effects on the ecological system were considered. For example,
15 Available from various sources, e.g.: http://www.donellameadows.org/wp- content/userfiles/Limits-to-Growth-digital-scan-version.pdf . The basic version of the model was worked out by professor J. Forrester who was involved in industrial modelling at MIT, and later edited for publication by his colleagues. (The radically new approach of the book made a very strong impression on the writer of the present book.)
16 A few examples of the data that were used: concerning the area of population:
population size, age composition, mortality rate, productivity, population density, efficiency of population control. Industry: industrial capital, investment rate, industrial production per capita, time period of use for industrial capital. Food production: area used for agriculture, size of usable areas, agricultural investment rate, average period of land use, land loss, number of agricultural jobs per hectare. Environmental pollution:
extent of environment pollution, absorption time, time lag of the effects of environmental damages, yield in relation to environmental pollution. Raw materials:
amount of non-renewable resources, rate of raw material use, raw material use per capita, rate of consumption.
the time lag of DDT accumulation was demonstrated. It is clearly visible (Fig. 3.1) that this poisonous material reaches its highest concentration in fish 11 years after maximum exposure. It was an important methodological decision that country borders and land borders were mainly ignored in terms of the spread of pollution, and models assumed global spreading; consequently, they proposed counter-measures at an international level. Experts did not have appropriate data and biological limit values for some types of pollution, but they incorporated them into the models, including them in a limited form.
Fig.3.1. Amount of DDT used annually, amount accumulated in the soil, amount accumulated in fish (Source: Meadows et al. 1974)
A total of 12 models were created for the period 1900–2100, which can be divided into three main groups. The standard model with Versions 1 and 2 encapsulated the typical tendencies of the era (a growing world). Limited economic growth, Versions 3–7, foresaw that in some fields mankind would make attempts to mitigate adverse developments, such as population control.
Stabilisation attempts (Versions 8–12) aimed to determine how to stabilise the quality of life of mankind. A grim future was predicted. The so-called standard models, based on the developments of the early 1970s, foresaw extremely serious problems arising in the middle of the twenty-first century which culminated in drastic population decline. Despite the various sets of conditions used in the models, the results were similar, and only the background reasons differed. For example, assuming known raw material deposits, raw material shortages, leads to depletion (Fig. 3.2a). Assuming a doubling of resources,
environmental pollution is the main problem. The lesson to be learnt is that the tendencies of the age cannot be sustained without endangering the existence of mankind, and particular attention should be paid both to the amount and the process of utilization of resources. Models which involved regulation of only a few factors were not promising either (Fig. 3.2b). Stabilisation models assume the introduction of comprehensive regulation, and the most successful of these were those which counted on regulations being introduced as early as in 1975 (Fig. 3.2c), since any time loss involving differing stabilisation efforts, such as those starting from 2000 onwards, led to significant social conflict.
Fig. 3.2. Meadows models:
(a) world model, standard run (based on the trends of the 1970s);
(b) world model with ‘unlimited’
resources, pollution controls and increased agricultural
productivity,
(c) stabilized world model
Legend:
1: population of Earth, 2: food per capita,
3: industrial production per capita,
4: raw material deposits, 5: environmental pollution, 6: mortality,
7: birth rate.
The report of the Club of Rome based on the Meadows models, but mainly the visions of the future, projected rather clearly, provoked heated reactions.
Having zero economic development as the appointed economic, social and environmental ideological target was acceptable practically to nobody. This future was considered a capitalistic intrigue both by developing and socialist countries which feared be deprived of the possibility of economic progress.
Neither was it welcomed by developed countries due to their internal inequality.
Beside the ideological attacks, the material received much relevant professional criticism. It is certainly true that it ignored regional differences (the relatively short time prevented experts from coming up with a more detailed analysis), it did not take sufficient account of the future role and significance of science, and it overlooked the threat of nuclear war that was hanging in the air.
However, it had several merits:
● it set out possible alternatives using realistic data,
● its shocking results highlighted a real challenge: if mankind fails to take effective action, our planet will be unable to support its growing population,
● it made it clear that it is impossible to permanently sustain the processes of the age without serious consequences,
● it clearly communicated that a new, global way of thinking was necessary for effective solutions,
● it drew attention to the pressure of time, since the correct measures, if deferred, might be insufficient for dealing with the problems that were identified.
This was the first comprehensive, problem-raising, relationship-focused attempt at examining humanity’s impact. Its role and worth is indisputable.
It detonated thinking about global problems. It should also be noted that, having accepted fairly raised professional criticism, the Club of Rome moved on to create many subsequent world models. The thus-initiated global thinking continued at five world model conferences between 1974 and 1977.
We give here a brief summary of the key observations from the major models.
The second analysis of the Club of Rome, entitled Mankind at the Turning Point (editors: Mesarovič–Pestel, 1974) divided our planet into 10 regions and five levels (environmental, technological, demographic and economic, socio- political and individual). Its fundamental claim was that crises related to issues such as population or environment are related to growth, but they are least likely to be stopped by restraining growth. The document establishes that regional problem management may prevent simultaneous collapses, but that disaster can only be avoided by engaging in global thinking and action, and delay may be
fatal as regards the rest of the choices. It poses global ethical questions (regarding famine, the use of resources, and responsibility towards future generations), as well as the threat of terrorism and nuclear wars.
The Argentinian Bariloche Foundation sought to find solutions to global problems from the perspective of developing countries. The related evaluation, called The Bariloche World Model as an Infeasibility Study, published in 1974, came up with a different approach, as its title suggests. The book version (Herrera: Catastrophe or new society? A Latin-American World Model 1976) provides brief answers in the form of responses to questions about our planet’s future. It stated a belief that the main problem with the world models based on the extrapolation of current tendencies is that they tried to provide answers from the perspective of less developed regions. The underdeveloped regions at the time faced numerous real problems that were predicted to occur in the future by other models. Offered as a last resort, restraining economic progress to promote global balance would mean the conservation of inequalities. The analysis concluded that only with a new world order could disaster be prevented.
The Leontief model (Leointief: The Future of the World Economy, 1977) was prepared at the request of the UN and adjusted to its development strategy. This research is also worth mentioning for many reasons. It was based on a massive computer input-output analysis that examined more than 4000 variables linked to 15 regions and 45 professional subfields. From the perspective of the environment it is remarkable that it dealt with the economic effects of eliminating environmental pollution. In the case of economically developed countries, it incorporated costs adjusted to the environmental regulations of the USA. Least developed countries’ objectives were more moderate, with lower costs, and in the case of the poorest ones it set aside such costs, as financial resources go on more immediate goals than environmental protection. This model, quite thoughtfully, was early to suggest a problem with the balance of payment of the worlds’ countries and the debt crises that led many countries into economic crisis, though it greatly underestimated the magnitude of the issue. This model presents two ways out of the crisis that threatens mankind. The first is slowing down economic progress, while the second is creating a new global economic order, as also proposed by other models.
Related to the Club of Rome, three other comprehensive evaluations were published in the same era. Reshaping the International Order (Tinbergen 1976) reviewed almost the full inventory of social, economic and environmental problems, including population growth, famine, the arms race, deterioration in trade, the brain drain, environmental pollution, water shortages, etc. Showing the foresight of scientists, it is very interesting that in the different models