Crystal and Liquid Dynamics from Neutron Energy Distributions
BERTRAM N . B R O C K H O U S E
Atomic Energy of Canada Limited, Chalk River, Ontario, Canada
1. Introduction
T he subject to be treated here is t he use of inelastic scattering of monoenergetic beams of slow neutrons to study t he dynamics of condensed matter. T he particular application is to solids or liquids, b ut t he m e t h od can be used also for studying molecular or magnetic properties. T he special usefulness of neutrons for this work comes about because of t he relation between the energy and the m o m e n t um of a neutron, or t he energy and wavelength. A neutron wit h a wave- length of 1 A , t he order of atomic separations, has an energy of about 0.08 ev, which is just the order of magnitude of interest i n the study of materials. T h u s, energy changes corresponding to short- wavelength motions i n the specimen are readily measurable. Experi- ments have been going on at Chalk River (and elsewhere) for about 7 years now. T he work of t he group for which I am reporting has been chiefly directed towards obtaining knowledge of t he fundamental dynamical behavior of the atoms i n condensed systems. T he subject is also of interest from the point of view of neutron moderation, b ut this wil l n ot be discussed.
First of all we should consider t he fundamental fact that t he scattering cross sections, t he partial differential cross sections for scattering neutrons by a specimen, are determined almost entirely by t he m o m e n t um a nd energy transfer to t he neutron. W e are interested i n %ω = Ε0-Ε' where E0 is t he incoming neutron energy, E' t he outgoing neutron energy, a nd i n t he wave vector transfer Q = k0 — k', where k0 is t he incoming wave vector, and k' the outgoing wave vector. T h u s, t he n u m b er of variables and the a m o u nt of necessary data are reduced; i n a nonisotropic system, instead of the incoming and outgoing energy and the 3 directions in space, there are only 4 variables. I n an isotropic system there are only 2 ; instead of the ingoing and outgoing neutron energy and the angle of scatter there are t he magnitude of Q a nd the magnitude of the energy transfer.
1 2 9
1 3 0 BERTRAM N . BROCKHOUSE
W e first consider the situation in a crystal, in which one gets rather simple and dramatic results from study of the neutron scattering.
If a neutron is scattered by a single crystal wit h the emission or absorption on one phonon, that is, in a process in which one normal mode of the crystal changes its q u a n t um n u m b er by one, we find
\ E 0- E ' \ = hv (la)
where ν is the frequency of the phonon and
k0 - k' = 2τττ - q. (lb)
[Because all properties of the crystal are periodic in real space one can subtract from any wave vector a vector (τ) of the so-called reciprocal lattice of the crystal and bring the wave vector of the normal mode withi n a single zone. T he wave vector so defined we call q.] T h is subject has often been discussed previously. 1 -6
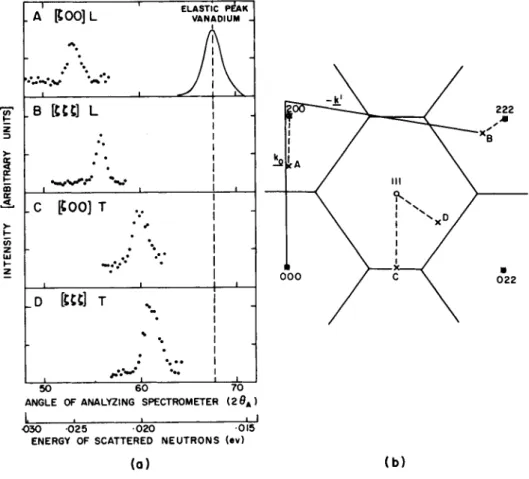
T he experiments in the case of a crystal are fairly simple ; by some means or other, one obtains neutrons of known energy from a reactor and then scatters t h em through a measured angle from a single crystal. T h us one knows the wave vector and the energy of the incoming neutrons, and one measures the energy of the outgoing neutrons and thus the length of the vector k . Therefore one knows the wave vector change Q for any neutron that has been scattered in the one-phonon process, and the wave vector q of the p h o n on that interacted wit h the neutron is found by completing to the nearest reciprocal lattice point. T he results of scattering in the one-phonon process are recognized by the fact that neutrons scat- tered in this process occur in groups in the energy distribution. (This is simply a result of the fact that they conserve energy and m o m e n t um simultaneously.) Typical groups, obtained wit h a lead crystal in several orientations,6 are shown in Fig. 1. F r om the center of a group one obtains the frequency of a particular lattice vibration by con- servation of energy, Eq. (la), and its wave vector by conservation of m o m e n t u m, Eq. ( l b ). (In these experiments the monoenergetic neutrons were selected by a crystal spectrometer, and the scattered neutrons analyzed by another crystal spectrometer.5)
If one does such an experiment, one obtains the wave vector and the frequency of a particular phonon, b ut as neither is known to start with, one is doing a paramètre experiment in which one does not
CRYSTAL AND LIQUID DYNAMICS 131
FIG. 1. (a) Some typical neutron groups at 100°K, obtained using the
"conventional" methods. T h e counting rate is plotted (different ordinate scales) as a function of the angle of the counter of the analyzing spectrometer, which used the (200) plane of an aluminum crystal. T h e resolution function at the incoming energy, obtained from elastic incoherent scattering by vana- dium metal, is also shown, (b) The same groups shown plotted in the reciprocal lattice. (Figure from Brockhouse et al*)
132 BERTRAM Ν . BROCKHOUSE
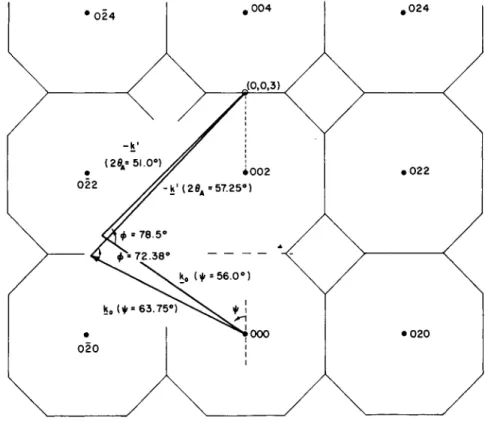
know initially the value of the independent variable (generally speaking, the vector Q ) . I n order to overcome this pecularity of the experiments and allow us to determine frequencies of specific phonons in which we are interested, we use a method which we call the "constant Q "
k' (20A =57.25°)
FIG. 2. The ( 1 0 0 ) plane of the reciprocal lattice of a fee crystal with a typical "constant Q" experiment, designed to locate the frequency of the longitudinal phonon at the point ( 0 , 0 , 3 ) or ( 0 , 0 , 1 ) in the reduced zone.
The vectors shown are the terminal positions of a 26 position experiment.
(Figure from Brockhouse et al.6)
or constant m o m e n t um transfer m e t h o d .5 T h is is illustrated in Fig. 2. Here we arrange for incoming monoenergetic neutrons to impinge on a crystal and observe the scattering at various angles wit h an analyzing crystal spectrometer. N ow if we simply change
CRYSTAL AND LIQUID DYNAMICS 133 the setting of the analyzing spectrometer, we move along a line in reciprocal space, eventually coming to one of the neutron groups (see Fig. 1). However, we can now stay at that point in reciprocal space by simultaneously changing the setting of our analyzing spectrometer, the angle of scattering, and the orientation of the crystal wit h respect to the incoming neutron beam. T o change these three variables simultaneously (and nonlinearly), we must have either a complicated mechanical system linking the various elements of the apparatus or we must drive it by a prescription from a computer.
I n our case we simply decide at what point in reciprocal space we wish to study the energy distribution, program the spectrometer by instructions on tape from a computer, and t h en proceed to vary the parameters step by step producing vector diagrams which always terminate at the same point in reciprocal space. By this means we obtain energy distributions at some particular point in reciprocal space. N ow you observe that this is exactly what we want according to the general prescription in the second paragraph: this has been illustrated for a crystal experiment, but quite generally the only things of interest are the momentum transfer or wave vector transfer, and the energy transfer. W h at we always want to do in neutron scattering experiments is to measure an energy distribution at certain wave vector transfers. T h us this method is applicable to any scattering system. Unfortunately, this programming is easily done only for crystal spectrometers, and it is probably for this reason that, i n this work at the present time crystal spectrometers are the domi- nant instruments.
T h e re are other instruments for making scattering measurements, such as the pulsed-beam spectrometer mentioned by Fluharty.
T h e re are two pulsed-beam spectrometers at Chalk River, one a joint Harwell-Chalk River project initiated by Egelstaff et al.1 and another of a somewhat different type, our o w n .5 T h e se instruments have the great advantage that one can simultaneously measure at as many angles of scattering as one wants to pay for, because a pulsed beam is generated and t h en one just looks at the specimen from as many different directions as desired. W i t h these instruments the rate of data accumulation is very m u ch greater than wit h crystal spectro- meters, and if it were not for this constant Q m e t h od there is no doubt that the pulsed-beam spectrometers would be more suitable for these experiments than crystal spectrometers.
134 BERTRAM Ν . BROCKHOUSE 2. Experimental Results
A. Dispersion Curves for Crystals
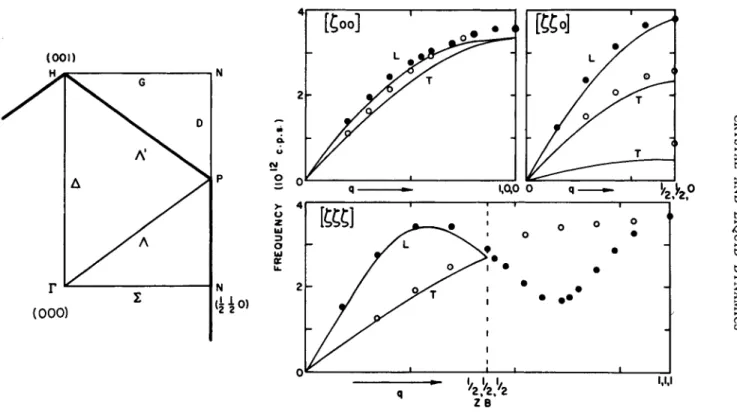
A few experimental results are now shown. I n Fig. 3 are results for a single crystal of sodium that were obtained by Woods et al.8 during the past year. A t the lower left is the irreducible sector of the reci- procal lattice of sodium and of course it can be repeated indefinitely:
the characteristic frequencies of a crystal are defined only over one zone of reciprocal space, for this particular crystal only over t he unit shown, to which t wo reciprocal lattice points contribute. I n Fig. 3 are shown the measured frequencies plotted as a function of wave vector for the three most symmetrical directions. I n a crystal of this type there are three branches to t he vibration spectrum cor- responding to the three orthogonal directions i n space. N ow this is a mirror plane of t he crystal so that, by symmetry, one of these branches has its polarization vector, the direction of vibration of the atoms, normal to the plane. Since we are scattering the neutrons i n the mirror plane the direction of vibration of the atoms for this parti- cular branch is normal to the m o m e n t um transfer to the neutrons, so that t he intensity of t he scattered neutrons is identically zero.3 T h us we see only two branches instead of three. Sodium is a simple metal for which theoreticians believe they can compute dispersion curves which have some chance of being sensible. T he solid curves shown i n t he figure are such computations made by T o y a .9 T he calculated dispersion curves agree wit h t he experimental results i n general aspect, but not i n detail.
I n Fig. 4 are shown r e s u l t s10 for a slightly more complicated crystal, sodium iodide, i n which there are two atoms p er unit cell and therefore not three but six branches to the spectrum of vibra- tions. T h e re are the usual acoustic branches and i n addition there are optical branches, branches for which the frequency does not approach zero as the wave vector approaches zero (that is, as the wave length ap- proaches infinity) . T h e re are transverse optical branches, and longitu- dinal optical branches. Here again is a fairly simple material, an ionic crystal, i n which one belives that one understands i n principle the forces involved. One hopes to make computations based on the well-known ionic crystal model involving short-range interactions between nearest neighbors plus Coulomb interactions between all atoms i n the crystal. One can also take into account the fact that the large negative ion is polarizable, so that when one ion is moved it
CRYSTAL AND LIQUID DYNAMICS 135
Z B
FIG. 3 . Dispersion curves of sodium at 9 0 ° K for three symmetry directions. At left is shown the irreducible unit in the (llO) plane of reciprocal space. (Woods et al.8; , theoretical, Toya.9)
136 BERTRAM N . BROCKHOUSE
produces a field which polarizes another ion, and so modifies the response to the field.10 One can correct for this effect, obtaining the solid curve as shown. Again, the general aspect of the dispersion curves is pretty well reproduced but there are real discrepancies; we do not in fact understand completely what is going in these ionic crystals, what forces are involved, and there is clearly something of importance missing in the model.
FIG. 4 . Dispersion curves of N a l at 1 1 0 ° K for three symmetry directions (Woods et al.10). The points for the longitudinal optical modes are from un- published work by Woods, Brockhouse, and Cochran.
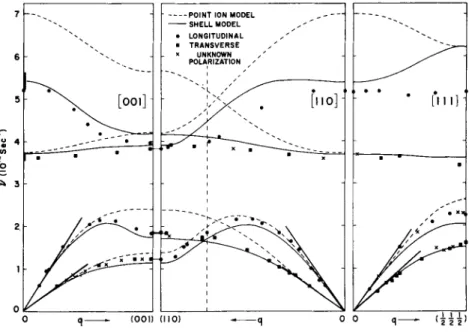
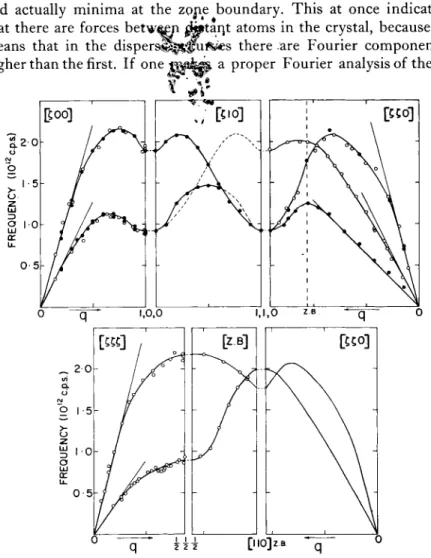
One more set of dispersion curves6 is shown in Fig. 5. T h e se are for lead, a more complicated metal than sodium, and no attempts have yet been made to calculate what the lattice vibrations should be.
W e can, however, consider some of the possibilities; we wil l try to deduce from the dispersion curves what the forces are in this rather complicated metal. One thing stands out: instead of the usual textbook type of behavior in which the frequency of the branch goes up, reaches a m a x i m um at a zone boundary, and then comes down again, some of the curves have maxima in reciprocal space
CRYSTAL AND LIQUID DYNAMICS 137 and actually minima at the zprie boundary. T h is at once indicates that there are forces b e t w ^ yi
jetant
atoms in the crystal, because it means that in the d i s p e r s ^ l ^ i ^ es there are Fourier components higher than the first. If one jpp^pi- a proper Fourier analysis of theseFIG. 5 . The dispersion curves for lead at 1 0 0 ° K for the symmetric directions. The open circles were obtained by conventional methods in a ( 1 1 0 ) plane, the closed circles by the "constant Q" method in a ( 1 0 0 ) plane. T h e straight lines through the origin give the initial slopes of the curves as cal- culated from the elastic constants. (Figure from Brockhouse et al.6)
curves it is found that the forces go m u ch beyond second neighbor forces ; we belive they go out to 8 or more and hence the forces between atoms, at least in this metal, are of rather long range. Hence the
138 BERTRAM N . BROCKHOUSE
shielding of the motions of the ions from each other by the electron gas is not nearly as complete as had been thought.
T h e re are other experiments of this same type that can be carried out. T he common characteristic of these experiments is that they
FIG. 6 . Neutron groups for lead at ( 1 0 0 ) Τ zone boundary at four tem- peratures taken at the point ( 1 , 1, 0 ) in reciprocal space, corrected for specific temperature dependent factors in the one-phonon cross section. The back- grounds have been drawn in to make the areas equal. (Figure from Brockhouse et al.6)
have to do wit h systems in which there exists for each wave vector one, or a very few, discrete frequencies. N ow this is not necessarily true in all cases and indeed it is not the case for a classical liquid;
however, it is true for certain other kinds of materials. I n an array
CRYSTAL AND LIQUID DYNAMICS 139 of magnetic atoms spin waves may be propagated through the system ; in this case, because the neutron has a magnetic m o m e nt and interacts wit h the magnetic moments of the atoms, one can determine spin wave spectra in exactly the same way as one determines lattice vibration spectra.11 Similarly in liqui d helium, one can obtain dispersion curves of somewhat similar t y p e .1 2 , 13
B. Lifetimes of Phonons
I n Fig. 6 we make a gradual transition to the other kind of behavior i n which one does not have a unique dispersion relation between the frequency and the wave vector. If the crystal is warmed the neutron groups gradually broaden. At low temperature one expects that one
aq/2 7T aq/27T
FIG. 7. The full width at half-maximum of the neutron groups (corrected for resolution) as a function of the wave vector in the reduced zone, for the (ζ, 0, 0) Τ and L branches in lead at 425°K. Th e corresponding decay rate is shown by the left-hand ordinate scale. (Figure from Brockhouse et al.6) might see essentially a δ-function broadened by resolution. F r om Fig. 6 one sees clearly, however, that at the higher temperatures there is a distribution at each wave vector. I n the case of crystals this receives a rather simple interpretation: the energy broadening of the neutron groups simply reflects the lifetime of the phonons through the uncertainty principle, so if one measures the energy width of the
140 BERTRAM N . BROCKHOUSE
group and then corrects for resolution one should obtain a measure of the life-time of the phonons in the crystal ; that is, the rate of decay at which the normal modes lose energy to electrons or to other normal modes.
I n Fig. 7 we see such widths, plotted as a function of wave vector for two particular branches of t he lead crystal6 at a temperature which is 7 0% of the melting temperature. Although the experiments are not precise, the widths found are of the order of 1 0-3 ev, correspond- ing to decay rates, by the uncertainty principle, of the order of 2 Χ 1 012 per second. We recall (Fig. 5) that the frequencies of the phonons in lead range up to about 2 Χ 1 012 per second. T h u s, the lifetimes of the phonons are found to be of the order of the period of vibration, and in a crystal at high temperatures t he phonons can be rather ill-defined entities. (This was discovered independently for phonons in aluminum by Larsson et al.u)
C. Liquid Correlation Functions
T he extreme case in which no dispersion relation between the frequency and the wave vector exists is now discussed. Here we must have recourse to other methods to analyze the results. We recall that the partial differential scattering cross section is essentially a function only of the wave vector and energy transfer to t he neutron ; followin g Van H o v e ,15 we make this precise by writin g
W e are going to discuss liquids, which are isotropic systems, so we wil l not be concerned wit h the fact that Q is in general a vector;
we wil l consider only t he magnitude of the m o m e n t um transfer, not its vector nature. T h en we know from a theorem due to Van Hove that the function S is related to a time dependent pair cor- relation function G(r, t) by the relations
d2a
dQdE' Airh k0 (2)
S(Q, ω) = — exp i(Q · r — wt) G(r, t) dr dt
G(r, t) =
J
exp i(œt - Q · r) S(Q, ω) dQ da> . (3)CRYSTAL AND LIQUID DYNAMICS 141 T h i s function 5, the partial differential cross section, is a two-dimen- sional Fourier transform of a function of space and time. I n the clas- sical domain the function G(ry t) is simply described: I t is the natural extension of the ordinary pair correlation function which is discussed i n connection wit h X - r ay scattering, and which is defined as G(r, 0)
"the probability that if there is an atom in position zero at time zero then there is an atom at position r at time z e r o ." T he present extension is similarly defined: "I f there is an atom at position zero at time zero, G(r, t) is the probability that there is an atom at position r at time t" Unfortunately, this correlation function is really not yet of m u ch use from a theoretical point of view, but it does give some insight by presenting a picture of the way atoms move in liqui d systems, for which we do not have rigorous methods of describing the behavior.
W e have attempted to determine this pair correlation function experimentally for two liquids, w a t e r16 and lead.17 T o do thi? one measures a series of energy distributions at various angles of scat- tering, over sufficiently large ranges, so that one covers all values of Q and %ω which are of interest. Ideally one should go from Q = 0 to oo at close intervals, but of course this is impossible at both ends ; however, one can cover a reasonable range without u n d ue expense.
Using a wavelength of 1 A and a few longer wavelengths one can obtain the values needed for a Fourier transformation, in a practical sense, by measurements of perhaps 20 to 50 neutron energy distri- butions over a range of angle perhaps from 10° to 120°.
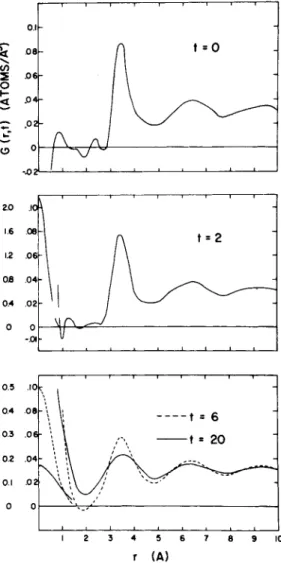
Such a set of experiments was carried out on liquid lead at 620°K by Pope and the a u t h o r .17 I n these experiments we obtained some 50 energy distributions at different angles of scattering for three different wavelengths. T he function S(Q> ω) was constructed from the measurements and transformed by Eq. (3) to obtain t he pair correlation function G(r, t) shown in Fig. 8 for t = 0 and three later times. A t r = 0 and t = 0 there is a S-function (not shown) corresponding to the atom originally at the origin. A t later times this expands to form the distribution ("self-correlation function") shown wit h its own scale at the left. T he conventional pair distribu- tion (t = 0) is shown at the top (the structure for < 3 A is spurious
"noise"). At later times the pair correlation function becomes more diffuse. Extrapolating, it seems that all memory of the structure wil l have probably disappeared by t = 100 X 10~1 3, or 1 0- 11 sec.
O ne can discuss results such as these in terms of models of
142 BERTRAM N . BROCKHOUSE
diffusion in a liquid. You know that there has been a controversy about whether atoms in a liquid diffuse lik e those in a solid by j u m p i ng from one rather well-defined "crystallographic" site to another, or whether they just jitter around lik e people in a dense
0.5 .10k-
5 6 (A)
FIG. 8. T h e correlation function G(r, t) for lead at 6 2 0 ° K (Brockhouse and Pope1 7) for times i = 0t2 x 1Ô~1 3, 6 Χ 10"1 3, and 20 X 1 0 ~13 sec. The
left-hand scale applies to the self-correlation function (a δ-function at t = 0).
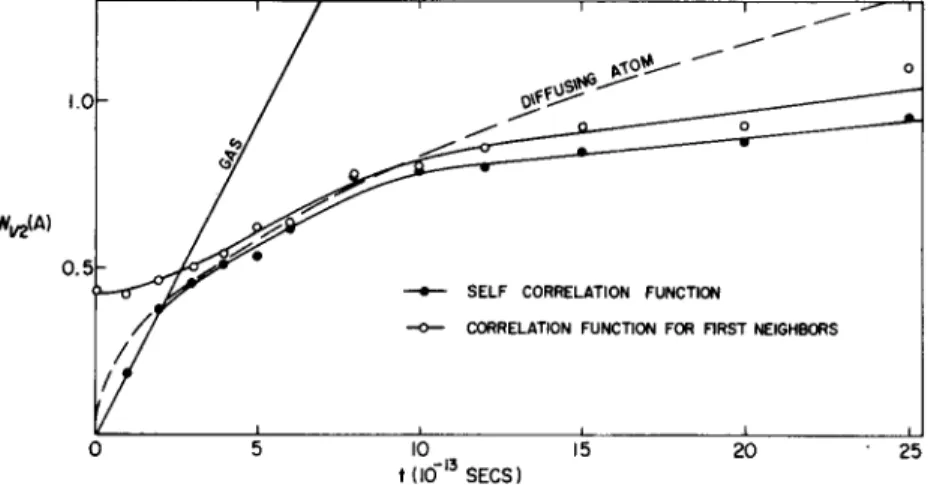
CRYSTAL AND LIQUID DYNAMICS 143 crowd and elbow their way through the liquid. T he experimental a n s w e r1 6 , 17 seems to be that they do both. Figure 9 gives the half- width of the correlation function peaks as a function of time. T he peak near r = 0, corresponding to the original atom, starts off as a δ-function at the origin and expands diffusively. T he diffusion
W^iA)
too"13 SECS)
FIG. 9. T h e radius at half-maximum of the self-correlation function (closed circles) and the half-width at half maximum of the correlation function for first neighbors (open circles) for lead at 620°K (Brockhouse and Pope1 7).
The solid line shows the calculated width for the self-correlation function of a perfect gas of lead atoms at 620°K. The dashed curve is calculated from the simple diffusion theory.
follow s something lik e a t1/2 law as if t he atom were simply obeying the ordinary diffusion equation. T he first-neighbor atoms start out wit h a definite distribution, at time zero, and then diffuse similarly to the atom at the origin. Note that according to simple diffusion theory the distributions continue to broaden indefinitely at the same rate over the whole time region. For the activation kind of diffusion that occurs in a solid, however, the distributions build up to limitin g widths and diffusion occurs by transfer of atoms from one distribution to another. T he fact that the correlation functions continue to expand shows that some of the diffusion is of the first kind. T he fact that the measured curves are lower than those given by the diffusion coefficient suggests that probably some diffusion by activation also occurs. T he experiments thus indicate that diffusion
144 BERTRAM N . BROCKHOUSE
i n liquids is a complicated process not completely describable by either of t he simple models.
I t is also possible to s t u dy other systems by means of Van H o v e 's correlation functions. I n particular, t he m e t h od has already been used at several laboratories to s t u dy t he correlations b e t w e en magnetic m o m e n ts i n disordered or partially disordered magnetic systems. I t wil l p r o b a b ly also prove useful i n studies of dense gases and liquids near t he critical t e m p e r a t u r e.
REFERENCES
1. R. Weinstock, Phys. Rev. 65, 1 (1944).
2. G. Placzek and L. Van Hove, Phys. Rev. 93, 1207 (1954).
3. Β. N . Brockhouse and A. T . Stewart, Phys. Rev. 100, 756 (1955); Revs.
Modern Phys. 30, 236 (1958).
4. Β. N . Brockhouse and P. K. Iyengar, Phys. Rev. I l l , 747 (1958).
5. Β. N . Brockhouse, Methods for neutron spectrometry, Chalk River Rept.
CRNP-947 (AECL-1183). See also IAEA Symposium on Inelastic Scattering of Neutrons in Solids and Liquids, Vienna, 1960, (1961).
6. Β. N . Brockhouse, T . Arase, G. Caglioti, M. Sakamoto, R. N . Sinclair, and A . D . B . Woods, Crystal dynamics of lead, Chalk River Rept.
CRNP-946 (AECL-1074). See also IAEA Symposium, reference 5.
7. P. A. Egelstafï, S. J. Cocking, and T . K. Alexander, A four-rotor thermal neutron analyzer. See also IAEA Symposium, reference 5.
8. A . D . B . Woods, Β. N . Brockhouse, R. H. March, and R. Bowers, Bull.
Am. Phys. Soc. 6, 261 (1961); Proc. Phys. Soc. 79, 440 (1962), 9. T . Toya, J. Research Inst. Catalysis, Hokkaido Univ. 6, 161 (1958).
10. A. D . B. Woods, W. Cochran, and Β. N . Brockhouse, Phys. Rev. 119, 980 (1960).
11. R. N . Sinclair and B . N . Brockhouse, Phys. Rev. 120, 1638 (1960).
12. M. Cohen and R. P. Feynman, Phys. Rev. 107, 13 (1957).
13. D . G. Henshaw and A. D . B. Woods, Phys. Rev. 121, 1266 (1961).
14. K. E. Larsson, U . Dahlborg, and S. Holmryd, Arkiv Fysik 17, 369 (1960).
15. L. Van Hove, Phys. Rev. 95, 249 (1954).
16. Β. N . Brockhouse, Nuovo cimento Suppl. 9, 45 (1958); Phys. Rev. Letters 2, 287 (1959); M. Sakamoto, Β. N . Brockhouse, R. H. Johnson, and Ν . K. Pope, J. Phys. Soc. Japan, to be published.
17. Β . N . Brockhouse and Ν . K. Pope, Phys. Rev. Letters 3, 259 (1959).