ORIGINAL PAPER
One More Awareness Gap? The Behaviour – Impact Gap Problem
Maria Csutora
Received: 31 March 2011 / Accepted: 9 January 2012 / Published online: 1 February 2012
#Springer Science+Business Media, LLC. 2012
Abstract Preceding research has made hardly any attempt to measure the ecological impacts of pro-environmental behaviour in an objective way. Those impacts were rather supposed or calculated. The research described herein scrutinized the ecological impact reductions achieved through pro-environmental behaviour and raised the question how much of a reduction in carbon footprint can be achieved through voluntary action without actually affecting the socio- economic determinants of life. A survey was carried out in order to measure the difference between the ecological footprint of“green”and“brown”consumers. No significant difference was found between the ecological footprints of the two groups—suggesting that individual pro- environmental attitudes and behaviour do not always reduce the environmental impacts of consumption. This finding resulted in the formulation of a new proposition called the BIG (behaviour–impact gap) problem, which is an interesting addition to research in the field of environmental awareness gaps.
Keywords Awareness gaps . Ecological footprint . Sustainable consumption . Recycling . Environmental awareness
Better sustainability policy is supposed to lead to better sustainability performance.
Nonetheless, recent research predicts further growth in the ecological footprint and an on- going ecological deficit in Europe and North America despite their impressive policy efforts (Lenzen et al.2007). Kerekes and Kiss (2000) warned that country assessments in the EU were based on environmental policy rather than on environmental conditions. Specifically, they projected progress in the assessment of Hungary’s environmental policy after the EU accession, coupled with deterioration in the quality of the environment.
Similarly, individual consumption strategies may result in somewhat reduced environ- mental loads for committed consumers, but this reduction cannot offset the total impacts of prevailing trends in socio-economic determinants of lifestyle: higher-income consumers and consumers in higher-income countries still tend to pollute more. A radical change in
M. Csutora (*)
Corvinus University of Budapest, Budapest, Hungary e-mail: Maria.csutora@uni-corvinus.hu
environmental impact requires a radical change in lifestyle (Shove, 2003). The study described in this article aimed at measuring the weight of attitude–behaviour elements compared to contextual elements in determining the ecological impacts of behaviour. So far, most research on the promotion of sustainable consumption has focused on voluntary action-aimed informational strategies, while the effectiveness of structural strategies (target- ing the incentive and organizational structures of society), has been studied far less. Also, the ecological impacts of policies have been regrettably neglected, with most research evaluat- ing the effectiveness of policies at the level of desired behavioural changes rather than in terms of actual reductions in ecological impacts (Steg and Vlek2009).
There are many popular calculators available for measuring the impacts of individual consumption patterns on the“ecological footprint”(e.g., the ecological footprint published by the Global Footprint Network, Best Foot Forward, the Redefining Progress calculator by Berkeley University, the ecological footprint calculator from the Ministry for the Environment in Austria, etc.). They indicate tremendous potential for reducing the footprint through individual level efforts. It is not proven, though, that this potential is actually achieved. There is evidence, on the other hand, that rebound and backfire effects offset a part of any success in reducing footprints. Hence, the question should be raised whether people with high levels of awareness have lower ecological footprints and whether a workable conception of effective “environmental behaviour”exists at all. If not, we may be focusing on marginal action, while missing the real targets.
There are only a few, published empirical papers that measure the significance of attitude–
behaviour elements as compared to those of structural–contextual ones (Gatersleben et al.2002;
Thøgersen and Grønhøj 2010). This paper raises the question, how much of a reduction in carbon footprint can be achieved through merely increasing the environmental awareness of society without substantially affecting structural–contextual elements.
The Gap Between Attitudes and Action
A number of studies have already addressed the awareness–behaviour gap in different areas.
Kollmuss and Agyeman (2002) found that demographic factors, external factors (e.g., institutional, economic, social, and cultural), as well as internal factors (e.g., motivation, pro-environmental knowledge, awareness, values, attitudes, emotion, locus of control, responsibilities, and priorities) are significant antecedents of pro-environmental behaviour.
Zsóka (2005) identified five components of environmental awareness based on extant research: ecological knowledge, environmental values, environmental attitudes, willingness to act, and actual behaviour. However, these and other studies found that increased envi- ronmental awareness does not necessarily lead to pro-environmental behaviour. A number of studies suggest that the gap that exists between the components of environmental awareness is due to the complex nature of reality and economic-structural factors. Hence, consumers with a high level of environmental awareness may not act sustainably (see also Hofmeister- Tóth and Törőcsik1996; Marjainé Szerényi et al.2011; Rokeach1968; Sears et al.1985).
Barr et al. (2010), for example, found that environmental attitude is a significant factor in choosing travelling modes in everyday life, but not for holiday travel. The latter is much more influenced by socio-economic conditions—leading to a conflict between personal values and societal expectations. Gatersleben et al. (2002) compared energy use and pro- environmental behaviour and found that respondents who report more pro-environmental behaviour do not necessarily use less energy. Their paper is a rare example of relating impacts to behaviour.
Much research has found that ecologically concerned consumers belong mainly to the wealthier segments of population (see, for example, Balderjahn,1988). Yet financial enrich- ment of members of society will not ease the burdens on the environment if rebound and backfire affects offset the reductions reached.
According to Sanne (2002), consumers are locked into unsustainable lifestyles by circum- stances (e.g., by social norms) even though they are not necessarily willing and happy to act this way.“Some of these circumstances are deliberately created by other interests,and a policy to limit consumption must look for adequate means over a large and varied field…”
(Sanne2002, p. 273).
Thøgersen (2005) lists societal infrastructure, available product and service alternatives, constraints determined by nature, and scientific uncertainty among factors which constrain consumers in choosing their lifestyles. “Although individual consumers … have some discretionary power over their consumption pattern … limited abilities and restricted opportunities in combination with norms and incentives…make it difficult even for highly motivated individuals to do anything radical to improve the sustainability of their lifestyles.”
(Thøgersen2005, pp. 167–168).
Similarly, Jackson (2005) argues that changing behaviours is difficult because individual behaviours are deeply embedded in social and institutional contexts. Also, Hobson (2001) maintains that environmental awareness campaigns are not effective in promoting the public uptake of sustainable lifestyles. Policy cannot simply eliminate a wide array of social concerns.
Fuchs and Lorek (2005) urge a switch from an efficiency-based approach to sustainability—
which requires major changes in lifestyles. Understanding the potential in voluntary environ- mentalism compared to change in socio-economic determinants is of vital importance. While voluntary environmentalism is compatible with a neo-liberal economic outlook and the as- sumption of consumer sovereignty, this is not true for calls for deeper changes to the socio- economic system. This partly explains the failure and deficiency of sustainable consumption policy to date. “Sustainable consumption runs counter to dominant tenets of neo-liberal economics and conventional political objectives”(Cohen2006, p. 67).
Guagnano and his colleagues (1995) developed the ABC model of attitude, behaviour, and structural conditions of behavioural setting, which serves as a basis for the development of the model employed in this paper. According to the ABC model, environmentally sound behaviour depends not only on attitudes, but also on contextual factors. The attitude–
behaviour relationship is strongest when contextual factors are supportive, but neither too strong nor too weak. With highly supportive structural conditions, even individuals with negative attitudes tend to behave in an environmentally sound way, while highly restrictive conditions could discourage even individuals with highly positive environmental attitudes.
Thus, highly restrictive or highly supportive external conditions blur the differences between the behaviour of consumers with and without“green”attitudes. Among others, Ölander and Thøgersen (2006) have successfully applied this model in empirical research.
Similarly, Ölander and Thøgersen (1995) proposed a motivation–ability–opportunity–
behaviour model as a frame for studying consumer behaviour. Motivation leads to the required behaviour only if the actor commands the abilities and opportunities to carry out the expected behaviour. For example, recycling will not happen withoutthe proper infra- structure being made available to consumers.
In sum, the reviewed research emphasizes the importance of uncovering why actions and awareness are not always related. This article goes a step further and asks whether pro- environmental behaviour actually results in a reduction in ecological footprint. The model employed in this paper extends the Ölander–Thøgersen model by linking behaviour and
impacts. The relationship between pro-environmental behaviour and its ecological impacts is highlighted and scrutinized. In this paper, overall and situational conditions are assumed to influence not just the chance that pro-environmental behaviour takes place, but also the ecological impacts of that behaviour. This is a mostly un-researched field, concealing a lot of challenges and awaiting potentially new discoveries.
Introducing the BIG (Behaviour–Impact Gap) Problem
As described above, awareness gaps are described and studied in details in the literature.
Still, it appears that the lack of environmental progress cannot fully be explained by the factors mentioned in the previous section. Another gap seems to exist that goes beyond the consistency gaps usually described in the literature. Even when the required behaviour changes do happen, the results may lag far behind what was originally expected.
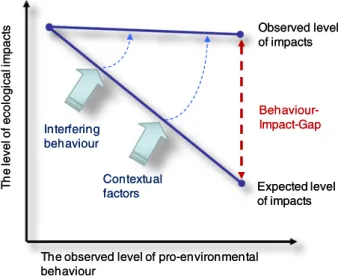
Inconsistencies can be found between the behaviour of consumers and the outcomes observed. For example, the amount of post-consumer recycled waste gained from recy- cling companies may fall far below what it should be, considering the recycling rate reported by consumer surveys. Moreover, the amount of waste European families produce is increasing despite their efforts to reduce it. The apparent mismatch between voluntary green action and its environmental impacts has not been properly scrutinized. I refer to this phenomenon as the behaviour–impact gap (BIG) problem. Figure 1 illustrates the BIG problem.
A BIG problem is confronted whenever the required behavioural change is achieved, but the observed ecological effect is minor or missing. For example, communication about the ecological superiority of a vegetarian diet may be efficient in inducing habit changes in consumers. Yet, the ecological footprint of the diet changes little, as many newly turned vegans substitute high-impact imported or exotic vegan foods like exotic fruits or humus for meat, offsetting most of the gains of their new diet.
The observed level of pro-environmental behaviour
The levelof ecologicalimpacts
Expected level of impacts Observed level of impacts
Behaviour- Impact-Gap Interfering
behaviour
Contextual factors
The observed level of pro-environmental behaviour
The levelof ecologicalimpacts
Expected level of impacts Observed level of impacts
Behaviour- Impact-Gap Interfering
behaviour
Contextual factors
Fig. 1 The behaviour–impact gap (BIG) problem
Tangible gains may lag behind expected gains for many reasons. For example, green feats are often partially offset by increased use of high footprint items. Imported organic food is a disputable alternative to non-organic local food. Consumers are often not properly informed about the ecological impacts of their pro-environmental behaviour. Thus the importance of waste separation may be exaggerated while the importance of eating less meat is under- valued and not understood properly.
Further, gains may be extinguished by contextual factors beyond the competence and influence of consumers. Both the Ölander and Thøgersen (1995) and Guagnano et al. (1995) models refer to the constraints that external conditions impose on the behaviour of consum- ers. We may expand this proposition beyond its original borders. Even when “desirable”
consumer behaviour does happen, external conditions play a major role in influencing the chance that expected ecological impact reductions do materialize. For example, consumers may switch to pellet-fed boilers as a renewable energy alternative. If the supply of pellets within the country is insufficient to meet the increased demand, imported pellets, perhaps transported over long distances at high ecological cost, are sold on the market. The carbon impacts of trans-boundary transportation may offset most of the gains of using a renewable energy resource.
The ecological impact of eco-labelled products is sometimes very similar to that of the standard alternative options. For example, branded organic baby food with an EU organic food label is available in Hungary. There is also a cheaper alternative available without the organic logo. Both brands are prepared in the same plant from the same ingredients as producers are aware of the strict food safety regulations for baby food and would rather buy organic ingredients than take the risk of violating the limits for chemical residues. Thus eco- labelling can be used as a market segmentation tool, allowing environmentally aware consumers to pay more for the“green”product, thus maximizing producer revenues. The same is true for paper made of secondary raw materials. In Hungary, there is no cellulose production, so all paper (except for a few percent of special purpose paper) is made from recycled material. White paper goes through a de-inking process to get rid of the ink. A lower quality grey alternative at a cheaper price is available that does not go through the de- inking process. A similar lower quality grey alternative with an eco-label is available at a high price for consumers willing to pay for green product features. In these cases, switching to eco-products does not make much difference in terms of ecological impact. Eco-labelling is used for market segmentation of green customers, but the labelled products are not significantly better, from an environmental perspective, than the mainstream version.
Consumers may choose easy-to-do but marginal actions in the target field or act only occasionally in the expected manner. They may feel “green” because they recycle, but oppose changing their diet or reducing their car use, although the latter are more influential determinants of total footprint. Environmental actions may serve as green means for relieving our guilty ecological consciences without actually or genuinely reducing impacts.
Most“environmental awareness”campaigns allow for this kind of modest self-deception, as political acceptability overrules ecological wisdom. Consumers may also overstate their practice of environmental behaviour. However, this should probably be regarded a survey bias rather than a behaviour–impact gap.
Interfering behaviour in non-target-field areas may also influence the ecological impacts of behaviour. Over-enthusiasm in separating waste, accompanied by rare enthusiasm in buying articles made from recycled material may lead to oversupply of separated waste, and make it uneconomical for it to be recycled. This is like two mules pulling in opposite directions, one mule being pro- and the other one being anti-environmental behaviour.
Knowledge can also be limited or faulty, as suggested by Verhallen & Pieters (1984) and
Ölander and Thøgersen (1995), leading to inefficient behaviour that also decreases the efficiency of other people’s behaviour (e.g., alien materials being mistakenly placed in recycling containers, leading to the mixing of waste streams).
The same behaviour may embrace quite different levels of ecological impacts depending on contextual factors. Energy savings or recycling behaviour reduces the ecological impacts of the wealthy more than that of modest income families as their initial consumption levels are different. Infrastructural possibilities also influence the impacts of the same kind of environmental behaviour. Driving a car to distant recycling sites may eat up some of the gains of recycling behaviour for certain consumers, but this may not apply to others.
Further, money saved from energy efficiency or other environment-related activities may create additional disposable income and increase further spending (the well-known rebound effect). Similarly, a hybrid or electric car may cause the driver to feel that driving is not polluting, thus encouraging extra mileage.
The BIG problem is meaningful both at an individual and at a group level. One may act inconsistently concerning different environmental issues, as described before, but the be- haviour of other people may also work against or interfere with the success of those who are environmentally aware. Some environmental actions are successful only if at least a certain number of consumers act the same way. This is especially true when expensive infrastructure must be built to support pro-environmental behaviour (e.g., bicycle routes, recycling sites).
The BIG problem means that even when consumers act in an environmentally aware manner, their carbon footprint or ecological footprint may improve only slightly, if at all.
Wishful thinking about prospective gains from pro-environmental behaviour is common, which is actually more a policy-making problem than a consumer behaviour problem.
Operationalizing the Ecological Impact of Environmental Behaviour
Ölander and Thøgersen (1995, p. 360) state that,“consistency between attitudes and behaviour can be expected only if the behaviour depends solely on the actors’free choice.”Steg and Vlek (2009) note that structural strategies are probably more effective in promoting pro- environmental behaviour than are information strategies. To this can be added the fact that the impacts of environmental behaviour may be fully or partially offset or multiplied by contextual and interfering behavioural factors. Hence, the contribution of environmental behaviour versus socio-economic constraints in controlling ecological impacts is a research question of utmost importance. Among other things, their relative contribution determines the potential ecological impact of awareness raising campaigns and voluntary environmentalism.
This section gives an operational definition for measuring the impact of environmental awareness and tracing if a BIG problem exists in practice.
The difference between the ecological impact of consumers acting“green”and consum- ers acting“brown”can be used as a proxy for pinpointing the ecological impact of pro- environmental behaviour. The greater this difference is, the more potential can be attributed to awareness-based changes in behaviour. Guagnano and his colleagues’propose that the highest influence of attitudes on pro-environmental behaviour being at moderate contextual support level does not necessarily hold here. A highly supportive or highly negative context would change the occurrence of “green” and “brown” behaviour, but not necessarily influence the difference in ecological impact of established behavioural patterns.
Fundamentally, a categorical difference between the ecological impacts of pro- environmental behaviour and environmentally disinterested behaviour is expected. Hence, if no statistically significant difference is found, this would indicate a BIG problem.
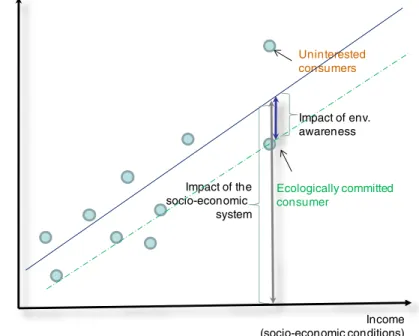
As indicated by previous studies (see Lenzen & Murray,2001), the role of income is overwhelming in driving the ecological footprint, so high-income“green”consumers may have higher footprints than their less fortunate peers from the “non-green” group. Thus, efforts must be taken to control for the effects of income in order to avoid simplified cut-and- dried findings, such as that“income matters in the ecological footprint.”Rather, we may compare the footprints of“green”and“brown”consumers to the averages of their income group.“Green”consumers may be expected to have significantly lower ecological impacts than“brown”consumers of similar household income (see Fig.2).
The horizontal axis shows the socio-economic configuration, an auxiliary variable for which is“income.” “Socio-economic configuration”refers to the socio-economic determi- nants of lifestyle. Both income and culture have a strong influence on how we live our lives:
whether we buy a large house, a large car, or spend money on cultural activities. The term socio-economic configuration encompasses income, culture, and social segment. Income is used as a proxy for the impacts of institutional, economic, social, and cultural factors. This might seem like an oversimplification of the problem. Still, when the relationship between ecological footprint and income and demographic data was analysed for Hungary, income proved to be such an influential factor that it pushed everything else into the shade.
Demographic factors (e.g., gender, age, education, or other socio-economic characteristics of a population) do have impacts, but these are indistinguishably small in relation to income.
We suppose that cultural factors may play a very important role in some cultures.
The vertical axis shows the environmental burden of consumption, which is predicted to increase as income rises. Thus, an environmentally committed consumer might have a higher ecological footprint than a less committed peer in a lower-income bracket. Still, individual attitudes towards the environment are predicted to have at least some impact. It may be supposed that an ecologically committed consumer burdens nature less than a less committed one in the same income group.
Uninterested consumers
Ecologically committed consumer
Income (socio-economic conditions)
Ecologicalfootprintof consumption
Impact of env.
awareness
Impact of the socio-economic
system
Fig. 2 Pro-environmental behaviour and its ecological impacts
The contribution of voluntary behaviour and the part accounted for by socio-economic factors in determining the ecological footprint are focal points of our study. The regression line for the ecological impact of“green”consumers is supposed to lie below the line for all consumers. The greater the distance, the bigger the impact, and supposedly greater is the potential for voluntary pro-environmental behaviour. In the extreme case, the “green”
regression line is parallel with the horizontal axis. This would indicate perfect compensation for the impact of the socio-economic determinants: ecological problems are eliminated through voluntary changes in lifestyle. If the two lines are identical, on the other hand, there is no impact of voluntary environmentalism: a BIG problem is revealed in its extreme form.
Thus, the main hypothesis of this paper is that “green”consumers have a lower than average ecological footprint. A BIG problem is identified whenever the difference in the ecological impacts of“green”and uninterested consumers of similar income is not statisti- cally significant or falls far below reasonable expectations.
Framework for the Empirical Research
The empirical research reported in this paper scrutinizes the ecological impact of environ- mental behaviour by attempting to answer the following research questions:
& How much deviation from the income-induced carbon footprint is likely to occur when
citizens“act green?”
& How big is the difference between the carbon footprints of “green” and “brown”
consumers?
& Is the spending structure of“green”consumers dissimilar to that of the“brown”ones?
Based on Figure2, the following interlinked research hypotheses were developed:
& Ecologically committed consumers (“green” consumers) have a significantly lower
ecological footprint than those of non-committed consumers (“brown” consumers) in the same income bracket.
& The average deviation from the mean ecological footprint level for the same income
group will be negative for“green”consumers and positive for“brown”ones.
& Ecologically committed behaviour isnotcapable of offsetting the full impact of a higher
income: higher-income ecologically committed consumers have bigger carbon footprints than lower-income indifferent or brown consumers when the income difference is above a certain threshold.
The methodology used combines a representative survey of 1,012 respondents and a macro-statistic analysis based on Eurostat data. Environmental behaviour and the ecological footprint are the major variables in the study that need to be operationalized.
In 2010, a survey was carried out in Hungary in order to collect data on the spending structure of consumers, their consumption patterns, their environmental attitudes, demo- graphic data, and life satisfaction issues. The survey was financed through the Norwegian Financial Mechanism. Interviewing was carried out by TARKI, one of the largest Hungarian professional opinion polling companies. The survey was collected from a representative probability sample (selected in multiple stages with proportional stratification), N01,012.
All adults with an address in Hungary had equal probability of becoming part of the sample.
All Hungarian regions were included in the sample with a total of 70 localities. First a sample of settlements was drawn. Then the random walk technique was applied to select the
dwelling. Finally, one person was chosen within a dwelling to be interviewed, using the Leslie Kish key. The survey sample was representative of the population aged 18+ in terms of sex, education, type of settlement, and educational background. The questionnaire was carefully piloted on a smaller sample before the survey.
A compound-based method was used to calculate the ecological footprint of consumption activities, which comprise a critical part of total ecological footprint. Food, transport, and household energy were considered important contributors, so respondents were asked detailed survey questions regarding their daily diets, mobility habits, and energy use.
Specifically, survey results were used to:
& Create variables for pro-environmental behaviour.
& Create the food, energy, and transport components of the bottom–up ecological footprint
based on detailed questions on diet, household energy use, and travelling habits.
& Create the top–down ecological footprint variables based on spending on food, energy,
mobility, clothing, culture, and the ecological footprint per spending data gained from macro-statistic analysis. (SeeAppendixfor the details of the calculation).
& Collect demographic and income variables to show the impact of the socio-economic
system.
Calculating the Hybrid Ecological Footprint
The ecological footprint was thus calculated twice, using a bottom–up and a top–down approach. Since the sample was representative, major survey statistics were assumed to be consistent with official statistics. Validity testing was carried out for both approaches in each component using independent official consumption statistics and ecological footprint data for Hungary. The approach that produced more valid results was picked for further analysis.
For example, food related consumption data in natural units are available for income deciles in the National Statistics Office (consumption in kilograms, litres, etc., for almost 80 categories, including bread, cereals, beef, pork, etc., by income deciles). Spending data on food is also available for income deciles. The ecological footprint was calculated for the natural unit data using the EF (ecological footprint) data for food published by the Global Footprint Network for Hungary. Physical unit macro-statistics suggests a 34% bigger ecological footprint for food consumed by the highest income deciles when compared to the lowest income deciles. A top–down approach based on food spending data, however, would result in a twice the EF for the wealthiest as compared to the poorest. This result indicates a problem with the top–down approach, suggesting that high spending on food is partly a result of spending on better quality rather than on more food. Thus, a bottom–up approach seems to produce more valid results in case of food.
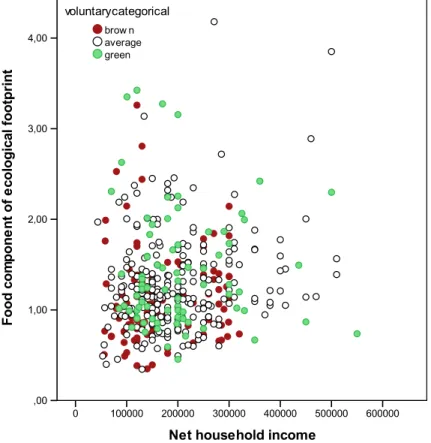
The ecological footprint for food was calculated according to the Global Footprint Network standard as the sum of cropland footprint and carbon footprint. Empirical results from the study indicate a very loose association between the food component of ecological footprint and household income. A one-way independent groups analysis of covariance indicates a significant effect of income (F06.756;p00.01), but it accounts for only 1.9% of the total variance of food footprint. Being wealthy means eating high-quality food rather than eating much more food (Fig.3). Green consumers are featured by significantly higher food footprint than brown ones, 1.43 ha and 1.14 ha respectively, but when greenness is adjusted for household income, it accounts for only 2.5% of the total variance of food
footprint. The ecological footprint is impacted by other income irrelevant factors such as the weight of the respondents (heavier people are assumed to eat more), or the activity level, age, and gender of the individual interviewed. Vegetarians make up only 0.7% of the sample.
The mobility footprint was calculated using detailed data on travelling (means of travel as well as kilometres and time travelled) and from individual spending on mobility using EF/
spending data from the top–down approach. The top–down approach produced higher mileage and ecological footprint estimates and gave data that were more consistent with official statistics on mobility than the bottom–up approach. Systematically, people seemed to underestimate the distances they travelled per year, although they provided more reliable guesses about their spending on mobility. It seems that questions like,“how many km do you travel a week?”are not answered in a reliable way, not to mention non-regular holiday mobility questions that are even trickier to answer.
For energy use, spending-based estimates were definitely superior to other kinds of estimates. Energy spending is closely related to energy usage, but provides an easier and straightforward proxy, which is free from any bias and exaggeration of energy savings behaviour. Energy saving behaviour should result in reduced bills, provided it is not sporadic and occasional but systematic and effective. Spending was thus used as a proxy for energy- usage-related behaviour.
Other components, including clothing and footwear, recreation and culture, health, and household, were based on a spending-based approach for practical reasons. They are small
Fig. 3 Net household income and the ecological footprint of food consumption
components when compared to the previous ones, but valid estimates would require more detail in the survey instrument than was possible. Keeping the survey instrument a reason- able length did not allow for much space for minor items.
In summary, both ecological footprint and carbon footprint were calculated for each consumption category using a top–down approach. A component-based method was utilized to calculate the ecological footprint and carbon footprint of major footprint contributors, including food, mobility, and household energy use only. The latter two, however, produced less consistent information when compared to independent statis- tics than the top–down approach, so top–down estimates were preferred for these items.
Measuring Pro-environmental Behaviour
Consumers act on the basis of their perceptions rather than on the basis of scientific definitions of sustainable consumption (Schiffman et al.2008). Thus a practical approach was followed when assessing the environmental awareness of end users. The method- ology utilized is the same as that used by the Eurobarometer when carrying out European-wide surveys. Hopefully, the common perception of environmental awareness as transmitted by the media—which may have a more substantial influence on human behaviour than pure science—was captured this way. It is understood that this approach may result in biased estimates as perceptions may vary across countries and social segments. Still, such errors are considered minor when compared to other applicable methodologies.
The environmental behaviour scale was based on the eight components listed by the Eurobarometer 217 and 295 surveys. Questions were asked about actual behaviour practiced during the previous month, namely:“Have you done any of the following during the past month for environmental reasons?”The eight components were:
1. Chosen an environmentally friendly way of travelling 2. Reduced consumption of disposable items
3. Separated most of their waste for recycling 4. Cut down on water consumption
5. Cut down on energy consumption
6. Bought environmentally friendly products marked with an environmental label 7. Chosen locally produced products or groceries
8. Used their car less
People were then assigned to three different groups based on the range of their actions:
consumers were labelled“green”when they reported taking at least four of the actions above during the month prior to the interview. Those people who were completely inactive and uninterested in any kind of environmental activities received a“brown” label.“Average” consumers acted green in one to three of the fields listed above. The categorization is thus based on environmental actions reported by the respondent rather than on more general and subjective attitude questions.
Of valid responses, 56.9% fell into the “average” consumer category while 21.5% of people were categorized as being“brown”and 21.6% as“green.”In this sample the share of
“brown”consumers was much higher than in the Hungarian sample of the Eurobarometer 295 survey (9%) carried out in early 2007. Future research should reveal the reason(s) for this difference, but the economic crisis seems a likely explanation.
Survey Results
Not surprisingly, the hybrid ecological footprint analysis showed a close correlation between the ecological footprint of consumption and income. Income also correlated with the carbon footprint and with most individual elements of the ecological footprint. There were only three exceptions. As mentioned earlier, the ecological footprint of food is weakly related to income. In addition, the ecological footprints of health-related products and services do not correlate with income and the same is true for the ecological footprints of household items.
The former can be explained by the relatively high spending of the elderly who are characterized as having lower incomes and impaired health.
Environmentally aware consumers are expected to have lower ecological footprints than predicted by their income level. However, this assumption does not hold in our survey, no matter what aspects of ecological footprint are studied. Neither the ecological footprints nor the carbon footprints of “green,” average, and “brown” consumers in the same income bracket differ significantly.
Figure4presents a map of ecological footprints for the three segments in terms of pro- environmental behaviour. As it appears, no difference can be identified in the ecological footprints of“green”consumers, compared to the other two groups. This is counter to what was hypothesized—at least some effect from pro-environmental behaviour was expected.
Other interesting findings revealed in Figure 4 include that “brown” consumers are missing from high-income families. Beyond about 350000HUF of monthly net income, this
Fig. 4 Ecological footprint of green, brown, and average consumers
category disappears, indicating that wealthy families are at least neutral towards environ- mental issues. On the dark side, underprivileged families with low incomes tend to be
“brown”or average in their behaviour, but they still have lower ecological footprints than wealthy families.
However, Figure4does not indicate reduced footprints for those who act“green.”There does not seem to be any association between footprint and acting “green.” This finding contradicts our preliminary hypothesis that environmental attitudes manifested in actual behaviour should result in at least some reduction of ecological footprint. This is a clear example of a BIG problem.
A covariance analysis was run with income as covariate, “greenness” as grouping variable and total ecological footprint as dependent variable. The effect of the grouping variable was predicted to be negative for the green consumer group, provided they have a lower footprint than that predicted by their income. In fact, the estimated marginal means for
“brown,” average, and “green” consumers are 3.1, 3.3, and 3.4, respectively, and the difference between the three groups is not statistically significant after controlling for income (F01.561;p0.211).
The range of ecological footprints at a given level of income is quite wide, as revealed by Figure4. Hence, individual actions and individual consumption patternsdomatter: one can double or halve ones ecological footprint depending how one consumes. There are green dots far below the regression line in our sample, indicating that reduced ecological impacts occur at all levels of income. Thus, sustainable consumption is possible at an individual level, but it is not typical to the whole sample. It seems that ecological awareness manifested in actions such as separating waste or buying energy-efficient household appliances does not lead to a reduction in“overall”consumption impacts.
Measuring Partial Success in Pro-environmental Behaviour
The conclusions of this study coincide with Gatersleben et al. (2002), but contradict the findings of various other studies. For example, Thøgersen and Grønhøj (2010, p. 7738) found that “household members’effort to save electricity is as important for household electricity consumption as the structural characteristics reflected in the size of the home.”A deeper analysis was thus performed in order to reveal possible correlations between pro- environmental behaviour in specific fields and ecological impacts.
The energy footprint was decomposed into the electricity footprint and the heating footprint. Pro-environmental behaviour proved to negatively impact electricity bills, once variation in income was controlled for. Hence, pro-environmental behaviour does matter.
However, in the absence of controlling for income, green consumers still use more electricity as this correlates with income and consumers with pro-environmental behaviour tend to belong to more well-off families—on average. The electricity bill is, however, accountable for only 40% of the total energy spending of households in Hungary and contributes even less to the energy footprint, taking into account that the contribution of carbon neutral nuclear and renewable energy amounts to over 50% of electricity production. The share of renewables in heating energy is only 9%. Hence, roughly 75% of the energy footprint is determined by heating-purpose fuel consumption. Fuel consumption for heating purposes seems to be uncorrelated with environmental awareness but is dependent on socio-economic conditions such as home size, or physical condition and age of the building, etc.
No-regret or low-regret options, such as stand-by killers or energy-efficient bulbs, are more common regarding electricity saving than in the case of use of heating energy (Csutora
and Zsóka 2011). Major options either require substantial investments in supplementary insulation, replacement of windows, and doors or major changes in comfort level and personal habits in terms of reducing heating temperature on the premises, or turning off heating in temporarily unused rooms. Interestingly, accommodating to a lower heating temperature is a change of habit more frequently rejected by environmentally aware con- sumers than by those uninterested and labelled“brown.”This is perhaps due to the fact that a difficult financial situation might force“brown”consumers to reduce their comfort level in order to save money, while middle class“green”consumers prefer to invest in supplemen- tary insulation whenever they can afford it.
Hence, heating costs are much more dependent on economic and structural conditions than on the intentions and behaviour of individuals. The size of the house does not correlate with income in Hungary. Mainly, people buy a house or apartment only once or twice in their lifetime, or inherit them from parents. They hold on to their homes and sell them only by necessity. Moreover, in the countryside households are characterized by having a less than average income, but an above average size of house. Thus the size of the house does not necessarily relate to the economic situation of the household.
Overall, there seems to be a potential for reducing the electricity footprint by changing everyday behaviour, while there seems to be more potential for reducing heating footprints through one-time investments in retrofitting houses. The overall energy footprint is, how- ever, dominated by the heating component.“Brown”or disinterested consumers sometimes act in a more pro-environmental way than “green” consumers, especially when a modest lifestyle results in both financial and environmental savings, but these actions are driven by coercive economic conditions rather than values.
Ecological impacts of mobility are better studied using the carbon footprint indicator than the ecological footprint indicator. The reason is that the ecological footprint indicator includes the footprint of infrastructure, roads, railways, etc., the construction, use, and maintenance of which are out of the direct control of individual consumers. Car use indirectly requires the establishment of highways and related infrastructure; still, consumers tend to think in terms of fuel use when thinking of the external impacts of road travel. The carbon footprint is more closely related to fuel use than the ecological footprint, making it more likely that the ecological impacts of pro-environmental behaviour can be tracked.
For transport, the footprint of “green” consumers is slightly smaller than that of the average consumer. The transport footprint of“browns”is even more favourable, however.
This could be due to economic pressure, as also reflected in“browns”being less happy and satisfied with their lives than people in the other two groups and more dissatisfied with their standards of living, according to our data.“Green”consumers, however, act on a voluntary basis. So there is some evidence that voluntary“green”mobility reduces the carbon footprint and ecological footprint compared to average consumers, although browns acting under economic pressure have an even lower footprint score, even when adjusted for income level.
The same level of income may represent a different level of pressure for families—depend- ing on the number of children, location of the house, credit and mortgage situation, etc., so the economic situation may keep consumers in various income deciles under different levels of pressure. Families under high pressure may tend to think “brown” and unhappily act
“green.”
There were only eight vegetarian respondents in the sample, so the impact of vegetari- anism on total ecological footprint could not be assessed statistically. These eight people had a lower ecological footprint than meat eaters with a comparable income. However, they did not differ from the average regarding their level of pro-environmental behaviour, suggesting that vegetarianism may not be closely associated with a pro-environmental stance in
Hungary—it is rather a healthy diet or animal welfare issue. In Hungary, eating less meat gets much less emphasis in the advocating of pro-environmental behaviour than it deserves.
Hence, the findings suggest that pro-environmental behaviour does have an effect on the ecological footprint of consumers in certain areas (such as travelling or electricity consump- tion), but these impacts are relatively insignificant compared to the total ecological footprint.
Thus, environmental awareness is capable of influencing consumer behaviour, but its positive impacts seem to be within the range of statistical error when compared to the total footprint.
Conclusions
Altering ecologically destructive consumption patterns to lifestyles more compatible with the natural surroundings and within ecological limits is of paramount importance (Moll et al.
2005). Still, even when environmental awareness galvanizes green actions, it does not necessarily put a stop to increasing consumption. This results in the prevailing behaviour–
impact gap between environmental behaviour and the ecological impacts of behaviour. A BIG problem was identified when measuring the relationship between pro-environmental behaviour versus socio-economic determinants of life and the ecological impact of con- sumption. The study found no statistically significant differences between the overall ecological footprints of “green” consumers and “brown” consumers. Pro-environmental behaviour was coupled with only a small reduction in ecological footprint in specific areas.
Different theoretical reasons why the BIG phenomenon comes into existence were proposed in this paper, but further research is needed. Probably, more emphasis should be placed on communicating the ecological consequences of consumption habits. Raising awareness may provoke spectacular green activity but it is apparently ineffective at changing consumption impacts. Communication strategies could be mis-targeted if they promote marginal pro-environmental activities that are perhaps less politically sensitive. Hence, a possible reason for the BIG phenomenon is that political acceptability dominates over ecological effectiveness. Perhaps contextual factors beyond the control of consumers work against the success of voluntary environmentalism. Perhaps a deeper re-structuring of the socio-economic determinants of life, including the culture of consumption, is necessary.
Building purely on voluntarism and awareness-raising appears either inadequate or ineffi- cient at reducing ecological impacts. The rebound effect may also contribute to the apparent lack of effects of individual behaviour. One may do something to relieve one’s ecological guilt, but compensate for these achievements by consuming more. When individuals are involved in marginal green actions while missing the big picture, the environment falls victim to so-called escape strategies (Csutora2011).
Although no statistical relationship between voluntary actions and ecological footprint was found at the macro level, there is still a place for individual action. Green dots below the regression line indicate that some individuals are successful at reducing their ecological impacts while acting“green.”Hence, pro-environmental behaviour should not be discarded as superfluous or irrelevant. One can make a difference by being a green dot below the regression line, even though most people would not do the same.
Acknowledgements I gratefully acknowledge the TÁMOP-4.2.1/B-09/1/KMR-2010-0005 project for financing this research and the Norwegian Financial Mechanism and the HU0056 project for making their survey data available for this study. I am also thankful to two anonymous reviewers for their helpful comments and suggestions on an earlier version of this paper and to the editors, who provided great assistance during the review process.
Appendix
Calculating the Ecological Footprint per Spending Unit from a Top–Down Approach A combination of carbon footprint data and symmetric input–output tables (SIOT) are used in order to calculate the total carbon footprint for consumption categories. Ecological footprint per spending unit is then derived from an environmentally extended input–output analysis.
Bicknell et al. (1998) were the first to introduce generalized input–output analysis, incorporating it into the methodology of ecological footprint calculations. The method is based on combining macro-economic input–output tables with land multipliers representing the environmental input in the system. The suggested environmentally extended input– output analysis proved to be extremely useful as it was able to capture direct as well as induced environmental impacts throughout the supply chain, thus showing the environmen- tal consequences of consumption. The issue of responsibility of consumption activities for pollution could be raised and a meaningful answer could be provided.
Lenzen and Murray (2001) revised the Ecological Footprint method. They made mod- ifications to the original concept in order to make it suitable for input–output analysis.
Wackernagel and Rees (1996) also combined Ecological Footprint accounting with a monetary input–output analysis. Tukker and Jansen (2006) produced a review of studies focusing on extended environmental impacts, which used the input–output analytical meth- odology. They concluded that the major part of environmental impacts is associated with the following consumption categories: housing, transport, and food. Kerkhof et al. (2009) came up with a novel approach in their analysis of household expenditures in the Netherlands;
they were the first to make a consistent analysis of expenditure elasticity in four impact categories. This analysis allows the examination of the elasticities by regression analyses and a comparison at the product level. The study deals with household expenditure, a main driver of energy requirements and environmental impact (Lenzen et al. 2004, Pachauri 2004).
Using the top–down technique of input–output analyses, the first step utilized by Kerkhof et al. (2009) was quantification of the impact intensities of household goods and services.
Following this, results were derived from a combination of household consumption data.
Indirect impact intensities were calculated by means of environmentally extended input–
output analysis. The study analysed annual expenditure on six aggregate product groups by equivalent expenditure deciles, showing that high-expenditure households spend more money on“development, leisure, and traffic”and on“house,”but with growing expenditure the demand for food decreases relatively. It is thus important to examine how consumption patterns change according to level of expenditure.
In a recent study by Druckman and Jackson (2009), the authors raised the question how much CO2 is attributable to different kinds of needs and desires and to what extent is decoupling occurring between household expenditure and CO2 emissions. The study aimed to define the carbon footprint of different segments of UK society compared to each other.
EUROSTAT (2008, pp. 481–489) and OECD have taken up the methodology and EUROSTAT currently publishes emissions of greenhouse gases and air pollutants induced by final use of products as a result of environmentally extended input–output analysis. The data provided by EUROSTAT refer, however, to the European Union as a whole only; data for individual countries are not provided. Thus the author followed the methodology suggested by the literature and EUROSTAT and calculated the ecological footprint/spending and carbon footprint/spending ratio for Hungary.
The methodology is based on combining symmetric input–output tables taken from EUROSTAT accounts and ecological footprint data. The ecological footprint data for Hungary were drawn from the country report of the Global Footprint Network. Their ecological footprint calculation has the advantage of taking into account the embedded carbon in imported goods, thus identified carbon by import rather than production of goods.
This way a hybrid economic-environmental national account was produced that serves as a basis for defining the Leontief inverse and the ecological footprint requirement of consumption. Leontief inverse captures induced impacts throughout the supply chain and permits the calculation of total requirements embracing both the direct and indirect input requirements of consumption.
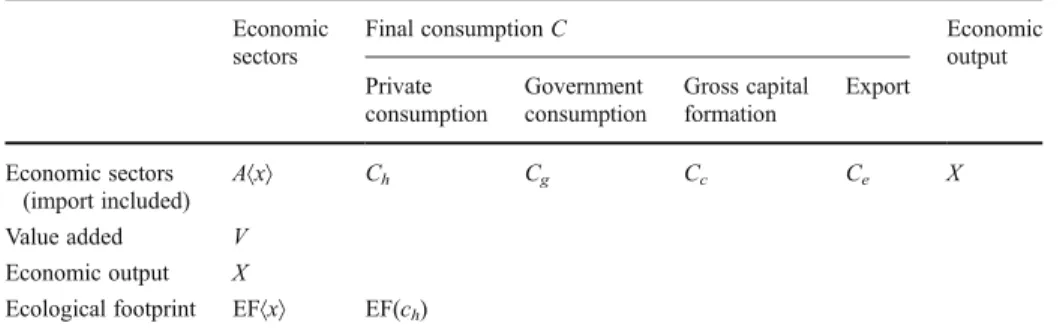
The environmentally extended hybrid input–output tables are of the following form:
A(x) is a 59×59 matrix, called a transaction matrix.
Calculation followed the following steps:
1. Production of an environmentally extended input–output table that complements the industry transaction matrix A with industry aggregate ecological footprint data. This step requires disaggregating all ecological footprint components, including crop foot- print, grazing footprint, fishing footprint, carbon footprint, and built-up area footprint into sectoral data.E(x) is produced as a result of this step. EF(ch) includes the direct emissions of households mainly from heating and mobility activities, and built-up land.
2. Calculation of the physical coefficient vector (EF(x)/X).
3. Calculation of the Leontief inverse matrix, (I−A)−1, using an industry-by-industry symmetric input–output matrix from the EUROSTAT database.Iis the identity matrix.
4. Calculation of the total intensity vector as the product of the Leontief inverse matrix and the physical coefficient vector. EF(x)/X×(I−A)−1
5. Calculation of total EF requirements of households by multiplying the diagonal inten- sity vector and the final demand by household vector. EF(x)/X×(I−A)−1×C. The multi- pliers for primary inputs are multiplied with a matrix of final demand by category to assess the direct and indirect primary input requirements (this case ecological footprint) for the various categories of final demand.
6. Reallocation of final demand into consumption categories using national statistics, COICOP tables, and CPA classification of Eurostat. COICOP is the classification system of United Nations, short for Classification of Individual Consumption Purposes that classifies consumption categories into final purposes. Thus it gives a much more aggregate and useful functional categorization of consumption activities
Table 1 Structure of environmentally extended input–output tables Economic
sectors
Final consumptionC Economic
output Private
consumption
Government consumption
Gross capital formation
Export
Economic sectors (import included)
A〈x〉 Ch Cg Cc Ce X
Value added V
Economic output X
Ecological footprint EF〈x〉 EF(ch)
than the 59 sector or product group matrix of NACE and CPA used by EUROSTAT.
NACE refers to the categorization of sectors while CPA to categorization of products.
Both product-by-product and industry-by-industry SIOT (symmetric input–output tables) are available in the EUROSTAT system.
7. Adding direct ecological impacts EF(ch) of households to the table and reallocate them to final purposes according to COICOP. These include direct greenhouse gas emissions from combustion of fuel for heating or mobility, and built-up land.
8. Calculation of the ecological footprint for individual consumers, based on individual spending data derived from the representative survey and the EF per spending data gained from the statistical analysis described above.
References
Balderjahn, I. (1988). Personality variables and environmental attitudes as predictors of ecologically responsible consumption patterns.Journal of Business Research, 17, 51–56. doi:10.1016/0148-2963(88)90022-7.
Barr, S., Shaw, G., Coles, T., & Prillwitz, J. (2010).“A holiday is a holiday”: Practicing sustainability, home and away.Journal of Transport Geography, 18, 474–481. doi:10.1016/j.jtrangeo.2009.08.007.
Bicknell, K. B., Ball, R. J., Cullen, R., & Bigsby, H. R. (1998). New methodology for the ecological footprint with an application to the New Zealand economy.Ecological Economics, 27, 149–160. doi:10.1016/
S0921-8009(97)00136-5.
Cohen, M. J., & Murphy, J. (2001).Exploring sustainable consumption: Environmental policy and the social sciences. Amsterdam: Pergamon.
Csutora, M. (2011). From eco-efficiency to eco-effectiveness? The policy-performance paradox.Society and Economy, 33, 161–181. doi:10.1556/SocEc.33.2011.1.12.
Csutora, M., & Zsóka, Á. (2011). Maximizing the efficiency of greenhouse gas related consumer policy.
Journal of Consumer Policy, 34, 67–90. doi:10.1007/s10603-010-9147-0.
Druckman, A., & Jackson, T. (2009). The carbon footprint of UK households 1990–2004: A socio- economically disaggregated, quasi-multiregional input–output model.Ecological Economics, 68, 2066– 2077.
EUROSTAT (2008)Eurostat manual of supply,use and input–output tables, Luxembourg: Office for Official Publications of the European Communities 2008 edition, 589 p.
Fuchs, D. A., & Lorek, S. (2005). Sustainable consumption governance: A history of promises and failures.
Journal of Consumer Policy, 28, 261–288. doi:10.1007/s10603-005-8490-z.
Gatersleben, B., Steg, L., & Vlek, C. (2002). Measurement and determinants of environmentally significant consumer behavior.Environment and Behavior, 34, 335–362. doi:10.1177/0013916502034003004.
Guagnano, G. A., Stern, P. C., & Dietz, T. (1995). Influences on attitude–behavior relationships: A natural experiment with curbside recycling. Environment and Behavior, 27, 699–718. doi:10.1177/
0013916595275005.
Hofmeister-Tóth, Á. & Törőcsik, M. (1996):Fogyasztói magatartás, Nemzeti Tankönyvkiadó, Budapest.
Hobson, K. (2001). Sustainable lifestyles: Rethinking barriers and behaviour change. In M. J. Cohen & J.
Murphy (Eds.),Exploring sustainable consumption: Environmental policy and the social sciences(pp.
191–208). Amsterdam: Pergamon.
Jackson, T. (2005). Motivating sustainable consumption: A review of evidence on consumer behaviour and behavioural change.Energy & Environment, 15, 1027–1051. doi:10.1260/0958305043026573.
Kerekes, S., & Kiss, K. (2000). Basic environmental requirements for EU accession: An impact study on Hungary.Environment, Development and Sustainability, 2, 59–74.
Kerkhof, A. C., Nonhebel, S., & Moll, H. C. (2009). Relating the environmental impact of consumption to household expenditures: An input–output analysis.Ecological Economics, 68, 1160–1170. doi:10.1016/j.
ecolecon.2008.08.004.
Kollmuss, A., & Agyeman, J. (2002). Mind the gap: Why do people act environmentally and what are the barriers to pro-environmental behavior?Environmental Education Research, 8, 239–260.
Lenzen, M., Dey, C., & Foran, B. (2004). Energy requirements of Sydney households.Ecological Economics, 49, 375–399. doi:10.1016/j.ecolecon.2004.01.019.
Lenzen, M., & Murray, S. A. (2001). A modified ecological footprint method and its application to Australia.
Ecological Economics, 37, 229–255. doi:10.1016/S0921-8009(00)00275-5.
Lenzen, M., Wiedmann, T., Foran, B., Dey, C., Widmer-Cooper, A., Williams, M., & Ohlemüller, R. (2007).
Forecasting the ecological footprint of nations: A blueprint for a dynamic approach, Sydney, Sydney University.
Marjainé Szerényi, Z., Zsóka, Á., & Széchy, A. (2011). Consumer behaviour and lifestyle patterns of Hungarian students with regard to environmental awareness.Society and Economy, 33, 89–110.
Moll, H. C., Noorman, K. J., Kok, R., Engström, R., Throne-Holst, H., & Clark, C. (2005). Pursuing more sustainable consumption by analyzing household metabolism in European countries and cities.Journal of Industrial Ecology, 9, 259–275. doi:10.1162/1088198054084662.
Ölander, F., & Thøgersen, J. (2006). The A-B-C of recycling.European Advances in Consumer Research, 7, 297–302.
Ölander, F., & Thøgersen, J. (1995). Understanding of consumer behaviour as a prerequisite for environmental protection.Journal of Consumer Policy, 18, 345–385. doi:10.1007/BF01024160.
Pachauri, S. (2004). An analysis of cross-sectional variations in total household energy requirements in india using micro survey data.Energy Policy, 32, 1723–1735. doi:10.1016/S0301-4215(03)00162-9.
Rokeach, M. (1968).Beliefs,attitudes,and values: A theory of organization and change. Retrieved 3/21/2011, 2011, fromhttp://www.getcited.org/pub/101276424.
Sanne, C. (2002). Willing consumers—Or locked-in? Policies for a sustainable consumption. Ecological Economics, 42, 273–287. doi:10.1016/S0921-8009(02)00086-1.
Sears, D.O., Freedman, J.L. & Peplau, L.A. (1985). Social psychology. Prentice Hall, Englewood Cliffs, New Jersey.
Schiffman, G. L., Hansen, H., & Kanuk, L.L. (2008).Consumer behaviour: A European outlook. Upper Sadle River: Prentice Hall.
Shove, E. (2003). Comfort, cleanliness and convenience: The social organization of normality. Berg: Oxford.
Steg, L., & Vlek, C. (2009). Encouraging pro-environmental behaviour: An integrative review and research agenda.Journal of Environmental Psychology, 29, 309–317. doi:10.1016/j.jenvp.2008.10.004.
Thøgersen, J. (2005). How may consumer policy empower consumers for sustainable lifestyles?Journal of Consumer Policy, 28, 143–177. doi:10.1007/s10603-005-2982-8.
Thøgersen, J., & Grønhøj, A. (2010). Electricity saving in households—A social cognitive approach.Energy Policy, 38, 7732–7743.
Tukker, A., & Jansen, B. (2006). Environmental impacts of products: A detailed review of studies.Journal of Industrial Ecology, 10, 159–182. doi:10.1162/jiec.2006.10.3.159.
Verhallen, T. & Pieters, R.G.M. (1984). Attitude theory and behavioral costs.Journal of Economic Psychol- ogy, 5(3). doi:10.1016/0167-4870(84)90024-2.
Wackernagel, M., & Rees, W. E. (1996).Our ecological footprint: Reducing human impact on the earth.
Gabriola Island: New Society Publishers.
Zsóka, Á. (2005).Consistency and awareness gaps in pro-environmental organisational behaviour. (Doctoral dissertation. Corvinus University of Budapest).