C O R VI N U S E C O N O M IC S W O R K IN G P A PE R S
http://unipub.lib.uni-corvinus.hu/3865
CEWP 01 /201 9
Herding behaviour in an emerging market: Evidence from the Moscow Exchange
by Edgars Rihards Indars, Aliaksei Savin,
Ágnes Lublóy
1
HERDING BEHAVIOUR IN AN EMERGING MARKET: EVIDENCE FROM THE MOSCOW EXCHANGE
Edgars Rihards Indars1
Stockholm School of Economics in Riga and SEB Latvia
Aliaksei Savin2
Stockholm School of Economics in Riga and Kino-mo, Belarus
Ágnes Lublóy3
Department of Finance and Accounting, Stockholm School of Economics in Riga and
Department of Finance, Corvinus University of Budapest
January 14, 2019
An extensively revised version of this paper has been published in Emerging Markets Review:
Edgars Rihards Indars, Aliaksei Savin, Ágnes Lublóy. (2019). Herding behaviour in an emerging market: Evidence from the Moscow Exchange. Emerging Markets Review. Published online ahead of print 28 December 2018. doi: https://doi.org/10.1016/j.ememar.2018.12.002 Most importantly, we have carefully revised the typology of herding (Figure 1 and related explanation) and the motivation for selecting the Russian market to investigate herding behavior. Moreover, we have formulated testable hypothesis in relation with herding asymmetries, political turmoil, announcement days, and oil price fluctuations. At the same time, we have deleted the tests assessing whether herding effects are more pronounced for companies with less transparent information environment; these tests did not form a coherent part of the study any more. In the revised manuscript, in relation with herding asymmetries, political turmoil, announcement days, and oil price fluctuations we first provide a theoretical justification for the herding phenomenon. Afterwards, empirical evidence is listed; we review studies from the field. Finally, we argue how political events, announcements of key policy decisions and macroeconomic news releases, and oil price fluctuations can motivate herding driven by fundamental and non-fundamental information.
1 Strēlnieku iela 4a, Riga LV-1010, Latvia, edgars.indars@gmail.com (email)
2 Strēlnieku iela 4a, Riga LV-1010, Latvia, aliakseisavin@gmail.com (email)
3 Strēlnieku iela 4a, Riga LV-1010, Latvia, +371 67015841 (tel), +371 67830249 (fax)
agnes.lubloy@sseriga.edu (email); Fővám tér 8, Budapest, 1093, Hungary, agnes.lubloy@uni-corvinus.hu (email)
2 Abstract
This study investigates the extent to which herding towards the market consensus for Russian stocks is driven by fundamental and non-fundamental factors. We find evidence that investors on the Moscow Exchange herd without any reference to fundamentals during unanticipated financial crises coupled with high uncertainty, in falling markets, and during days with extreme upward oil price movements. The results indicate that companies with less transparent information environment, proxied by company size and the number of analysts following the company, are more prone to herding driven by non-fundamental factors. This herding behaviour temporarily impedes the incorporation of all relevant fundamental information into stock prices and diverts the market from its efficient state. In contrast, in periods of high liquidity and on days of international sanction announcements during the Ukrainian crisis herding behaviour is merely driven by fundamentals. In Russia, macroeconomic news releases induce both information-related herding and herding without any reference to fundamentals.
These results suggest that motives of investors herding behaviour vary under specific market conditions and share characteristics.
JEL codes: G01, G14, G40,
Keywords: herding, emerging markets, fundamental information
Acknowledgements
This research was carried out at the Department of Finance and Accounting, Stockholm School of Economics in Riga. This research was inspired by the BSc thesis of Edgars Rihards Indars and Aliaksei Savin under the supervision of Ágnes Lublóy. We thank the discussant and participants at the 8th Annual Financial Market Liquidity Conference, 16–17 November 2017, Budapest, Hungary for helpful comments and suggestions on earlier versions of this paper.
3 1. Introduction
Investors’ herding behaviour may manifest itself in a variety of ways. The diverse manifestations have resulted in a number of definitions of herding behaviour. Herding is defined as a situation in which investors ignore their own beliefs and imitate either the observed decision of their peers or movements in the market, for example, by Bikchandani & Sharma (2001) or Hwang & Salmon (2004). In this case the emphasis is placed on mimicking others instead of making investment decisions based on own beliefs and information. In a broader sense, herding can be defined as a pool of investors trading in the same direction over a period of timedefinition used, among others, by Nofsinger & Sias (1999) and Chiang & Zheng (2010). In this case the emphasis is put on the correlation in trades resulting either from interactions between investors or from a behavioural convergence to the market consensus. We follow this broader definition and define herding as a process where investors simultaneously trade in the same direction, either due to imitating each other or due to converging to the averagedefinition similar to Galariotis, Rong & Spyro (2015), and Galariotis, Krokida &
Spyrou (2016).
Depending on the motives trading in the same direction, investors’ herding behaviour may be intentional or spurious (unintentional). As defined by Bikchandani & Sharma (2001), intentional herding derives from a strong willingness of investors to replicate the actions of others in the market. This type of herding presupposes that investors suppress their ideas and beliefs and purposefully mimic decisions of others following some market consensus. Investors herd intentionally when they wish to profit from such behaviour in the form of a positive externality, either informational or professional (Gavriilidis, Kallinterakis & Ferreira, 2013;
Guney, Kallinterakis & Komba, 2017). In contrast, spurious herding can be defined as a situation when investors take similar actions after receiving similar information (Bikchandani
& Sharma, 2001). If market participants are exposed to identical information, they independently make similar investment decisions. The similarity in decision making is enhanced by similar educational and professional qualification of traders, the similar indicators used for analytical purposes, converging regulations, and characteristic trading being popular among institutional investors (Gavriilidis et al., 2013; Guney et al., 2017).
Spurious herding reflects rational behaviour of economic actors; investors act simultaneously on the information received. Intentional herding may be rational and irrational. According to Devenow & Welch (1996), irrational herding arises from psychological factors: investors might feel more safe and secure when following the crowd. De Long, Shleifer, Summers &
Waldmann (1990) suggest that irrational herds might also arise among unsophisticated investors who incorrectly interpret external information. These investors centre their trading behaviour around pseudo-signalsin effect, around noise. Shleifer & Summers (1990) argue that such signals usually spread fast among unsophisticated traders and lead them to herd on non-fundamental information. Rational herding, as summarized by Bikchandani & Sharma (2001), is likely to stem from information asymmetry, reputation concerns and compensation concerns. Information-based intentional herding, or information cascades, occurs when investors operate in an imperfect information environment. As investors face difficulties in interpreting the imperfect data, they try to infer private information from the behaviour of their peers and, hence, herd. Among others, Zhou & Lai (2009) find empirical evidence of information-based herding in Hong Kong. Reputational herding is observed when an investment manager lacks knowledge and skills or has high reputation concerns (Graham, 1999). Mimicking the behaviour of others may benefit such manager as it helps avoiding poor relative performance. Most recently, Casavecchia (2016) found empirical evidence of
4
reputational herding in a sample of US mutual funds. Compensation-based herding may occur if investment fund managers are remunerated based on their performance relative to their peers (Bikchandani & Sharma, 2001; Gümbel, 2005; Hedesström, Gärling, Andersson & Biel, 2015).
Although mimicking the investment decision of other fund managers limits the maximum compensation, at the same time it provides an insurance against low remuneration: poor performance relative to the benchmark can be avoided.
Finally, herding might reflect investment decisions driven by fundamental information and non-fundamental factors. In the former case investors react to company fundamentals in a correlated way, while in the latter one investors suppress private information and mimic the behaviour of others without any reference to fundamentals.
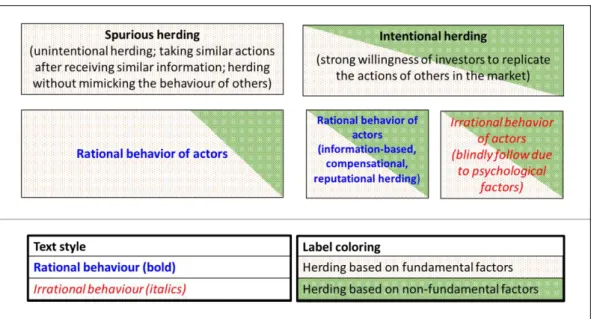
The typology of herding is shown in Figure 1. Spurious herding, being generated by rational investors as a result of information processing, is based on company fundamentals in most cases. However, if fundamental information is corrupted by noise, interpreted wrongly or not available at all (e.g., for cryptocurrencies), in the short term spurious herding might be driven by non-fundamental factors. Intentional herding may reflect rational or irrational behaviour of economic actors, with investment decisions being based on fundamental or non-fundamental information. For example, herding is intentional, rational and based on fundamentals when non-sophisticated investors mimic the behaviour of ‚smart’ traders (information-based herding). Compensational and reputational herding might be driven by both fundamental and non-fundamental factors, depending on the information content of the investment decisions of the fund manager being copied. When investors blindly follow other traders, they herd intentionally and irrationally; the copied trading strategies may or may not have reference to company fundamentals. Blindly following the behaviour of investors trading without any reference to the fundamentals is a behaviour being typical in bubbles and crashes.
Figure 1: Typology of herding
Herding based on non-fundamental factors may be considered as a sign of market’s informational inefficiency. Herding investors do not build their investment decisions on information available in the market, and hence prevent stock prices from reflecting the most recently published information (Hwang & Salmon, 2004; Gavriilidis et al., 2013). As a result, if investors trading on company fundamentals cannot offset trades of investors trading without
5
any reference to fundamentals the market moves towards inefficiency; the informational cascade prevents the market from aggregating information of numerous individuals (Bikhchandani, Hirshleifer & Welch, 1992). Rational investors may intentionally amplify these deviations by conducting transactions ahead of feedback traders (De Long et al, 1990). In the extreme, herd behaviour can dominate the market and the mispricing can lead to bubbles followed by crashes (Avery & Zemsky, 1998). In contrast, herding based on fundamental factors does not reflect market inefficiency, investors reallocate their assets independently and rationally on the basis of new fundamental information (Hwang & Salmon, 2004).
We aim at testing for herding towards the market consensus on the Moscow Exchange, while differentiating between herding based on fundamental information and non-fundamental factors. Differentiating empirically between the two cases of common movements in the market is of major importance; in one case the correlated actions of traders let the market divert from its efficient state, in the other the simultaneous decisions of investors reflect an efficient reallocation of assets.
Not long ago, researches developed methods for detecting herding behaviour. A method for deciphering empirically whether investors herd towards the market consensus was proposed by Hwang & Salmon (2004), and Chang et al. (2000). Hwang & Salmon (2004) argue that there is a significant variance in observed equity betas despite the conventional asset-pricing models’ assumptions of beta being constant. By looking at asset betas the authors postulate that any observed beta can be decomposed into the “true” equilibrium beta and some contagion factor, which arises due to behavioural anomalies, such as herding. In contrast, Chang et al.
(2000) investigates the dispersion of returns around their cross-sectional average. Low dispersion signals that market participants follow correlated trading patterns around the market consensus while discarding their prior heterogeneous information and beliefs. Galariotis et al.
(2015) extend the methodology of Chang et al. (2000) by adding the well-known Fama &
French (1993, 1995) factors to the model with the aim of controlling for fundamental information. The authors decompose cross-sectional deviation of returns to deviations due to reaction to relevant fundamental information and deviations due to correlated action of investors driven by non-fundamental factors. They build their model on the assumption that size, book-to-market, and momentum factors from Fama & French (1993, 1995) display changes in common risk factors while valuing stocks. In particular, they estimate a regression where return deviations from the market consensus is the dependent variable and the three factors and the excess returns of the market are the independent variables. Then the residuals from this regression are used as a proxy for return deviations due to non-fundamental information. This study follows the approach of Galariotis et al. (2015), considering the suggestions of Dang & Lin (2016).
We also aim at identifying factors associated with investors’ herding behaviour. To the best of our knowledge, for the first time in the literature, we systematically differentiate between factors enhancing herding based on fundamental versus non-fundamental factors. Although previous studies indicate that investors exhibit herding behaviour with a higher probability under specific market conditions or share characteristics, they fail to decipher whether herding towards the market consensus is a correlated reaction to fundamental information or imitation without reference to fundamentals. For example, it is well documented that herding formation displays asymmetric patterns when conditioned upon different market states characterized by returns, volatility or liquidity of the market. Although the evidence is mixed, vast amount of studies report about more pronounced herding behaviour during periods of financial turmoil, negative market returns, high liquidity and high volatility (Chang et al., 2000; Tan, Chiang,
6
Mason & Nelling, 2008; Zhou & Lai, 2009; Chiang & Zheng, 2010; Demirer, Kutan & Chen, 2010; Economou et al., 2011, 2015; Gavriilidis et al., 2013; Lam & Qiao, 2015; Mobarek, Mollah, Keasey, 2014; Galariotis et al., 2015; Guney at al., 2017). A few studies show the impact of important macroeconomic news announcements (Galariotis et al., 2015); the amount and quality of information being available about companies (Thirikwa, 2015; Özsu, 2015;
Chong, Liu & Zhou. 2017); and large oil price fluctuations for resource-exporting countries (Balcilar, Demirer & Hammoudeh, 2014; Demir & Solakoglu, 2016) on herding. (See section 2 for a more detailed discussion.) Only a few studies in the vast literature on herding differentiate whether investors herd on fundamental or non-fundamental information under these specific market conditions (Hwang & Salmon, 2004; Galariotis et al., 2015; Dang & Lin, 2016). We aim at filling this gap in the literature and investigate whether investors’ herding behaviour is driven by fundamental or non-fundamental information during rising and falling markets; during periods of high and low liquidity; during financial turmoil; during news announcements related to either sanctions against Russia due to Crimea’s annexation or key macroeconomic data; in poor and rich information environment; and during days of large oil price fluctuations. Although it is reasonable to conjecture that investors react to fundamentals in a correlated way on days of important macroeconomic news releases, whereas they may herd on non-fundamental factors during periods of high uncertainty (financial turmoil, falling markets, companies with less transparent information environment), these relationships were never tested systematically in the literature before.
This study offers three main contributions to the existing body of literature. First of all, we provide empirical evidence of herding behaviour on the Moscow Exchange, a stock market never assessed in the literature despite having a leading position in global context. As of December 2017, the Moscow Exchange was the 3rd largest exchange both in fixed income and in derivatives, among top 25 exchanges by equity trading volume and the 12th largest exchange by market capitalization (Moscow Exchange, 2017). The growth potential of the Moscow Exchange is also remarkable; in 2016 the market capitalization of this exchange, denominated in USD, grew the fastest (WFE, 2017). The Moscow Exchange has received an increased attention from international investors over the past years, most probably due to the low correlation with global markets offering diversification benefits (Moscow Exchange, 2017).
Recently, the number of exchange traded funds maintaining significant exposure to stocks listed in Russia has also increased significantly (ETFdb, 2017). Another reason for investigating investors’ herding behaviour on the Moscow Exchange is related to Russia’s unique characteristics; this economy is not comparable to any other economies. Russia, being one of the world’s largest economies, is substantially different geographically, economically, politically and culturally from any other economies, including the members of the BRICS countries (Brazil, Russia, India, China, South-Africa)uniquity worth investigating.
Moreover, investors’ herding behaviour is expected to be more pronounced in Russia than in many other emerging markets for two reasons. On the one hand, the Russian stock exchange is a market with relatively poor investor protection and prevailing information asymmetry, high exposure to international capital flows, fragile market microstructure, and non-sophisticated small stockholders (Economou et al., 2011; Corcoran, 2013; Iwasaki, 2014; Moscow Exchange, 2017). On the other hand, Russia has faced a period of austere political and economic challenges lately, attracting the attention of the leading economies and international organizations, accompanied by growing investor uncertainty. As argued by a number of researchers, such economic developments hamper financial markets and make the formation of herding more likely to occur (Christie & Huang, 1995; Bikchandani & Sharma, 2001).
7
As a second contribution we show the importance of distinguishing between herding based on fundamental information and herding without any reference to fundamentalsthe distinction made only in a few studies in the vast literature on herding (Hwang & Salmon, 2004; Galariotis et al., 2015; Dang & Lin, 2016). Although we find no evidence of investors exhibiting herding behaviour on the Moscow Exchange overall, we find empirical evidence of herding driven by non-fundamental factors. If we hadn’t separated herding based on fundamental information from herding based on non-fundamental factors in the Russian stock market, we would have erroneously reported no herding behaviour at all. For investors, distinguishing between herding behaviour based on fundamental versus non-fundamental factors is critical, the former being an efficient way of reacting to a new piece of information and not leading to asset mispricing.
Moreover, this distinction may also provide a potential explanation for the contradicting evidence on herding (see section 2 for details). Although studies examining herding cover different markets, use different methodologies and/or sample periods, the evidence is sometimes contradicting even if similar settings are compared. It may well be the case that investors herd either around fundamental or non-fundamental information only, and in one study the effect is strong enough to document herding overall, while weak in the other with cancelling out effects being dominant.
Thirdly, we contribute to the literature by identifying factors associated with herding. Some of the factors on which herding is conditioned are widely researched in the literature (e.g., financial turmoil, periods of negative market returns), while for others the evidence is scant (liquidity, important news releases, information environment, oil price fluctuations). However, even for determinants being widely researched, herding driven by fundamental information is not separated from herding driven by non-fundamental factors. We provide novel evidence of herding during periods of high-liquidity, macroeconomic news announcements and extreme oil price fluctuations. We show that herding during periods of high liquidity is driven by fundamental factorsit is a rational response of investors to changes in information without distorting the market. Moreover, we find that investors in Russia herd both on fundamental and non-fundamental factors during days of macroeconomic news releases; some of the investors react in a correlated way to fundamental information, while others, most probably unsophisticated investors trade without any reference to company fundamentals. Thus, during macroeconomic news releases asset prices may deviate from their fundamental values in Russia. We also document that investors on the Moscow Exchange exhibit herding behaviour driven by non-fundamental factors on days of extreme upward oil price movements.
The findings of this study are relevant for investors with positions in MICEX-traded stocks, especially taking into account a renewed interest in Russian stock market worldwide (Namatalla & Gokoluk, 2016; Platt & Bullock, 2016). While making their asset allocation decisions on the Moscow Exchange, investors should bear in mind herding behaviour driven by non-fundamental information, especially during days of negative market returns and during periods of market turmoil and uncertainty. This behavioural bias is likely to cause asset mispricing preventing the market from revealing the fair value of assets and undermining market efficiency. As a result, profitable trading opportunities might emerge on the one hand (Hwang & Salmon, 2004; Tan et al., 2008), while suboptimal portfolio optimization decision might be made on the other, causing reduction in social welfare (Economou et al., 2011).
Herding driven by non-fundamental factors adversely impacts portfolio diversification as well.
If the dispersion of returns around their cross-sectional average is lower, then investors need more assets for reaching the same level of portfolio diversification. In addition to investors, our findings are relevant for regulatory bodies supervising the Russian financial market. If investors on the Moscow Exchange regularly exhibit herding behaviour without any reference
8
to the fundamentals, it may well be the case that they face obstacles to obtain information and are, hence, forced to herd. By establishing a more transparent market environment (strict and enforceable disclosure requirements) and enhancing investors’ trust, investors may exhibit less herding behaviour without any reference to fundamentals, which in turn may create more incentives to invest in Russian companies and contribute to the overall development of the Moscow Exchange. Moreover, regulators should bear in mind that investors trading in a correlated way may undermine financial stability and enhance endogenous risk (Bikchandani
& Sharma, 2001; Demirer & Kutan, 2006). Finally, our findings are relevant for researches investigating behavioural biases in emerging markets, as it provides novel evidence of factors associated with herding and shows that the informational background of investors herding behaviour vary under specific market conditions and share characteristics. Theoretical models that attempt to capture herding shall consider this behavioural pattern.
The remainder of the study is structured as follows. Section 2 briefly reviews the relevant literature. Section 3 presents the methodology and data used in this paper. Section 4 presents and discusses the empirical findings and highlights limitations of the current study. Section 5 concludes the paper.
2. Evidence of herding: a short review
Empirical evidence of herding towards the market is mixed, even when assessing the same market. Chang, Cheng & Khorana (2000) investigate herding towards the market in the US, Hong Kong, Japan, Taiwan, and South Korea. The authors find strong evidence of herding in emerging markets of South Korea and Taiwan, weak evidence in Japan and no evidence in the US and Hong Kong. In contrast, Hwang & Salmon (2004), by employing a different method, find evidence of herding in both up and down markets in the US and South Korean markets.
At the same time, Galariotis et al. (2015) find no evidence of herding, neither fundamental, nor non-fundamental driven, in the US and in the UK on a regular basis. Demirer et al. (2010) conclude that investors exhibit no herding behaviour in China, while Tan et al. (2008) report evidence of herd behaviour for Chinese dual-listed stocks. In India, Garg & Jindhal (2014) find no evidence of herding during 2000-2012, while Poshakwale & Mandal (2014) report about herding behaviour during 1997-2012. Chiang & Zheng (2010) carry out a comprehensive study of herding on the sample of 18 advanced and emerging economies all over the world. The authors find no evidence of herding in the US and Latin American markets; whereas investors in the Asian markets exhibit a certain degree of herding behaviour in both up and down stages.
Filip, Khan, Hassairi & Viviani (2011) study four developed European markets – France, UK, Germany and Italy – and conclude that investors exhibit herding behaviour in all of them.
Pochea & Pece (2015) find herd behaviour in CEE countries, except for Poland and Romania.
The general conclusion is that herding effects are more pronounced in emerging markets compared to developed ones; the less transparent information environment urges investors to infer information by tracking their peers’ actions. This conclusion is strongly supported by recent evidence from frontier markets; authors unambiguously report that investors mimic their peers’ trade and herd due to the poor quality of the information environment (Balcilar, Demirer
& Hammoudeh, 2013; Balcilar et al., 2014; Guney et al., 2017).
Herding formation displays asymmetric patterns conditional upon different market states characterized by returns, volatility or liquidity. The most widely tested herding asymmetry is related to rising and falling markets. In bearish markets, investors aim at avoiding larger losses and they herd on the sell side. In bullish markets, investors may herd on the buy side: due to
9
the optimistic sentiment in the market, investors do not want to fall behind their peer investors and follow them with the ultimate aim of profiting from the upward market trend (De Long et al., 1990). Numerous studies show that herding behaviour is more pronounced during periods of negative market returns (Chang et al., 2000; Zhou & Lai, 2009; Chiang & Zheng, 2010;
Demirer et al., 2010; Economou et al., 2011; Mobarek et al., 2014), most probably due to investors’ risk aversion. Studies reporting about stronger herding during up markets include, among others, Tan et al. (2008) and Economou et al. (2015).
Much less evidence is available whether volatility and liquidity affect the dispersion of returns asymmetrically, with the governing mechanism being also disputed. Economou et al. (2011) argues that periods of market turmoil are generally coupled with high volatility and high trading volume, periods where investors face uncertainties and may prefer following the market consensus. In contrast, Gavriilidis et al. (2013) argue that high liquidity attracts more informed investors, which in turn facilitates the copying behaviour of uninformed investors. Regarding liquidity, not even the causality is clear: as herding implies a significant number of investors trading in the same direction, this behavioural bias might lead to increased liquidity. The relationship between market-wide herding and market liquidity has been investigated only in a few studies. Tan et al. (2008) find that local investors exhibit herding behaviour in periods of high liquidity in China. Similar conclusions are drawn by Lam & Qiao (2015) for Hong Kong and by Gavriilidis et al. (2013) for Spain. Economou et al. (2011) report about mimicking during days of high trading volume only for Spain out of four European markets. By looking at the liquidity of stocks, Galariotis et al. (2016) find evidence of herding for high liquidity stocks in each developed market studies. Overall, they also find that when liquidity rises the tendency of investors to herd around the market consensus increases. In contrast, Mobarek et al. (2014) find evidence of herding effect in Ireland and Norway during low volume trading periods. The evidence on asymmetric herding behaviour conditioned on market volatility is mixed as well. Blasco, Corredor & Ferreruela (2012) report that intraday herding increases with volatility in the Spanish market. Tan et al. (2008), Economou et al. (2011), and Gavriilidis et al. (2013) also find that herding effects are more pronounced on days with high volatility. In contrast, Guney et al. (2017) find evidence of herding during both high and low volatility periods in each frontier market studied, while Mobarek et al. (2014) document the same for three out of eleven European countries. The mixed findings are in line with the diverse underlying mechanisms: if high volatility is related to an increased information flow than uninformed investors may profit from mimicking the trade of their informed peers (Gavriilidis et al., 2013); whereas in low-volatility environment herding is facilitated by observing the market consensus easily (Guney et al., 2017).
Several factors might be associated with herding. Periods of financial turmoil, believed to be accompanied by higher uncertainty, are one of the most widely tested factors. As argued by Christie & Huang (1995), herd formation is more likely in extreme market conditions as investors are eager to follow the market consensus. The majority of studies report that investors exhibit herding behaviour in financial crises coupled with high uncertainty (Chiang & Zheng, 2010; Klein, 2013; Galariotis et al., 2015; Economou et al., 2015; Mobarek et al., 2014; Guney at al., 2017). For example, Galariotis et al. (2015) find that herding is pronounced during the subprime crisis in the US and during Asian crisis of 1997-1998 in the UK. Similarly, Chiang
& Zheng (2010) document herding behaviour in the crisis country of origin, and claim that large, contagious crises might trigger herding activity in stock exchanges which normally do not exhibit it (such as the US and Latin-America). For Europe, Mobarek et al. (2014) report that during normal times herding is not significant, but during crises investors herd. In contrast,
10
some other papers find either less pronounced or no evidence of herding during turmoil (Baur, 2006; Khan et al., 2011; Economou et al., 2011, Demir & Solakoglu, 2016).
A couple of recent papers test for herding when essential macroeconomic information is released. Investors may react similarly when key macroeconomic indicators are published, and hence herd towards the consensus. Galariotis et al. (2015) investigate the impact of important news announcements on herding and find some evidence of this phenomenon for both the US and the UK. US investors exhibited herding behaviour due to natural reaction to fundamental information during the Asian and Russian crises, while during the subprime crises investor exhibited herding behaviour without any reference to fundamentals. On days of important macroeconomic news releases UK investors reacted similarly to fundamental information and exhibited herding behaviour only during the Dotcom bubble. Investors exhibit herding behaviour around US news announcements in some European countries (Belgacem & Lahiani, 2013). Interestingly, investors in Belgium, Finland and Ireland only herd on US news releases and do not exhibit herding behaviour with respect to any domestic factor (Belgacem & Lahiani, 2013).
Company-specific determinants might also be associated with investors’ herding behaviour.
For instance, it is widely believed that the amount and quality of information about a particular company affects its price. In less transparent information environment market participants might engage in herd behaviour due to lack of confidence in their abilities and loss in reputation if they underperform their peers (Bikchandani & Sharma, 2001). One of the proxies used to capture information availability is the size of the company: the larger the company, the easier it should be to obtain credible information. Although among institutional investors it is widely documented that size is a key determinant of herding (Guney et al., 2017), the market-wide empirical evidence is scant and mixed. Chang et al. (2000) find no impact of size on herding patterns, while Thirikwa (2015) and Özsu (2015) report that small market capitalization is associated with larger amount of herding behaviour. In contrast, Chong et al. (2017) detect herd behaviour for portfolios with a larger number of analyst following in Chinafor heavily followed stocks investors rather follow the analysts than their own beliefs.
For resource-exporting countries, oil price might be considered as one of the potential herding determinants. Balcilar et al. (2014) find that the price of oil, as a component of the global factor, governs the transition to herding states in the Gulf Arab stock markets. Demir & Solakoglu (2016) show that herding in Qatar is driven by oil returns and oil return volatility. To the authors’ knowledge, no studies are published on countries outside the Arabian Gulf.
3. Methodology
3.1 Detecting herding towards the market
In order to detect herding towards the market on the Moscow Exchange, we employ the method proposed by Chang et al. (2000) and latter modified by Galariotis et al. (2015) and Dang & Lin (2016). The intuition behind the herding measure developed by Chang et al. (2000) is that low dispersion of returns around their cross-sectional average signals that market participants follow correlated trading patterns around the market average (used as a proxy for market consensus) while discarding their prior heterogeneous information and beliefs. The dispersion of returns, similar to Chang et al. (2000), is measured by the cross-sectional absolute deviation of returns (CSAD) as defined in Eq.1:
11 𝐶𝑆𝐴𝐷𝑡 = 1
𝑁∑ |𝑅𝑖,𝑡− 𝑅𝑚,𝑡|
𝑁
𝑖=1
, (1)
where N is the number of stock in the market portfolio, Ri,t is the observed stock return of asset i on day t, and Rm,t is the cross-sectional average return on day t.
Chang et al. (2000) show that standard asset-pricing models predict the relationship between the CSAD and the returns of equally-weighted market portfolio to be positive and linear.
However, as argued by the authors, herd behaviour around the market consensus during extreme price movements converts the linear relation into a non-linear one. Following Chang et al. (2000), the non-linear framework for investigating the relationship between the market average and individual asset return dispersions is specified as follows:
𝐶𝑆𝐴𝐷𝑡 = 𝛽0+ 𝛽1|𝑅𝑚,𝑡| + 𝛽2𝑅𝑚,𝑡2 + 𝜖𝑡, (2) where β0 is the constant, β1 and β2 are coefficients, and εt is the error term on day t. In Eq. 2 the non-linearity in the relationship is captured by the squared market return (R2m,t). If there is no herding, Eq. 2 assumes β1 to be positive and β2 to equal zero. Negative and statistically significant 𝛽2 indicates herding. In case of herding the cross-sectional dispersion of individual asset returns is not proportional to market returns as suggested by standard asset pricing models; instead, the change is substantially less than a proportional change. In all regressions heteroskedastic and autocorrelation consistent co-variances are obtained by using the estimators as defined by Newey and West (1987).
The herding measure of Chang et al. (2000), however, does not distinguish between herding driven by fundamental and non-fundamental information. With the aim of differentiating between these two forms of herding, both Galariotis et al. (2015) and Dang & Lin (2016) decompose variations in CSAD based on fundamental and non-fundamental drivers. As argued by the authors, the variation in CSAD explained by the fundamental factors capture herding on fundamental information. The fundamental factors include the small minus big factor, the high minus low factor and momentum factor as proposed by Fama & French (1993, 1995) and Carhart (1997). In contrast, the unexplained part of the variation represents herding without any reference to fundamentals. Galariotis et al. (2015) use real values for SMB, HML and MOM, whereas Dang & Lin (2016) use their absolute values arguing that this modification significantly improves the model fit.
In this study the decomposition of CSAD, in line with Dang & Lin (2016), is specified as follows:
𝐶𝑆𝐴𝐷𝑡 = 𝛽0+ 𝛽 1|𝑅𝑚,𝑡 − 𝑅𝑓| + 𝛽 2|𝐻𝑀𝐿𝑡| + 𝛽 3|𝑆𝑀𝐵𝑡| + 𝛽 4|𝑀𝑂𝑀𝑡| + 𝜀𝑡 (3)
𝐶𝑆𝐴𝐷𝑡,𝑁𝑂𝑁−𝐹𝑈𝑁𝐷 = 𝜀𝑡, (4)
𝐶𝑆𝐴𝐷𝑡 = 𝐶𝑆𝐴𝐷𝑡,𝐹𝑈𝑁𝐷+ 𝐶𝑆𝐴𝐷𝑡,𝑁𝑂𝑁−𝐹𝑈𝑁𝐷 (5) where Rm,t is market return on day t, Rf is a risk-free rate, HML is a high-minus-low factor, SMB is a small-minus-big factor; MOMt is a momentum factor;𝜀𝑡 is an error term. As there are no data readily available on the fundamental factors for Russia, HML and SBM factors are constructed in line with Fama & French (1993, 1995), whereas MOM is calculated as suggested
12
by Carhart (1997). Due to changes in market capitalization and book-to market ratio, HML and SMB portfolios are rebalanced annually. Momentum portfolios are rebalanced monthly.
Finally, in order to detect herding towards the market due to fundamental and non-fundamental factors, regressions are specified as denoted in Eq. 6 and 7. Similar to Eq. 2. negative and statistically significant 𝛽2 indicates herding.
𝐶𝑆𝐴𝐷𝑡,𝐹𝑈𝑁𝐷= 𝛽0+ 𝛽1|𝑅𝑚,𝑡| + 𝛽2𝑅𝑚,𝑡2 + 𝜖𝑡 (6) 𝐶𝑆𝐴𝐷𝑡,𝑁𝑂𝑁−𝐹𝑈𝑁𝐷 = 𝛽0+ 𝛽1|𝑅𝑚,𝑡| + 𝛽2𝑅𝑚,𝑡2 + 𝜖𝑡 (7) Similar to other studies, we also investigate whether return’s dispersion follow different patterns in up and down markets (Chang et al., 2000; Zhou & Lai, 2009; Chiang & Zheng, 2010; Demirer et al., 2010; Economou et al., 2011; Mobarek et al., 2014). In the empirical tests we follow the approach of Chiang and Zheng (2010) and introduce a dummy variable in a single model. This approach is claimed to be more robust than the approach of Tan et al. (2008) who split the sample into two and estimate separate models for the subsamples (Economou et al., 2011). The asymmetric herding behaviour conditional on the market returns is tested using Eq. 8:
𝐶𝑆𝐴𝐷𝑡= 𝛽0+ 𝛽1𝐷𝑈|𝑅𝑚,𝑡| + 𝛽2𝐷𝑈𝑅𝑚,𝑡2 + 𝛽3𝐷𝐷|𝑅𝑚,𝑡|+𝛽4𝐷𝐷𝑅𝑚,𝑡2 𝜖𝑡, (8) where dummy variable Du = 1 if 𝑅𝑚,𝑡 >0 and DD = 1 if 𝑅𝑚,𝑡 <0. Eq. 8 is estimated for both the fundamental and non-fundamental components of CSAD, revealing the underlying mechanisms of herding if present. Negative and statistically significant 𝛽2 or 𝛽4 coefficients imply herding during up or down days, respectively.
We further investigate the asymmetric pattern of herding formation by comparing investors’
behaviour on high versus low liquidity days. Two liquidity measures capturing different dimensions of liquidity are used: trading volume and Amihud (2002) illiquidity measure.
Trading volume is related to the depth and breadth of the market, while the widely used Amihud illiquidity measure, considered as reliable proxy of the price impact, captures the depth and thinness of the market (Goyenko, Holden & Trzcinka, 2009). The model estimated is as follows:
𝐶𝑆𝐴𝐷𝑡 = 𝛽0+ 𝛽1|𝑅𝑚,𝑡| + 𝛽2𝑅𝑚,𝑡2 + 𝛽3𝐷𝐿𝑅𝑚,𝑡2 +𝛽4𝐷𝐻𝑅𝑚,𝑡2 + 𝜖𝑡 (9) When liquidity is measured by the trading volume, dummy variable DL=1 if trading volume falls into the lower 25th percentile, and 0 otherwise; and DH=1 if trading volume falls into the upper 25th percentile, and 0 otherwise. When the Amihud (2002) illiquidity measure is used, dummy variable DL=1 if the Amihud measure falls into the upper 25th percentile, and 0 otherwise; and DH=1 if the Amihud measure falls into the lower 25th percentile, and 0 otherwise. (Note that the Amihud illiquidity measure is high when the market’s liquidity is low; while the measure is low when the market’s liquidity is high.) Negative and statistically significant 𝛽3 or 𝛽4coefficients imply herding during low or high liquidity days, respectively.
13
3.2 Testing factors associated with herding towards the market
The empirical evidence on herding towards specific markets is vast. Much less evidence is available on factors associated with herding, with only a couple of studies differentiating between herding based on fundamental and non-fundamental factors (see Section 2 for details).
This study investigates the role of three groups of determinants that might foment herding on the Moscow Exchange: calendar effects related to crises and major macroeconomic and political news releases; company’s information environment; and oil prices. In each specification listed below variations in CSAD are decomposed into fundamental and non- fundamental parts (Eq. 3 to 5).
First, we examine whether herding effects are more pronounced during crisis periods and on days of important macroeconomic and political news releases. Financial crises being accompanied by higher uncertainty have been shown to be critical for herding in some but not all capital markets (Chiang & Zheng, 2011; Galariotis et al., 2015; Khan et al., 2011;
Economou et al., 2015; Mobarek et al., 2014; Guney et al., 2017). In particular, we test the effects of three major crisis periods: the subprime crisis of 2008, Crimea annexation, and the aftermath of Crimea’s annexation (see Section 3.3 for details on the crisis periods). For each crisis period we estimate the regression specified in Eq. 10:
𝐶𝑆𝐴𝐷𝑡𝐶 = 𝛽0+ 𝛽1|𝑅𝑚,𝑡|𝐶+ 𝛽2𝑅𝑚,𝑡2 𝐶+ 𝜖𝑡 , (10) where CSADtCrepresents cross-sectional absolute deviation of returns during the crisis period, and 𝑅𝑚,𝑡𝐶is the market return during the period of the economic turmoil. A negative and statistically significant 𝛽2 coefficient implies herding towards the market during the crisis period.
Among calendar effects we also test whether herding effects are more pronounced on days of sanctions announcements and important macroeconomic news releases (see Section 3.3 for details on announcements). In the literature the impact of news announcements on herding is scant (Galariotis et al., 2015; Belgacem & Lahiani, 2013). Newey & West (1987) HAC estimators requires the regression variables to be evenly distributed over timethis requirement is not satisfied due to the dummy variables introduced for the announcement days.
Thus, instead of Eq. 10 we estimate the following models:
𝐶𝑆𝐴𝐷𝑡 = 𝛽0+ 𝛽1|𝑅𝑚,𝑡| + 𝛽2𝑅𝑚,𝑡2 +𝛽3𝐷𝑆𝑅𝑚,𝑡2 𝜖𝑡 (11) 𝐶𝑆𝐴𝐷𝑡= 𝛽0+ 𝛽1|𝑅𝑚,𝑡| + 𝛽2𝑅𝑚,𝑡2 +𝛽3𝐷𝑀𝑅𝑚,𝑡2 𝜖𝑡 (12) where dummy variable DS=1 for days of sanctions announcements, and 0 otherwise; DM=1 for days of important macroeconomic announcements, and 0 otherwise. A negative and statistically significant 𝛽3 coefficient in each regression reflects herding towards the market during announcement days.
Secondly, we investigate whether herding effects are more pronounced for companies with less transparent information environment. We use two proxies for the information environment:
market capitalization and number of analysts following the company. As argued previously, both the size of the company and the number of analysts following the company might positively correlate with the ease of obtaining company-specific information (Thirikwa, 2015;
Özsu, 2015; Chong et al., 2017). The smaller the company or the lower the number of analysts
14
following the company, the harder to obtain relevant information and thus the more probable herding is.
Sample companies are split into quartiles based on the proxy used for the information environment. The model specified in Eq. 13 is then estimated for each four sub-portfolios:
𝐶𝑆𝐴𝐷𝑝𝑜𝑟𝑡 𝑖.,𝑡 = 𝛽0+ 𝛽1|𝑅𝑚,𝑡| + 𝛽2𝑅𝑚,𝑡2 + 𝜖𝑡 (13) where CSADport i.,t is the cross-sectional absolute deviation of returns of portfolio i. A negative and statistically significant 𝛽2 coefficient implies herding towards the market within a given portfolio.
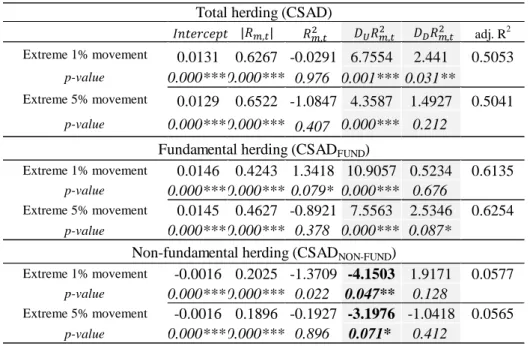
Finally, we assess whether herding effects are more pronounced on days of large oil price fluctuations. Russia is the third largest total petroleum and other liquid producer in the world (IEA, 2017); on the Moscow Exchange oil and gas corporations account for 32.6% of the total market capitalization (Table 1). Hence, fluctuations in oil prices may have a pronounced impact on the Russian financial market and might be associated with herding. We test for this market- wide herding effect using the following specification:
𝐶𝑆𝐴𝐷𝑡 = 𝛽0+ 𝛽1|𝑅𝑚,𝑡| + 𝛽2𝑅𝑚,𝑡2 + 𝛽3𝐷𝑈,5%𝑅𝑚,𝑡2 +𝛽4𝐷𝐿,5%𝑅𝑚,𝑡2 + 𝜖𝑡, (14) where dummy variable DU,5%=1 for days when the change in oil price falls into the upper 5th percentile, and 0 otherwise; 𝐷𝐿,5%=1 for days when the change in oil price falls into the lower 5th percentile, and 0 otherwise. As a robustness check, we also set the threshold at the first percentile. Negative and statistically significant 𝛽3 or 𝛽4coefficients reflect herding on the Moscow Exchange during days of extreme up or down oil price movements, respectively.
3.3 Data and descriptive statistics
The sample consists of daily closing prices for 120 individual stocks listed on the Moscow Exchange constituting 85.7% of the total market capitalization (Table 1). The dataset covers the period from 01/04/2008 to 30/12/2015; with total number of 1842 daily observations for each stock. Observations for 2016 were excluded due to lack of reliable data on book-to-market ratio required for calculating SMB, HML and momentum factors.
For each company in the sample daily data on stock prices, market capitalization, book-to- market ratio, trading volumes, number of shares outstanding and number of analysts tracking a particular company are extracted from Thomson Reuters Datastream. Daily closing Brent crude oil prices are extracted from the same database. The daily returns on MICEX value- weighted composite index is considered as the market return, and the 1-month zero-coupon bond of Russian Central Bank is referred as the risk-free return.
15
Table 1. Description of companies in the sample by size and industry
Market size of the companies as of December 30, 2015. Data for average market capitalization are in millions of Russian roubles.
Special attention is paid to three important macroeconomic and geopolitical events that negatively affected the Russian economy: 1) subprime crisis of 2008; 2) the days of Crimea annexation; 3) the aftermath of Crimea’s annexation. In Russia, the most severe period of the subprime crisis took place during the period of 12/05/2008-30/12/2008the period of interest in this study. In this period the MICEX Index, a value-weighted composite index of the 50 most liquid Russian stocks, fell cumulatively by more than 50%. The period of Crimea annexation is defined from 20/02/2014 to 18/03/2014from the first day of the Russian military operation against Ukraine to the date of signing the Treaty on Accession of the Republic of Crimea to Russia (Grant, 2015). During the days of Crimea annexation, the Moscow stock market plummeted by 10.8%. The period from 19/03/2014 to 30/12/2016 (end of the sample period) is regarded as a Russian crisis starting from 2014 triggered by US and European sanctions after Crimea’s annexation and being characterized by high uncertainty.
The data about sanction announcements and important macroeconomic news releases are collected manually from the Financial Times Economic Calendar (Financial Times, 2017). For international events, we document dates of important international meetings and forums such as G7, G20 and BRIC; releases of OECD Economic Outlook reports; and dissemination of OPEC monthly oil market reports. For Russia-specific events, we look at the dates of key interest rate announcements by the Central Bank of Russian Federation; announcements about sovereign debt rating changes; announcements about GDP growth rate and retail sales growth;
and key releases about real wages dynamics, unemployment, trade balance and inflation (consumer and producer price index development).
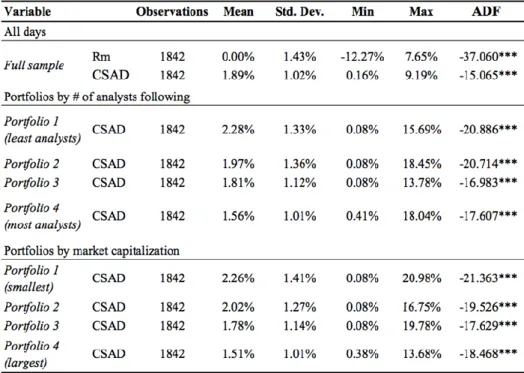
Table 2 reports the descriptive statistics of the market return and CSAD measure for the annually-rebalanced equally-weighted market portfolio. The level of return dispersion ranges from a low of 0.16% to 9.19%. Table 2 also includes descriptive statistics of the CSAD measure for eight sub-portfoliossample companies were divided into quartiles based on the number of analysts following a company and market capitalization. The higher the number of analyst
16
following the companies, the lower the dispersion of returns is, on average. Similarly, the higher the market capitalization, the lower the CSAD measure. Augmented Dickey-Fuller tests show that the returns on the equally-weighted market portfolio and CSAD measures are stationary.
Table 2. Descriptive statistics of returns on equally-weighted portfolios and CSAD
*** significant at 1% level
4. Results and discussion
4.1 Herding towards the Moscow Exchange and its asymmetries
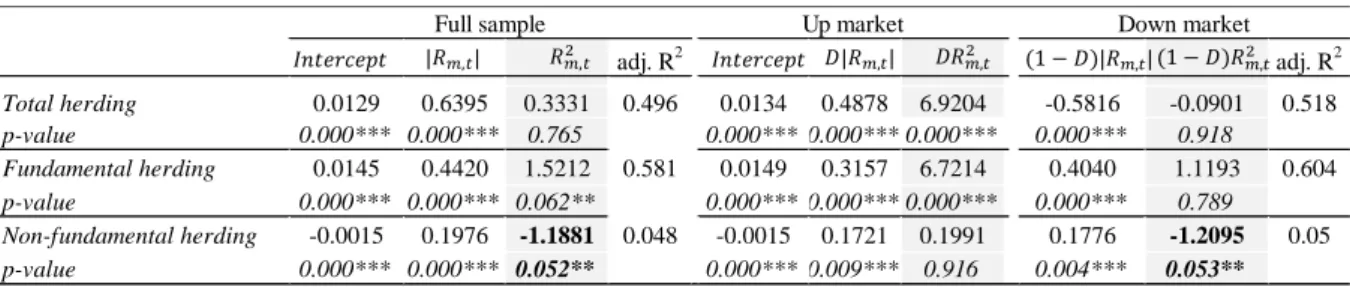
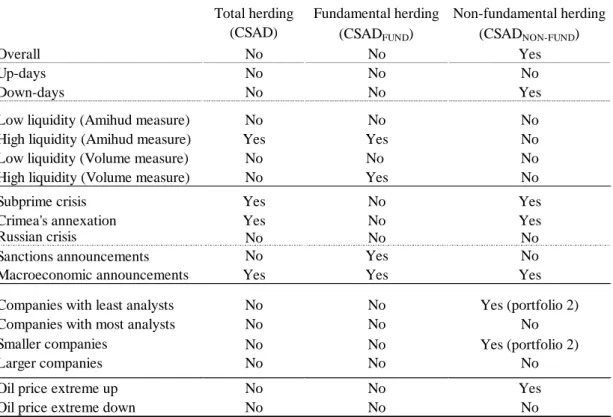
Table 3 presents the results from the equal-weighted estimations of Eq. 6-8 regarding herding towards the market. Overall, investors on the Moscow Exchange do not exhibit herding behaviour. When we distinguish between herding based on fundamental and non-fundamental factors, we find evidence of market-wide herding without any reference to fundamentals on the Moscow Exchange during the sample period, while no evidence is found for herding based on fundamental factors. We also test whether there is an asymmetric relationship between cross- sectional returns’ deviation and market returns, distinguishing between up and down markets.
The results in Table 3 show that return’s dispersion follow different patterns in up and down markets; herding driven by non-fundamental factorss is only prevalent on days with negative market returns. We find no evidence of herding based on fundamental factors neither in up nor in down markets. Thus, herding behaviour is much more likely to be encountered on days with negative market returns, being driven by non-fundamental factors.
Table 4 presents herding behaviour on days with high and low liquidity by estimating the model specified in Eq. 9. When liquidity is captured by the Amihud (2002) illiquidity measure, on overall, investors exhibit herding behaviour in periods of high liquidity driven by fundamental factors. When liquidity is measured by the trading volume, although no evidence of herding is
17
found on overall in periods of high liquidity, investors herd based on fundamental information during these days as well. In periods of low liquidity, no herding is observed, neither fundamental nor non-fundamental.
Table 3. Estimates of herding behaviour overall, and in up and down markets
* significant at 10% level, ** significant at 5% level, *** significant at 1% level.
Table 4. Estimates of herding behaviour on days with high versus low liquidity
* significance at 10% level, ** significance at 5% level, *** significance at 1%level.
Although evidence of herding is mixed, investors in emerging markets exhibit more herding behaviour than investors in developed markets (see Section 2). In contrast to other less developed markets (Chang et al., 2000; Chiang & Zheng, 2010; Tan et al., 2008; Poshakwale
& Mandal, 2014; Pochea & Pece, 2015), Russia’s emerging economy seems to be an exceptionoverall, we do not find evidence of herding formation. Thus, in the sample period the Russian stock market shares the same characteristics as the world’s largest and most profound financial markets, such as the US and the UK, where investors exhibit herding behaviour only occasionally (Chang et al., 2000; Chiang & Zheng, 2010; Galariotis et al., 2015).
Although we find no evidence of herding in total, the Russian stock market exhibits market- wide herding driven by non-fundamental factors over the sample period. This herding formation is more pronounced during down markets, similar to many other studies (Chang et al., 2000; Zhou & Lai, 2009; Chiang & Zheng, 2010; Demirer et al., 2010; Economou et al., 2011). The sample period includes a few crisis periods when the market fell substantially. In these periods of high uncertainty investors try to infer some information about future by following the market (Christie & Huang, 1995). Herding driven by non-fundamental factors on days with negative market returns might reflect the disposition effect an average investor is much more reluctant to realize losses than to realize gains (Shefrin & Statman, 1985). Thus, during down markets several investors might prefer holding their assets despite deteriorating fundamentals, and in doing so, herd. We find no evidence of herding during up markets.
McQueen, Pinegar & Thorley (1996) argue that small stocks usually react slowly to good news.
In equally-weighted market portfolios – portfolios constructed in this study – small capitalization stocks are overrepresented. This underreaction to good news for stocks being
adj. R2 adj. R2
Total herding 0.0129 0.6395 0.3331 0.496 0.0134 0.4878 6.9204 -0.5816 -0.0901 0.518 p-value 0.000*** 0.000*** 0.765 0.000*** 0.000*** 0.000*** 0.000*** 0.918
Fundamental herding 0.0145 0.4420 1.5212 0.581 0.0149 0.3157 6.7214 0.4040 1.1193 0.604 p-value 0.000*** 0.000*** 0.062** 0.000*** 0.000*** 0.000*** 0.000*** 0.789
Non-fundamental herding -0.0015 0.1976 -1.1881 0.048 -0.0015 0.1721 0.1991 0.1776 -1.2095 0.05 p-value 0.000*** 0.000*** 0.052** 0.000*** 0.009*** 0.916 0.004*** 0.053**
Full sample Up market Down market
adj. R2 adj. R2
Total herding (CSAD) 0.0127 0.7126 -1.0874 1.1182 -7.8767 0.515 0.0131 0.6049 -0.0728 4.7573 0.6758 0.509 p-value 0.000*** 0.000*** 0.564 0.458 0.000*** 0.000*** 0.000*** 0.930 0.000*** 0.622 Fundamental herding 0.0145 0.4534 2.3293 -0.9771 -5.2418 0.592 0.0144 0.4705 1.2829 2.1359 -2.3237 0.597 p-value 0.000*** 0.000*** 0.181 0.506 0.000*** 0.000*** 0.000*** 0.094* 0.233 0.011**
Non-fundamental herding -0.0017 0.2592 -3.4168 2.0953 -2.6351 0.063 -0.0012 0.1345 -1.3557 2.6215 2.995 0.064 p-value 0.000*** 0.000***0.001*** 0.012** 0.134 0.000*** 0.003*** 0.004*** 0.167 0.011**
Liquidity Amihud measure Volume measure
18
overrepresented in the sample may result in lower dispersion of returns in up markets, and thus no herding.
Herding formation displays asymmetric patterns conditioned on the liquidity of the market.
This finding is in line with several previous studies (Tan et al., 2008; Gavriilidis et al., 2013;
Lam & Qiao, 2015; Galariotis et al., 2016)investors exhibit herding behaviour in periods of high liquidity. Nevertheless, those studies do not distinguish between herding driven by fundamental and non-fundamental information. As shows in this study, on the Moscow Exchange herding during periods of high liquidity is driven by fundamental factors and, hence, should not lead to asset mispricinga result being robust to alternative liquidity measures.
When a new piece of information is released, investors adjust their positions accordingly and practically simultaneously, which is believed to cause higher-than-average liquidity on the market.
4.2 Herding and calendar effects
Table 5 presents the results from the estimations of Eq. 10-12 regarding herding during three crisis periods (panel A) and on announcement days of sanctions and important macroeconomic news releases (panel B). Investors on the Moscow Exchange exhibited herding behaviour during the subprime crisis and Crimea’s annexation, while no such behaviour is observed in the aftermath of Crimea’s annexation. Although the herding behaviour, if present, is driven by non-fundamental factors; investor’s fear might have been, at least partly, driven by fundamentals (negative β2 coefficients in regressions on fundamental herding during Crimea’s annexation and in its aftermath).
We find robust evidence that macroeconomic news releases (e.g., key interest rate, GDP growth, unemployment rate announcements) affect the cross-sectional dispersion of returns (panel B). Herding is driven by both fundamental and non-fundamental factors (significant and negative β2 coefficients). Moreover, herding driven by fundamental factors is encountered on days of sanctions announcements. Investors, however, do not exhibit herding behaviour an overall and on non-fundamental factors during sanction announcements.