Tamás Kocsis
Is the Netherlands sustainable as a global-scale Inner-city?
Intenscoping spatial sustainability
Published in. Ecological Economics 101, May 2014, Pages 103–114
Abstract: Is the Netherlands sustainable or not? The answer inherently involves addressing the issues of system boundaries, statistical units and a vision of sustainability. As an analytical answer we offer the Intenscope (IS), a two-dimensional graphical tool based on dimensionless percentages of triple rate ratios which overcomes several limitations of sustainability
analyses. First, it is not sensitive to the size of statistical units so an area with twice the amount of resources of another, with double the population (and double the total consumption) would have the same triple ratio of population:biocapacity:consumption.
Second, the IS is sensitive to anomalies which may originate either from the use of arbitrary statistical units (e.g. the boundaries of a city) or those which may indicate truly unsustainable practices. To judge spatial sustainability we use ecological footprint data from which we construct a plausible country plot based on the IS. Despite the relative nature of IS-analyses, the employed consumption:biocapacity ratio inherently refers to the absolute limit of
sustainability: we cannot continually use more resources on a global scale than nature provides us with. The analysis introduces some associations of human preferences and attributions of settlement types which may help to elaborate sustainability policies based on voluntary action.
“It simply does not seem fair to compare large—in terms of economic activity or land area—
and small countries. And similarly, the comparison of sparsely populated, large countries, such as Australia, Canada and the USA, with densely populated, small countries in Europe, is a bit like comparing cities with continents.” (van den Bergh and Verbruggen, 1999, p. 67)
1. Introduction
Undertaking environmental assessments of territorial areas has by now become a far-reaching project (Graymore et al., 2008, Loiseau et al., 2012). Critiques of local/country level
sustainability measures, like the ecological footprint (Wackernagel and Rees, 1996), often target their spatial ambiguity. The ecological footprint seems to be sensitive to the statistical units which are employed, and thus generates confused messages about sustainability. “It is easy to achieve a smaller Ecological Footprint [deficit] where the boundary around a city is drawn wide enough to include agricultural land ... Portney (2003) discusses annexation as a strategy for reducing the Ecological Footprint [deficit] of a city, which might work in terms of reducing the Ecological Footprint ‘score’, but would achieve precisely nothing in terms of actual environmental impact” (McManus and Haughton, 2006, p. 121).
What is more, one of the most widely-used outputs of ecological footprint analyses which is mediated to the public is per capita footprint compared to a ‘fair share’ of the Earth’s
resources. For example, “if everyone in the world lived like an average resident of the United States or the United Arab Emirates, the biocapacity of more than 4.5 Earths would be required to support humanity’s consumption rates. ...if the world lived like the average person in India did in 2007, humanity would be using less than half the planet’s biocapacity” (GFN, 2010, p.
39). This reporting format defines individual levels of (un)sustainability, which is also the main output of footprint questionnaires which are found on the internet (Franz and Papyrakis,
2011). However, the problem here is that this approach takes for granted the world’s
population and consequently this approach is insensitive to population and population density.
So far the present author has not seen a sustainability analysis which resulted in a conclusion of the following type: “if every region in the world was as densely populated as an average region of the United States, humanity would be using less than three-quarters the planet’s biocapacity, or…if the world’s population was as uniformly dense as the average region in India was in 2007, the biocapacity of more than 4.5 Earths would be required to support humanity’s consumption.” Of course, these sentences take for granted a (world) average level of consumption – which is the other side of the coin, besides population. We may refer to this approach as a community level of (un)sustainability.
We know that it is easier to collect per capita data than per region data because defining comparable regions and collecting reliable data about them is a challenging task. But this argument is insufficient to support a consumption approach while neglecting population and density issues during sustainability communications. An important task is thus to flag up the importance of population and density and raise them to the level of importance given to consumption (Alcott, 2012).
It goes almost without saying that another strong stream of environmental thinking places the blame on ’overpopulation’. For example: “The key to understanding overpopulation is not population density but the numbers of people in an area relative to its resources and the capacity of the environment to sustain human activities; that is, to the area's carrying capacity.
... By this standard, the entire planet and virtually every nation is already vastly
overpopulated” (Ehrlich and Ehrlich, 1990). While we share the view that a more ecological
’population density’ notion should be correlated to an area’s biocapacity, we are reluctant to agree that all the areas of the world are already overpopulated.
In the analysis described in this paper three types of resource use are differentiated. (1) Local, when an entity uses its own biocapacity/renewable resources; (2) Internal, when an entity uses another’s biocapacity/renewable resources within the system under analysis (resource use in space; local deficit; see Moran et al., 2013); and (3) External, which includes two cases: (3a) if there exists a bigger system of incorporation: the entity uses another's
biocapacity/renewable resources outside the analyzed system and (3b) if our focus is the entire Earth: the entity consumes non-renewable resources after depleting all local and internal renewable resources (this case implies resource use which generates cost to future generations and is usually referred to as ‘global overshoot’).
This paper supports three interrelated scientific arguments. (1) The Intensity Scope (later Intenscope or IS) as a 2D graphical system is a tool which can be used to highlight and communicate basic consumption–population–sustainability relationships. (2) Constructing an analysis based on IS which is completed by using associations of preferences and attributions of settlement types is a powerful way to bypass the ‘Netherlands fallacy’ which originates from comparing different statistical units. (3) Demonstrating intergenerational and
intragenerational (in)equality of resource use is made spectacularly clear through using an IS- type plot.
The structure of this paper is as follows: after describing the mathematical foundation of the Intenscope we present a three level analysis: (1) a theoretical one on the local, household level; (2) an associative one at the regional level; and (3) an empirical one at the global level using existing available ecological footprint data. These analyses are designed to demonstrate the potential of the IS concept. At the end of the paper we briefly describe and discuss some critiques of the Ecological Footprint; the nature of the notions of urban and rural; the strategic role of integrating preferences and settlement attributions into the analysis and the political dimensions of assuming voluntary or involuntary positions with resource use. It is important
to note that related economic-monetary (Latouche, 2010, Willemen, 2010, Duro and Teixidó- Figueras, 2013) and hedonic (Kerekes, 2011, Kopmann and Rehdanz, 2013, MacKerron and Mourato, 2013) considerations are omitted from this approach. Their involvement is
important for further analysis and for obtaining a more comprehensive answer to the research question at hand (Kocsis, 2012), but their omission here is necessary for reasons of clarity and because of the frequent unavailability of comprehensive and reliable estimates.
2. The Intenscope (IS)
Imagine an object about which we possess three items of data: A, B and C (this is the reference object; A, B, C > 0). A large literature can be found in which none of these measures in itself is treated as the most important factor, but rather their rates or ratio is considered (A:B, B:C, A:C or their reciprocal value). All of this information can be condensed into the triple ratio A:B:C. In this case, the following equation holds: (A/B) * (B/C) = A/C which means that there are only two different rates and all the others are
dependent on these. This is a system of two degrees of freedom which is easy to demonstrate using a two dimensional graphical system.
Now, imagine another object with its own three references: a, b, c (a, b, c > 0). For the purpose of comparison, a system can be developed, which puts all the objects with the same a:b:c triple ratios at the same position. If the triple ratios of A:B:C and a:b:c are identical then all possible rate ratios formed by them will equal 1. (A/B):(a/b)=1 and (B/C):(b/c)=1 and (A/C):(a/c)=1.
If A:B:C and a:b:c are different triple ratios then a vector can be used to depict the difference, with both magnitude and direction (both to the reference object). To construct a system with the above characteristics the Intenscope (IS) was developed. Into the pole of the system we place the reference object which represents the A:B:C triple ratio. Let this equal 100% in
every possible relation (Fig. 1) (this is the top of an imaginary pyramid viewed from above;
see later). Every direction and distance from this center pole has its own specific meaning and depicts the relation of a:b:c to the reference A:B:C. Numbers are dimensionless percentages on this graph which makes this approach extremely powerful in comparison to different aggregates or ‘parts and the whole’-type analyses.
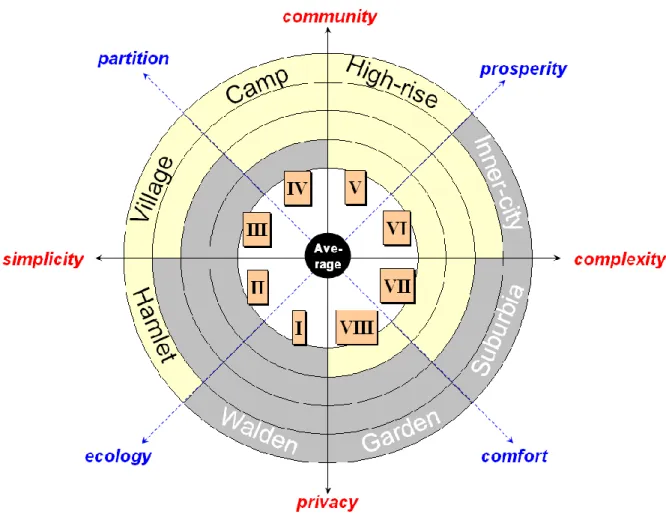
Fig. 1 Possible structure of the Intenscope. (Note: later in this paper we use ‘a’ to represent population /capita/, ‘b’ for biocapacity /gHa* or pasture/ and ‘c’ for consumption /gHa or cow/)
Fig. 1 summarizes the structure of rate ratios used in the IS system. For example, a movement which has a component ‘pointing to the right’ means that (C/A)<(c/a), where (C/A) is the reference figure indicated at 100%. The above-described inequality may hold if C<c and/or A>a. For further information on the interpretation of the system, see section 3.
3. Farmers, pastures and cows: a local level analysis
Imagine a region (a closed island) where nine similar, 4 person (A) farming families live, with 16 acres of pasture (B) and 4 cows per family (C). This gives us the triple ratio of 4:16:4. For technical reasons it is possible that we may only have aggregate-level data for this region: 36 people, 144 acres of pasture and 36 cows, giving us the triple ratio of 36:144:36. However, this means the same for every pair that is compared: 1 cow per person, 4 acres per person, and 4 acres per cow independently of the level of aggregation (we suppose that 4 acres per cow is the sustainable level for the region). Now we can choose these identical triple ratios as our reference points to represent 100% (see the center point ‘B’ in Fig. 2. – in the above situation, at time t0, each point which represents a family would be at the center of the system).
We now describe four basic event scenarios, supposing that household-level data is available.
We assume that at time t1 these households start interacting with each other. For the sake of clarity we suppose that the size of each family’s pasture remains constant. Fig. A.1 in the Appendix summarizes all the cases described below.
A. The population – consumption trade-off. As family A– prefers comfort it sends two persons over to family C+ which prefers partition. C+ adds a further two people to the family (e.g. two children, who may represent the future generation at time t0 which is realized at time t1). C+ will now have 8 people, 16 acres and 4 cows (8:16:4) while A– will have 2 people, 16 acres and 4 cows (2:16:4). Comparing them to their starting position we see that C+ has a simpler lifestyle as the ratio of capita/cow has doubled (from 4/4 to 8/4; 200%), and has
developed a more community-oriented lifestyle (more people in the same area) as the rate of capita/pasture has doubled too (from 4/16 to 8/16; 200% – Fig. 2). A combination of all three measures can be condensed into the formula of capita2/(cow·pasture) which shows a fourfold (400%) increase over the original value for family C+. If we think of the cow/capita ratio as being the level of consumption (welfare), then, as pastures are constant, this indicates a preference for population over consumption: (capita) to (cow/capita). So C+ demonstrates a strong, 4-fold (400%) preference for population over consumption regarding the reference point, while A– is shown to prefer consumption over population 4-times as much (for reasons of brevity A–‘s position is not detailed here but it is easy to derive based on the above
description of C+) (Fig. 2).
To sum up this development, A– and C+ are using all of their pastures fully and neither is accumulating ecological debt or credit. C+ is 4-times as populated as A– and consequently its per capita consumption is only a quarter of A–‘s.
B. The population issue. As family B– prefers privacy it sends two people over to family B+
which prefers community. These two people bring their two cows with their share of pasture from family B– to family B+. In practice, B– could let these two cows use their original pasture, or B+ could take half of the grass from B–‘s pasture (which could then be considered B+’s ecological footprint on B–‘s pasture). This is B+’s additional resource demand in space.
The community-oriented family B+ takes on responsibility for another two people as well (e.g. two children who may represent the future generation at time t0 which is realized at time t1). However, 6 cows for an 8 person family is not enough to allow the original per capita consumption rate to be sustained, thus the family start fertilizing their pasture to sustain an additional two cows. As artificial fertilizers require further inputs (including non-renewable resources) they relate to B+’s additional resource use in time (imposing costs on future generations).
Fig. 2 Farmers, pastures and cows: Local level sustainability analysis using the Intenscope (Note: the starting situation, where all nine families were identical to family ‘B’, is not presented here; a summary of all the cases can be found in Fig. A.1)
Ultimately, family B+ will have 8 people, 16 acres and 8 cows (8:16:8) and B– will have 2 people, 16 acres and 2 cows (2:16:2). Comparing them to their starting position we see that B+ is practicing a strategy of partition as the rate of capita2/(cow·pasture) has doubled (from 0.25 to 0.5). This brings prosperity, as the rate of cow/pasture has doubled too (from 4/16 to 8/16; 200% – Fig. 2). However, B+ shows the most definitive change in the dimension of community (a combination of partition and prosperity) as the rate of capita/pasture also
doubles here (from 4/16 to 8/16; 200% – Fig. 2. See also that B+ has a different position on the imaginary pyramid in contrast to C+). For reasons of brevity B–‘s position is not detailed here but it is easy to derive based on the above description of B+.
To sum up the development, B– is ‘under-exploiting’ its pasture, the rest of which is used by B+; furthermore, B+ is using fertilizer to support two additional cows. B+ is 4-times as populated as B– while their per capita consumption is the same.
C. The consumption issue. As family C prefers simplicity it gives two cows with their share of pasture to family A which prefers complexity.1 In practice, C could let these two cows use their original pasture, or A could take half of the grass from C‘s pasture (which could then be considered to be A’s ecological footprint on C‘s pasture). This is A’s additional resource use in space. However, 6 cows for 4 people is not enough for A to keep up with the consumption level of family A– (family A– serves as a point of reference to A) thus they start fertilizing their pasture to sustain two additional cows as well. As artificial fertilizers require further inputs (including non-renewable resources) they relate to A’s additional resource use in time (imposing costs on future generations).
Ultimately, family A will have 4 people, 16 acres and 8 cows (4:16:8), while C will have 4 people, 16 acres and 2 cows (4:16:2). Comparing them to their starting position we see that A’s level of prosperity has risen as the rate of cow/pasture has doubled (from 4/16 to 8/16;
200% – Fig. 2), as has its level of comfort as the rate of (cow·pasture)/capita2 has doubled (from 4 to 8; 200%). However, family A shows the most definitive change in the complexity dimension (a combination of prosperity and comfort) and the rate of cows/capita has also
1 Simplicity and complexity refer to entropy and biophysical economics here (Georgescu-Roegen, 1971).
Complexity often stems from using high energy sources to maintain low entropy structures such as public lighting, public utilities, pavements, etc. (Sutton et al., 2009).
doubled here (from 4/4 to 8/4; 200% – Fig. 2. See that A is located at the edge of the imaginary pyramid). For reasons of brevity C‘s position is not detailed here but it is easy to derive based on the above description of A.
To summarize this development, C is ‘under-exploiting’ its pasture, the rest of which is being used by A; furthermore, A is using fertilizer to support two additional cows. A’s per capita consumption is 4-times that of C‘s, while their population is the same.
D. The prosperity issue. As family C– prefers ecology it sends two people and three cows with their pasture over to family A+ which prefers prosperity. In practice, family C– could let these three cows use their original pasture, or A+ could take three-quarters of the grass from C–‘s pasture (which could then be considered to be A+’s ecological footprint on C–‘s pasture). This is A+’s additional resource use in space. The prosperity-oriented family A+
takes on responsibility for another two people as well (e.g. two children who may represent the future generation at time t0 which is realized at time t1).
However, 7 cows for 8 people in family A+ is not enough to keep up with the consumption level of family A (family A serves as a reference point to A+) thus family A+ starts to fertilize its pastures and mechanize its process to sustain an additional nine cows. As the mechanizing and fertilizing processes require lots of non-renewable resources they represent A+’s
additional resource use in time (imposing costs on future generations).
Ultimately, family A+ will have 8 people, 16 acres and 16 cows (8:16:16), while C– will have 2 people, 16 acres and 1 cow (2:16:1). Comparing them to their starting position we see that A+ is strengthened in the area of community as the rate of capita/pasture has doubled (from 4/16 to 8/16; 200% – Fig. 2) and has reached a higher level of complexity as the rate of cow/capita has doubled (from 1 to 2; 200%). However, A+ shows the most definitive change in the prosperity dimension (as a combination of community and complexity) as the rate of
cow/pasture has quadrupled (from 4/16 to 16/16; 400% – Fig. 2. See that A+ lies at the lateral face of the imaginary pyramid). For reasons of brevity C–‘s position is not detailed here but it is easy to derive based on the above description of A+.
To sum up this development, C– is only partly using its pasture which is mostly used by A+;
furthermore A+ is fertilizing its pastures and mechanizing its processes to support nine additional cows. Both A+’s per capita consumption and population are 4-times that of C–, indicating 16-times higher resource intensity.
Note that only positive preference associations were used in the four basic scenarios described above and we supposed that all families voluntarily chose their new positions in the system.
Using terms such as deprivation (C+), under-development (C–), selfishness (A–), exploitation (A+) or overpopulation (B+) may be justified in a different research context. Positive
preference associations are strategically employed in this analysis in order to support the notions of biophilia and topophilia (Tidball and Stedman, 2012, Devine-Wright, 2013), while occurrences of involuntary inequality must still be considered in the research agenda (see section 7.4).
On Fig. 2 it is important to realize that all the positions of the families indicate
unambiguously their inclination to be either creditors or debtors (if the original 4 acres per cow can be considered to be sustainable for the region). Family C+, B and A– fully use their ecological possibilities – the only difference between them is their preference for population over consumption (in truth, all points on the C+/A– diagonal represent sustainable states).
These families have neither credits nor debits. However, family C and B– function as slight ecological creditors in the system, while C– is a big ecological creditor. At the same time, family B+ and A are small ecological debtors while A+ is a big ecological debtor. As all the debt cannot be cancelled out by the credit available in the system, aggregate debt has
consequences not only in space but in time too (through the use of resources external to the
system). The new system average can be described by the triple ratio of 42:144:49 which lies 136% toward prosperity from the reference point B (see the point ‘AVG’ on Fig. 2) and indicates the general unsustainability of the nine families in question. If the nine families were considered to represent the whole world, this would indicate a situation of global overshoot.
If, however, the system average could be located somewhere on the sustainable C+/A–
diagonal (depending on preferences), then the system would only display internal inequalities in resource use (local deficits and surpluses would be in balance).
Note that the above-mentioned diagonals in Fig. 2 could express different technological levels (intensities) of development (regarding resource use). It is possible that C– might not have the technological capability to more intensively exploit resources on its own territory; C and B–
might have slightly more developed technological capabilities for exploiting half of their own resources; C+, B and A– might be fully able to use their local renewable resources while B+
and A might have the technological capacity to involve external resources too. A+ might have the most powerful and advanced (agricultural) technology which is enabling it to build up a huge ecological debt (Mózner et al, 2012) – but on the other hand, also enabling it to prosper the most: family A+ is providing the greatest per capita welfare to the greatest amount of people. Thus, technological intensity may be defined as the number of cows per family’s own territory– regardless of their footprint on others’ territories (Fig. A.1). In turn, there are technological prerequisites for using other families’ (or other generations’) biocapacity to raise our own welfare.
4. Human ecography: regional level analysis
“For him who flies above it, a map is all he sees, / this living scape of being but symbols and degrees (…) / what's hidden in the map? yes, barracks, mills and arms, / but for me crickets, oxen, steeples, quiet farms; / with field-glasses he marks the crops and industries, / but I, the
trembling labourer, the forest trees, / the twittering orchards, vineprops with their tended grapes…” Miklós Radnóti: I know not what…2
This whole poem highlights what we would today call topophilia, its alternating viewpoint opens the mind towards making a higher level analysis, from local to the regional, where different types of ‘living scapes’ are easily distinguishable. Such imaginary and associative imagery may have an important role in fostering the coming into existence of a scientifically circumscribed and balanced concept of sustainability. One of the most illustrative examples of how the human imagination can be captured and supplemented by the structure of science is the concept of the ecological footprint (EF) itself. Even critics of the EF acknowledge its power to frame human thinking about consumption, population and sustainability (McManus and Haughton, 2006). Facilitating the identification and understanding of basic types of differences in relation to a well-chosen reference point at the regional level is a strategic goal of the IS system too. Here, on the regional level, we offer an associative (and thus somewhat speculative) approach: the concept of human ecography. Finding the meanings of the eight sectors of any IS system3 is a strategic goal which can help with understanding what development paths (positions and directions of movement on an IS-plot) are possible. An examination of how the preferences introduced in section 3 may be combined with the most appropriate settlement forms is now presented.
To start with, it is important to remember that recent writings concerning ecological
sustainability often describe cities as sources of unsustainability (Rees–Wackernagel, 1996).
Based on these notions we hereby define rural regions as ecological creditors while urban regions will be regarded as ecological debtors – irrespective of their administrative status.
2 In Dávidházy, 1997, translated by Zsuzsanna Ozsváth and Frederick Turner.
3 For these sectors we often use the term ’octant’ in this paper.
Following on, we give a short description of the eight attributes of basic types of ‘living scapes’ (Fig. 3) which are the artificial categories employed along the IS-axes. These axes should not be thought to be clean-cut borders between the octants of the system; transitions between them are gradual. During the following description we suppose that the reference point – the pole of the pyramid – lies exactly at the margin of sustainability (see section 3); a position of neither credit nor debit.
Fig. 3 Intenscoping preferences and settlement type attributions (target style representation)
I. Walden. In honor of the classic writing of Thoreau (1989), our first octant on the IS plot is named ‘Walden’ (equal to ‘wilderness’). Biocapacity-related population densities are well below average here and Walden-type ‘communities’ are big ecological creditors in the
system. It is not surprising that Walden represents the best place for people who prefer ecology and privacy.
II. Hamlet. Entities which can be located in the hamlet sector are also big ecological creditors of the system and have well below average per capita consumption. There is a tendency for settlements to take the form of small groups of houses, and the hamlet is the place most suitable for people who prefer ecology and simplicity.
III. Village. In villages an above-average concentration of people is paired with well under- the-average levels of per capita consumption. Population is preferred over consumption in this sector. This combination gives the village a rural character and creating ecological credit is still a possibility. Simplicity and partition are the dominant preferences here.
IV. Camp. This is the first sector which creates an ecological debt. Hardin’s Tragedy of the Commons (1968) is well illustrated by this mode of settlement, as the main source of ecological debt is the population. However, partition and community as the dominant preferences may legitimize this type of situation for those who prefer these attributes.
V. High-rise. This octant is more structured and thus more resource-intensive than the ‘camp’
sector, while population density is still very high. This creates significant ecological debt. A preference for community and prosperity (as has been experienced through history: an increasing number of people have striven to become wealthy) usually pushes the whole human system in this direction.
VI. Inner-city. Inner cities start to prefer consumption over population. As an inner-city still has an above-average population density this again implies a high ecological debt. A
preference for prosperity and complexity is common to those who happily live here.
VII. Suburbia. North-American suburbia is well-known for having a wealthy lifestyle with a relatively low population density and more space (biocapacity) per capita compared to inner-
cities. A preference for comfort and complexity (consumption) makes suburbia the best place for those who share these preferences, while its ecological debts clearly highlight the fact that this lifestyle cannot be followed by a majority of people without the creation of further ecological debt.
VIII. Garden. While territories such as gardens are still consumptive and wealthy their population density is so low – or their level of biocapacity is so high – that they may be considered somewhat rural as a whole. They are able to provide some ecological credit for the use of others. Privacy and comfort are the ruling preferences here.
When reviewing these octants it is important to note that none of them can be considered objectively ‘good’ or ‘bad’ by themselves, even with regard to sustainability. Differences from the system average imply differences in resource use in space. The whole system may still be sustainable if the system average lies below or at the margin of sustainability. If this is not the case (with a situation of general unsustainability), resource use in time occurs at the cost of future generations. Solving this problem requires human actors to manipulate the system average to make it favor ecological preferences (Fig. 3).
Strategies for reaching general sustainability are manifold and complex in a system with the different types of inequalities shown in the IS-plot. Different communities with different preferences in different positions must find conflict-free solutions to their problems, which appears to be a hard task. However, accepting the diversity which exists may be the key to grounding and designing successful strategies of sustainability. Accordingly, based on the above-described categories which are derived from the study of settlement geography, human ecology (Hawley, 1986), land system architecture (TurnerII et al., 2013) and landscape ecology (Verburg et al., 2013), we now propose the establishment of a sustainability-oriented scientific stream of study called human ecography.
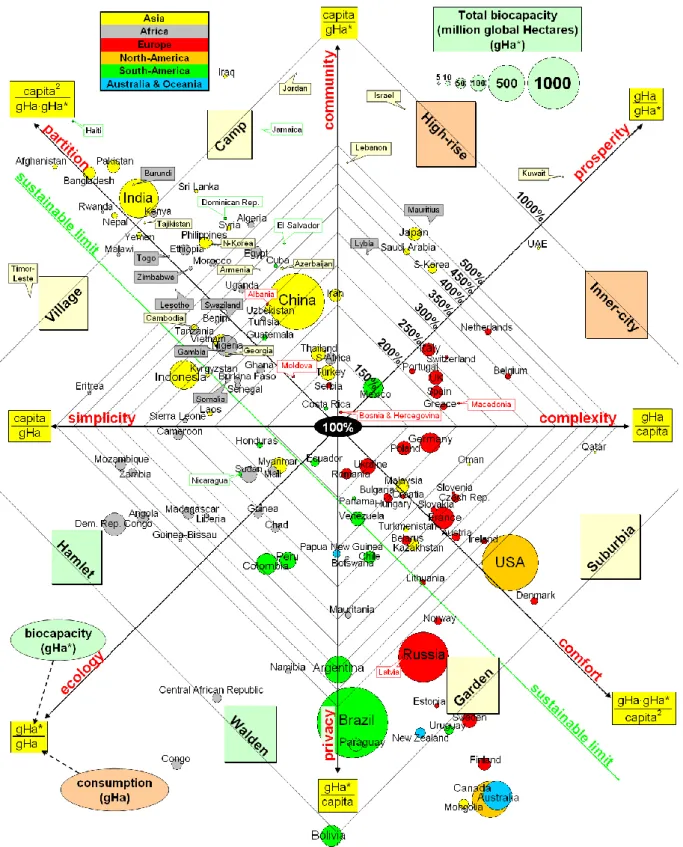
5. Intenscoping countries of the world: global level analysis
Turning to the global level we can identify the macro regions of the Earth (Imhoff et al., 2004, Sutton et al., 2012). However, statistical data for these regions is usually available only at the country level. The ecological footprint database is an appropriate source from which to fill up our IS plot with empirical data. There is more information about regions within which there are many small countries (as is the case with Europe) while only a rough picture can be gained of large countries like the USA, China and Australia. The IS can be used to compare those different aggregates: a plot can be constructed on which small countries with small amounts of biocapacity are indicated with small points, while huge countries with lots of biocapacity are indicated using proportionally larger points. This refers to the level of data aggregation too: these points represent the averages of smaller systems (US data are related to state-level data, state-related data are related to county-level data, and so on).
Thus our global view inherently means that the detail contained within a country is masked.
For example, Brazil compared to the world average looks like an entity on the verge of being a Walden/Garden although it contains some of the most well-known urban slums in the world, such as those found in Rio. While Brazil as a whole is rather a community that can be
described as a Walden/Garden, a more detailed profile could be constructed on the basis of a regional or local level analysis if the necessary data were available. However, as the
Netherlands is a relatively small entity it is much more appropriate to describe it as a global- scale inner-city.
To translate our local level measurements into global ones we introduce two changes. First, meadows are measured in global hectares of available biocapacity (gHa*). Second, the unit of measurement for cows is global hectares of actually used biocapacity (gHa), regardless of whether these hectares are local or distant in space or in time (Fig. A.1).
Fig. 4 shows an IS plot of the world’s countries which includes all those countries which had more than 1 million inhabitants in 2008.4 Data is derived from the official, freely-
downloadable version of the ecological footprint database from Global Footprint Network.5 As a reference point (100%), the actual world average was chosen (as given by the footprint database). This corresponds to the triple ratio of 6740:11967:18192
(population:biocapacity:consumption – where population is in units of million people and biocapacity and consumption are measured in million global hectares). The
consumption/biocapacity rate indicates a rate ratio of 152% global overshoot in terms of resource use, which indicates the use of additional resources in the dimension of time (e.g.
depletion of the stock of fossil fuels). Note that the reference point of Fig. 4 is tied to the actual consumption/biocapacity rate, thus the ‘sustainable limit’ line lies at 152% towards ecology from the center of the IS-plot). Each point on the sustainability line indicates that the rate of consumption/biocapacity equals 1. This expresses the fact that we have a single Earth.
A country which lies on this line consumes exactly its biocapacity (neither more nor less).
4 Except for Occupied Palestinian Territory (‘Camp’), Singapore (‘High-rise’) and Gabon (‘Walden’) due to their extreme differences from the world average.
5 Data are from the National Footprint Accounts 2011, Edition 1.0, www.footprintnetwork.org (database version:
May 7, 2012).
Fig. 4 Intenscoping countries of the world using the EF database (2008; for the 100%
reference point see Fig. A.1)
For a better understanding of the IS country plot (Fig. 4) we indicate both layers of our lower level analysis on it: preferences from the local level analysis (section 3) and settlement type attributions from the regional level analysis (section 4). To correctly read the plot one should:
(1) find the object’s perpendicular projection to the axis in question; and, (2) check the contours of the pyramid to identify the correct intensity proportion (%) for the axis in question.6 Data for the Netherlands is summarized in Fig. 5a. Based on this method, three types of statements about sustainability can be formulated and a judgment can be made about population/consumption preferences.
First, the Netherlands’ most defining characteristic is shown on the prosperity axis: its land use is over four-times (403%) as intense as the world average in 2008. By multiplying this by 1.52 (the global overshot in 2008) we can state that if every country of the Earth overused its own resources in the way the Netherlands did in 2008 then we would need more than 5 additional Earths (613%). Second, the Netherlands’ second best defining characteristic is its complexity (235% compared to the world average) and this designates the country’s place on the plot in the Inner-city sector. Using the global sustainability multiplier of 1.52 we gain a figure of 357% for complexity. This means that if every person in the world consumed biocapacity like an average Dutch person did in 2008 then we would need more than an additional two and a half Earths. Third, indicating an additional but less defining
characteristic, the position of the Netherlands on the community axis lies at 172%.
Multiplying this by 1.52 we gain 261%, which means that if every region in the world were as densely populated as the Netherlands (population density refers to available biocapacity here) then we would need more than an additional one and a half Earths. Lastly, at the
6 See how the contour lines of the pyramid become denser as one moves away from the center (Fig. 4). This characteristic originates from the logarithmic nature of the IS system.
partition/comfort diagonal the Netherlands’ slight preference for consumption is revealed at 137% of the world average. Notice that this dimension is independent from sustainability;
there is a possible trade-off between consumption and population given the same use of resources (section 3, case A).
To sum up, the position of the Netherlands near to the prosperity axis indicates that both its per capita consumption and its population density should not serve as good examples of sustainability to the world. However, it is not sure that humanity can do without settlement patterns such as inner-cities which historically have often served as the source of innovation, civilization and development (supported by other huge, intact natural areas) – while we also know that further movement of the world average towards prosperity is impossible in the long term.
It is clear that different regions of the plot indicate different types of sustainability problems and sustainability positions. For example, the USA and India have nearly the same country- level resource deficit. On a per capita ecological footprint basis average Indians may serve as good examples to the global population in terms of achieving global sustainability, while US- based Americans are seen to be among the worst cases (note that the level of analysis usually mentioned in global or country level sustainability reports, online footprint quizzes, etc. is the per capita consumption level). However, using the metric of resource based population density the USA can be seen to be performing quite well while India is among the worst performers. This may originate from the fact that India displays a strong preference for population/partition and the US for consumption/comfort (Fig. 4). Of course, none of these preferences are intrinsically good or bad in themselves as long as country-level sustainable resource use is maintained (this was not the case for either the USA or India in 2008).
6. Changing characters through different reference points
Ruling preferences and settlement-type attributions are highly dependent on the chosen reference point and this is also the case when seeking local and global sustainable patterns.
Even identifying ‘poverty’ is dependent on the reference point employed (see Townsend, 1979) and what could be called a simple life in the United States (Elgin, 1993) could be defined as a highly complex lifestyle elsewhere (Kocsis, 2002, Chapter 5). However, it is important that choosing a different reference point does not change the hard facts of sustainability: our consumption (gHa) should not continually exceed, on a global basis, the resources available (gHa*). This relation is clearly reflected by the ‘sustainable limit’
diagonal on Fig. 4 which is indifferent from the chosen reference point.
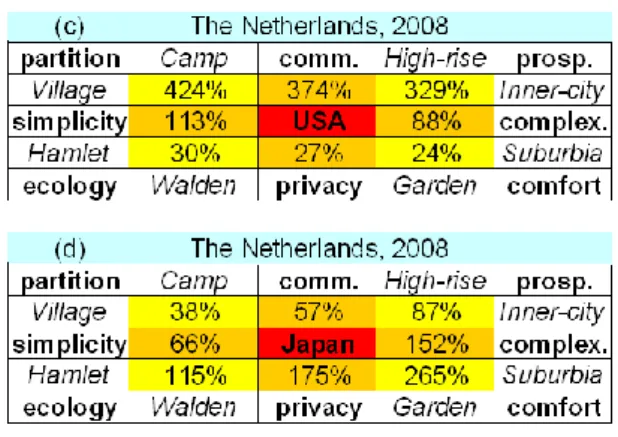
Fig. 5 illustrates some examples of the importance of the reference points which are used, employing data from the Netherlands. Fig. 5a describes the position of the Netherlands using the world 2008 average as a reference point (this scenario was used to construct the IS
country plot in Fig. 4.), where the Netherlands was situated in the Inner-city sector. However, if we, for example, hypothesize a sustainable world with a population of 10 billion, we can also create a hypothetical reference point based on this future scenario (Fig. 5b). In this theoretical future the modern Netherlands would still be mapped into the Inner-city sector, albeit with a more definite preference for complexity (supposing that the country and global biocapacity remained unchanged). This is not surprising because a world of 10 billion
inhabitants must significantly reduce its per capita consumption on average to achieve a state of sustainability.
Fig. 5 Changing IS positions for the Netherlands depending on the reference point selected: a) World – 2008; b) Fictitious sustainable world with 10 billion inhabitants; c) USA – 2008; d) Japan – 2008. (Note: labels in bold in the outer cells are preferences; labels in italics in the outer cells are settlement-type attributions)
The focus of the analysis can also easily be changed by using a specific country as the central referent instead of a theoretical average. Figures 4c and 4d are examples of this using the USA and Japan as reference points. From the perspective of the USA, the Netherlands is rather a Camp than an Inner-city as partition and community appear as the most characteristic Dutch preferences (Fig. 5c). However, when using Japan as a reference point the Netherlands could be classified as a Garden, having the main preferences of privacy and comfort (Fig. 5d).
IS-analysis can also be performed using a historical reference point (see Ellis et al., 2013). For example, historical data about the Netherlands could be chosen as a reference point and then changes over time could easily be followed and interepreted.
7. Discussion and conclusions
Let us re-visit the original question: is the Netherlands sustainable or not? The answer inherently involves consideration of the issues of system boundaries, statistical units and a specific vision of sustainability. To answer this question we graphically represented triple rate
ratios by developing the concept of the Intenscope (IS). This tool may be useful for analyzing local and global relationships and their connections to sustainability.
By using different triple rates of population:biocapacity:consumption and comparing them as ratios we create a coherent system which can be used to study and compare sustainability between different aggregates or statistical units. Thus the first scientific claim about the analytical power of the IS-system may be confirmed. Evidence in support of the second and third claims (regarding the importance of introducing preferences and settlement type attributions into the analysis and the graphical power of the IS to indicate inter- and
intragenerational (in)equality in resource use) was also provided above.7 The IS appears to be appropriate for enhancing the graphical representations of the outputs of local and regional scale sustainability analyses (see Bagliani et al., 2008, Hopton and White, 2012, Moore, 2011).
Four topics which relate to the main outcomes of the analysis are now addressed in brief.
They include: (1) providing a response to some critiques of the ecological footprint; (2) an elaboration of the multilevel understanding of urban and rural; (3) a short overview of the role of introducing preferences and settlement type attributions in sustainability strategies; and (4) a description of some of the political implications of involuntary positions in resource use.
7.1. Critiques related to the Ecological Footprint (EF)
Though the focus of this paper was not the EF itself, data based on this concept had a strategic role in the construction of IS country plot. The teeth of some of the critiques – often
formulated by researchers from small, prosperous countries – about the insensibility of the EF
7 As IS works in two dimensions it would be superfluous to develop a 3D ecological footprint (Niccolucci et al., 2011) without involving new data into the analysis.
towards regional features and global trade can be drawn by the following observations about the IS. First, the IS can be constructed on a local or regional level, not just a global one.
Second, the differences in internal resource use can be judged by the item positions around the average on the plot, while the aggregate external position of the analyzed system is clearly indicated by the system average’s distance to the ‘sustainable limit’-diagonal. By drawing a global level IS-plot this distance clearly indicates general unsustainability; a debt deferred to future generations.
Consequently van den Bergh and Verbruggen’s classic critique that: “…a single, aggregate indicator like the EF does not allow for trade-offs among the three central dimensions of ecological economics’ evaluation, i.e. efficiency, equity and sustainability” (1999, p. 64) may be countered. Note that in the construction of the IS we took advantage of the fact that EF databases provide two types of data for each country: one which describes consumption and one which describes available biocapacity (which was completed using population data).
Thus, using the IS-plot three data items per object were used to (approximately) estimate the distribution of biocapacity (size of the objects on the plot); allocation (the objects along the simplicity–complexity axes); equity or inequality (variance around the average); and scale (Daly, 1992) (distance from the ‘sustainable limit’-diagonal). To value efficiency would either require the introduction of other measures (such as GDP or subjective well-being) or any of the eight rates along the IS-axes could be seen as a specific efficiency indicator.
Interpretation of the IS-plot also seems to partially address critiques about the use of different or inadequate statistical units: “The EF completely neglects comparative advantages of countries and regions related to endowments of environmental and ecological resources, or simply in terms of space and population density, e.g. the Netherlands versus Canada.” (van den Bergh and Verbruggen, p. 67.). Our short case study of the Netherlands indicates the country’s place among other countries in the world and clearly demonstrates that its specific
position originates from its high population density and high per capita consumption. Our human settlement type attributions help in the making of more subtle judgments and identify the Netherlands as a global-scale Inner-city. Addressing a somewhat different and more balanced question – do we need global-scale Inner-cities or not? – appears preferable to stigmatizing the Netherlands as an unsustainable entity, per-se.
Advocates of the EF often argue that “footprint accounts quantitatively describe the demand of any individual or a population, but they do not themselves draw conclusions or make assumptions about who should be using what. These are social and political choices that the Ecological Footprint itself cannot make” (Kitzes and Wackernagel, 2009). While this seems theoretically true, in practice we often find in popular publications and communications per capita footprint data compared to ‘earth’s fair share’ of biocapacity based on the real size of our growing global population. This type of presentation inherently ‘praises’ populous countries which practice partition and ‘punishes’ less densely populated ones which prefer comfort. Publishing EF data in the form of a complex IS-plot would help balance this problem.
7.2. Understanding urban and rural
From Thünen’s rings (1966) through to Mumford’s book about the city and its history (1961) to recent literature about the ecological footprint we know that – based on the logic of our civilization – it is inherently natural that cities (urban areas) need far more renewable resources than their own biocapacity can provide. The key is to have sufficient ‘global hinterland’ (Rees–Wackernagel, 1996, p. 236.): essentially the availability of enough biocapacity creditors. We regard those creditors as being, per definition, rural.
However, this ‘global hinterland’ is shrinking these days. As Satterthwaite states, “in high- income nations… virtually all rural areas are ‘urban’ in that almost all of the population do
not work in primary activities and almost all enjoy levels of provision for infrastructure and services that were previously only associated with urban locations” (Satterthwaite, 2009, p.
564). In other words, in situ urbanization is on the way (Zhu, 2004, p. 21.) independently of the administrative status of any particular region and independently of migration towards cities. The IS-plot of the world clearly indicates this process, as the gap between the
‘sustainable limit’-diagonal and the parallel diagonal via the actual world average is widening (Fig. 4). This means that originally ecological creditor village- and garden-countries tend to be ecological debtors (see Kroll et al., 2012, Sleeter et al., 2013). This is true of countries from Afghanistan, Vietnam and Nigeria to Romania, Hungary and Kazakhstan. Of course, it is not only these countries that are the sources of the problem. The problem originates from the ongoing shifting of the world average towards ‘prosperity’.
Thus the problem, we think, does not lie within cities or within urban areas per se and the solution needs a holistic view of human settlement types and an overview of the whole system. McGranahan and Satterthwaite make the point by stating that “a concentration on
‘sustainable cities’ focuses too much on achieving ecological sustainability within
increasingly isolated ecoregions or bioregions… But the goals of sustainable development are the meeting of human needs within all cities (and rural areas) with a level of resource use and waste generation within each region, the nation, and the planet that is compatible with
ecological sustainability” (McGranahan and Satterthwaite, 2003, p. 259).
The question logically arises: why should New-Guinea, Canada or Siberia become more populated and ‘developed’ in order to ease the local ecological deficit of the Netherlands or South-Korea? Much research has dealt with migrations and the historical distribution of humanity which creates different population densities in different areas (Manning, 2013, Small and Cohen, 2004). Instead of manipulating patterns of naturally evolved human settlements, which may cause even higher environmental impact than preserving the status
quo (Marcotullio and Solecki, 2013), we should exploit the huge reserves implied in highly populated areas. “Near is beautiful” (Miller, 2004), or as Melosi puts it: “economists
sometimes refer to service provision in densely populated areas as exhibiting ‘economies of density’ as opposed to ‘economies of scale’” (Melosi, 2010, p. 10). The ecological
consequences of the density ‘resource’ should be becoming more obvious and consciously- addressed nowadays. In other words, as Sassen and Dotan (2011) formulate it, we should follow a strategy which delegates cities back to the biosphere.
7.3. The strategic role of introducing preferences and settlement type attributions
Nobody but a long-distance traveler has direct experience with completely different cultures and lifestyles. However, everybody knows what a village or city means when applied to his/her own region, what their advantages and drawbacks are and which they would prefer to live in and why. The approach used in the IS could be used as a powerful tool to identify types of differences from the system average and allow their categorization according to human preferences and settlement types.
Two things seem to be important here: (1) Finding the regional settlement type that is in harmony with one’s preferences may be a good strategy for leading a fulfilled life. Of course, strictly speaking this is only a hypothesis which originates from the above analysis that can be tested in detail later. However, this assumption seems to be fully logical and may serve as a basis for creating strategies in the future – even for sustainability. Combining positive preferences with below-average consumption (following the principles of ‘simplicity’ or
‘ecology’) and connecting below-average population density with ‘privacy’ may serve to provide both sustainability and happiness for those who intrinsically have these unfulfilled preferences. As was described in Section 6, these preferences are relative rather than absolute,
thus their realization can be interpreted in relation to regional averages which are perceptible to everybody. It is important that this approach, if implemented, would accept people with inherent preferences toward community, prosperity and complexity, all encouraging urbanization and regional ecological debt. However, by successfully ‘pushing’ the local average towards ‘ecology’ the global average would also move in that direction and contributes to reducing general unsustainability.
(2) Some preferences are hard to combine without creating serious unintentional effects. In Fig. 3 we summarized preferences where unfamiliar pairs are easy to identify. Of course, opposing preferences by definition neutralize each other leaving us near to the average in the dimension under analysis. Consider the case of an individual or group of individuals who favor privacy (individualism) in a highly urbanized region. This seems to be a relatively new, environmentally threatening process. Individualism may work in a thinly populated rural setting, but combining it with the type of prosperity seen in the High-rise or Inner-city-like settlement settings will have environmental consequences in the form of creating significant ecological debt. In cities, in exchange for trying to sustain a more complex and wealthy lifestyle one should bear more of the negative external effects stemming from the higher population density (noise, congestion, polluted air, public transport, dense neighborhoods, etc.). To reap the economies of densities which may legitimize the existence of some regions with ecological debt we must accept trade-offs between the (dis)advantages of rural and urban lifestyles. We must choose either prosperity or privacy – or remain near to the regional
average.
However, as found in the scarcity hypothesis of Inglehart (1971), for values which are scarce or suppressed a growing demand may arise in general. If this is true, such preferences as simplicity, ecology and privacy may become more and more appreciated in an
‘overdeveloped’ and globally unsustainable world. Based on this idea, there may be more
room for policies and educational programs which highlight these ‘green’ preferences and circumstances in today’s communities than ever (e.g. Zsóka et al., 2013) for strengthening environmental self-identity and intrinsic motivation (van der Werff et al., 2013).
One preference trade-off in particular should be flagged up; namely the trade-off between partition and comfort. As the IS-plot clearly shows, different combinations of these preferences do not affect aggregate resource use or scale (agents move parallel to the
sustainability line; Fig. 4.). A family which prefers partition to an above-average extent may have more children, or a community may accept or encourage immigration as long as it acknowledges the need for lower per capita consumption in turn (this preference also implies more community and more simplicity). Otherwise, preferring comfort above the average may work if one accepts the need to have fewer children and/or to discourage immigration (this preference also implies more complexity and privacy). References for this perspective are the historical family planning of aristocrats (Johansson, 1987) or policies for regions where one- child families are/were culturally encouraged in order to concentrate wealth in fewer hands (Kovács, 1937). Thus the optimal or sustainable amount of people on Earth cannot be
calculated without considering the general (aggregate) preference of humanity for partition or comfort (see also the term ‘cultural carrying capacity’, Alcott, 2012).8
7.4. Political considerations
What is the probability that family C will voluntarily submit half of its renewable resources (biocapacity) to family A? (Chapter 3, Case C) It is contrary to the paradigm of maximization of material wealth and benefits, though the concept of altruism may open the door to such
8 Naturally, the number of children that a parent has is partly influenced by ‘fate’ – events and influences over which one has little or no control. This can have serious political and ethical implications. In general, influencing preferences may also have ethical implications.
behaviors (van der Pol et al., 2012). But actions which may seem to be somewhat justifiable at a local or regional level (e.g. as urban–rural resource transfer) may not apply to the global level and can be highly controversial (Billen et al., 2012). What is the probability that, say, a country such as Colombia would voluntarily ‘give’ its unused biocapacity to the Netherlands so that it can continue to sustain its global-scale inner-city lifestyle? Here arises the real danger of ideologizing poverty and exploitation by attributing voluntariness to all ecological creditors. Is the term ‘hinterland’ not just a new name for imperialism when undertaking global scale analysis?
Analyzing resource distribution using IS-plots may be fruitful in such disciplines as political ecology (Martínez-Alier, 2002, Walker, 2006), the new field of study of the environmental component of world systems theory/analysis (Jorgenson et al., 2009) and others (for a survey see Fisher et al., 2013). In a dynamic context, concepts like exploitation, colonization,
migration or the shaping of general inequality can be demonstrated in a new way by using the Intenscope. Relationships that have economic components and consequences in the context of sustainability, which could not be discussed in this paper, include economic growth, degrowth (van den Bergh, 2011) and income (Kuzyk, 2011, Duro and Teixidó-Figueras, 2013,
Weinzettel et al., 2013) can also be refined using IS-analysis.
While the importance of these political approaches cannot be overemphasized one must keep an eye on one’s own preconceptions too. The following question arises when one
simultaneously seeks for sustainability and criticizes capitalist-materialistic ideologies: are we allowing enough space for alternative explanations of the world or are we in danger of seeing all those people who consume less than the world average as ‘poor and oppressed’, all regions with ecological credit as ‘underdeveloped’, or all countries with an ecological surplus as
‘colonized’? Is it still viable that we can define ‘development’ as more and more people with ever higher (material) living standards? Are global or regional High-rises and Inner-cities
‘more developed’ than Waldens and Hamlets? Answering these questions always requires a balanced approach and a genuine openness toward understanding present or potential
voluntariness. Without this, one – unintentionally – may accept the often-criticized materialist worldview which could predetermine one to advocate violent, obligatory, top-down
‘solutions’ to sustainability, allowing no scope for voluntary activity based on people’s different patterns of preferences.
Of course, beyond the dimensionless numbers of the IS-system we encounter absolute limits and categories too. The biocapacity of a region or of the world is one such limit and is
indicated by the ‘sustainable limit’-diagonal on the IS country-plot (Fig. 4). Another absolute limit is the minimum material/ecological requirements to sustain human life. Defining these limits seems to be a more important task than defining minimum salaries in monetary terms, as the latter is still a relative term and is dependent on the level of monetization of human interactions in a county/community (Kocsis, 2012). The political consequences of introducing such a per capita minimum supply of resources would be wide-spread and far-reaching but seem to be inescapable in a finite world with an overall tendency to increase individual living standards well above the minimum required (which in turn serve as ever rising reference points for consumers and decision makers).
The political ramifications of employing an analytical process such as the IS may also affect international environmental negotiations and cooperation. Countries typically blame each other for unsustainability. Wealthy countries point to poorer ones and say that they should curb and reduce their populations while the poor respond by pointing to the per capita consumption of wealthy countries. To escape this vicious circle of blame we need a more complex approach to population, consumption, scale and sustainability. Using the Intenscope to analyze the positions of countries – integrated by preferences and settlement type
attributions – could be a good way to change the blame paradigm into a more cooperative and fruitful approach.
Acknowledgments
I would like to thank Professor Sandor Kerekes for the inspiration, Simon Milton for checking the English in this paper and two anonymous referees for helpful comments. The research described in this paper was supported by the Hungarian OTKA grant (105228).
Appendix A. Summary of the case study ‘farmers, pastures and cows’
Fig. A.1 summarizes the case study of Chapter 3. This table contains all settlement type attributions introduced in Chapter 4, gives real world examples and indicates the world average reference point according to Chapter 5 and Fig. 4 and translates the fictitious case study measurements into ecological footprint ones.
Fig. A.1 Summary of the case study ‘farmers, pastures and cows’ (data for the real world case: see footnote 5) (Note: At time t0 all nine families were identical to family ‘B’. We suppose that 1 cow needs 4 acres of pasture on the hypothetical island, which is just sustainable. In the real world 1 gHa of consumption requires 1 gHa* of biocapacity to be sustainable).
References
Alcott, B. (2012) Population matters in ecological economics. Ecological Economics 80, 109–
120.
Bagliani, M., Galli, A., Niccolucci, V., Marchettini, N. (2008) Ecological footprint analysis applied to a sub-national area: The case of the Province of Siena (Italy). Journal of
Environmental Management 86, 354–364.
Billen, G., Garnier, J., Barles, S. (2012) History of the urban environmental imprint:
introduction to a multidisciplinary approach to the long-term relationships between Western cities and their hinterland. Reg Environ Change (12), 249–253.
Daly, H. E. (1992) Allocation, distribution, and scale: towards an economics that is efficient, just, and sustainable. Ecological Economics 6, 185–193.
Dávidházy, P. (ed.) (1997) The Lost Rider: A Bilingual Anthology. Corvina Publishers, Budapest, Hungary.
Devine-Wright, P. (2013) Think global, act local? The relevance of place attachments and place identities in a climate changed world. Global Environmental Change 23, 61–69.
Duro, J. A., Teixidó-Figueras, J. (2013) Ecological footprint inequality across countries: The role of environment intensity, income and interaction effects. Ecological Economics 93, 34–
41.
Ehrlich, P. R, Ehrlich, A. H. (1991) The Population Explosion. Simon and Schuster, New York, Touchstone.
Elgin, D. (1993) Voluntary Simplicity: Toward a Way of Life That Is Outwardly Simple, Inwardly Rich. Revised Edition, Morrow, New York (first published in 1981).
Ellis, E., C., Kaplan, J., O., Fuller, D., Q., Vavrus, S., Goldewijk, K., K., Verburg, P., H.
(2013) Used planet: A global history, PNAS 110 (20), 7978–7985.
Fisher, J., A. et al. (2013) Strengthening conceptual foundations: Analysing frameworks for ecosystem services and poverty alleviation research. Global Environmental Change 23 (5), 1098–1111.
Franz, J., Papyrakis, E. (2011): Online Calculators of Ecological Footprint: Do They Promote or Dissuade Sustainable Behaviour? Sustainable Development 19, 391–401.
Georgescu-Roegen, N. (1971) The Entropy Law and the Economic Process. University of Alabama Distinguished Lecture Series, No. 1.
GFN (2010) Ecological Footprint Atlas, 2010. Global Footprint Network, Oakland, CA, http://www.footprintnetwork.org/en/index.php/GFN/page/ecological_footprint_atlas_2010 (accessed on 06/01/2014).
Graymore, M., L., M., Sipe, N., G., Rickson, R., E. (2008) Regional sustainability: How useful are current tools of sustainability assessment at the regional scale? Ecological Economics 67, 362–372.
Hardin, G. (1968) The tragedy of the commons. Science 162, 1243–1248.
Hawley, A. H. (1986) Human ecology. University of Chicago Press, Chicago.
Hopton, M., E., White, D. (2012) A simplified ecological footprint at a regional scale. Journal of Environmental Management 111, 279–286.
Imhoff, M. L., Bounoua, L., Ricketts, T., Loucks, C., Harriss, R., Lawrence, W., T. (2004) Global patterns in human consumption of net primary production. Nature 429, 870–873.
Inglehart, R. (1971) The Silent Revolution in Europe: Intergenerational Change in Post- Industrial Societies’. American Political Science Review 65 (4), 991–1017.
Johansson, S. R. (1987) Status Anxiety and Demographic Contraction of Privileged Populations. Population and Development Review 13 (3), 439–470.
Jorgenson, A., K., Austin, K., Dick, C. (2009): Ecologically Unequal Exchange and the Resource Consumption/Environmental Degradation Paradox. International Journal of Comparative Sociology 50 (3–4), 263–284.
Kerekes, S. (2011) Happiness, environmental protection and market economy. Society and Economy 33, 5–13.
Kitzes, J., Wackernagel, M. (2009) Answers to common questions in Ecological Footprint accounting. Ecological Indicators 9, 812–817.
Kocsis, T. (2002) Roots: Pleasure and Wealth in a Globalizing Consumer Society. PhD- Dissertation, Corvinus University of Budapest, http://phd.lib.uni-corvinus.hu/737 (accessed on 16/01/2014).
Kocsis, T. (2012) Looking through the dataquadrate: characterizing the human–environment relationship through economic, hedonic, ecological and demographic issues. Journal of Cleaner Production 35, 1–15.
Kopmann, A., Rehdanz, K. (2013) A human well-being approach for assessing the value of natural land areas, Ecological Economics 93, 20–33.
Kovács, I. (1937) A néma forradalom (The silent revolution); Misztótfalusi, Budapest.
Kroll, F., Müller, F., Haase, D., Fohrer, N. (2012) Rural–urban analysis of ecosystem services supply and demand dynamics. Land Use Policy 29, 521–535.
Kuzyk, L. W. (2011) Ecological and carbon footprint by consumption and income in GIS:
down to a census village scale. Local Environment 16 (9), 871–886.
Latouche, S. (2010) Degrowth. Journal of Cleaner Production 18, 519–522.
Loiseau, E., Junqua, G., Roux, P., Bellon-Maurel, V. (2012) Environmental assessment of a territory: An overview of existing tools and methods. Journal of Environmental Management 112, 213–225.
MacKerron, G., Mourato, S. (2013) Happiness is greater in natural environments. Global Environmental Change 23 (5), 992–1000.
Manning, P. (2013) Migration in world history. second edition, Routledge, New York.
Marcotullio, P., J., Solecki, W. (2013) What is a city? An Essential Definition for
Sustainability. In. Boone, C. G, Fragkias, M. (eds) Urbanization and Sustainability: Linking Urban Ecology, Environmental Justice and Global Environmental Change. Springer
Netherlands, 11–25.
Martínez-Alier, J. (2002) The Environmentalism of the Poor. Edward Elgar, Cheltenham.
McGranahan, G., Satterthwaite, D. (2003) Urban Centers: An Assessment of Sustainability.
Annu. Rev. Environ. Resour. 28, 243–274.
McManus, P., Haughton, G. (2006) Planning with Ecological Footprints: a sympathetic critique of theory and practice. Environment and Urbanization 18 (1), 113–127.
Melosi, M. V. (2010) Humans, Cities, and Nature: How Do Cities Fit in the Material World?
Journal of Urban History 36 (1), 3–21.
Miller, H. J. (2004) Forum: on Tobler’s first law of geography. Ann Assoc Am Geogr 94 (2), 284–289.
Moore, D. (2011) Ecological Footprint Analysis: San Francisco – Oakland – Fremont, CA metropolitan statistical area. June 30. Global Footprint Network,
http://www.footprintnetwork.org/images/article_uploads/Ecological_Footprint_Analysis_San _Francisco.pdf (accessed on 28/05/2013).
Moran, D., D., Lenzen, M., Kanemoto, K., Geschke, A. (2013) Does ecologically unequal exchange occur? Ecological Economics 89, 177–186.
Mózner, Zs., Tabi, A., Csutora, M. (2012) Modifying the yield factor based on more efficient use of fertilizer—The environmental impacts of intensive and extensive agricultural practices.
Ecological Indicators 16, 58–66.
Mumford, L. (1961) The City in History: Its Origins, Its Transformations, and Its Prospects.
New York, Harcourt, Brace & World.
Niccolucci, V., Galli, A., Reed, A., Neri, E., Wackernagel, M., Bastianoni, S. (2011) Towards a 3D National Ecological Footprint Geography. Ecological Modelling 222, 2939–2944.
Portney, K. (2003) Taking Sustainable Cities Seriously: Economic Development, the Environment, and the Quality of Life in American Cities. The MIT Press, Cambridge, Massachusetts.
Rees, W., Wackernagel, M. (1996) Urban ecological footprints: why cities cannot be sustainable – and why they are a key to sustainability. Environ Impact Assess Rev 16, 223–
248.
Sassen, S., Dotan, N. (2011) Delegating, not returning, to the biosphere: How to use the multi-scalar and ecological properties of cities. Global Environmental Change 21, 823–834.
Satterthwaite, D. (2009) The implications of population growth and urbanization for climate change. Environment and Urbanization 21, 545–567.
Sleeter, B., M., Sohl, T. L., Loveland, T. R., Auch, R. F., Acevedo, W., Dwummond, M. A., Sayler, K. L., Stehman, S. V. (2013) Land-cover change in the coterminous United States from 1973 to 2000. Global Environmental Change 23 (4), 733–748.