DOCTORAL (PhD) THESIS
UNIVERSITY OF WEST HUNGARY
FACULTY OF AGRICULTURAL AND FOOD SCIENCES Institute of Biosystems Engineering
Leader of the Doctoral School:
PROF. DR. MIKLÓS NEMÉNYI DSc
Supervisors:
PROF. DR. MIKLÓS NEMÉNYI DSc DR. ATTILA JÓZSEF KOVÁCS PhD
DEVELOPMENT OF MEASUREMENT TECHNIQUES FOR PRECISION PLANT
PRODUCTION
Written by:
MÁTYÁS CSIBA
MOSONMAGYARÓVÁR 2010
TABLE OF CONTENT
1. RESEARCH AIMS ...3
2. MATERIALS AND METHODS ...4
2.1 Measurement of the soil strength ...4
2.1.1 Continuous tillage force measurement ...4
2.1.2 Measurement of the tillage depth ...5
2.1.3 Determination of penetration energy...5
2.2 Measurement of soil water content ...6
2.3 Mapping the spatial weed diversity with an on-line technique ...6
2.4 Precision pest control using helicopter assignment ...7
2.5 Measurement of grain quality parameters during harvest ...7
3. RESULTS ...9
3.1 Measurement of the soil strength ...9
3.1.1 Continuous tillage force measurement ...9
3.1.2 Measurement of the tillage depth ... 11
3.1.3 Comparison between horizontal and vertical soil strength ... 11
3.2 Measurement of soil water content ... 12
3.3 Mapping the spatial weed diversity with an on-line technique ... 13
4.4 Precision pest control using helicopter assignment ... 14
3.5 Measurement of grain quality parameters during harvest ... 15
4. NEW SCIENTIFIC RESULTS (THESES) ... 19
5. RESULTS FOR THE PRACTICAL USE ... 20
6. LIST OF PUBLICATIONS ... 20
1. RESEARCH AIMS
During my research work I was focusing on correction of measurement techniques in precision agriculture and developing new methods, which mean a forward step and correction for the field work. Inside this my aim was:
· Develop a technique for continuous soil strength measurement, what could be an easy, universal and a useful tool for farmers during site specific tillage.
· Find a solution for an autonomous quasi continuous soil water measurement system using TDR (Time Domain Reflectometry) method.
· Develop a measurement technique for continuous on-line weed detection.
· Investigate the precision techniques, which can be used in pest control based on helicopter assignment in Hungary.
· To determine the precision of grain moisture sensors during harvest and map the spatial diversity of protein and oil content of the crop, using AccuHarvest On-Combine Grain Analyzer (Zeltex Inc.,).
2. MATERIALS AND METHODS
2.1 Measurement of the soil strength
2.1.1 Continuous tillage force measurement
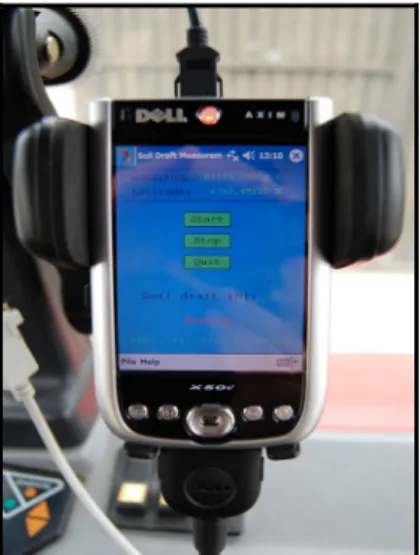
The system is based on the electro-hydraulic system (EHS) of a Steyer 9078/A tractor. Load cells are installed in the EHS, which provide electric signals with the ratio of the forces affecting the hydraulic system. The induced voltage from the load cells were fed to the DellAxim x50v PDA (Personal Digital Assistant) using an RS232-ADC module, which converts the analog voltage signals to a digital one. The developed software - with a simple programming environment Zeus - records and displays the actual force, affecting the hydraulic lever and writes the values to the main memory of the PDA together with the position (GPS) information in *.txt format. This file format is available for GIS software for later processes (Fig. 1.).
Figure 1. The developed software running on a PDA
2.1.2 Measurement of the tillage depth
Measuring the tillage force, two influencing parameters came up. The first was the working speed, the second the working depth. The speed data were obtained from the GPRMC line of NMEA sentence during post process of the recorded data. To log the actual working depth continuously, we have used an ultrasonic sensor mounted on a tillage tool in the line of the right wheels. We investigated the preciseness of the sensor under field conditions on barely, corn and weedy stubble.
2.1.3 Determination of penetration energy
To measure the cone index we have used 3T System penetrometer up to depth 40 cm. The investigations were carried out on an experimental field with an area of 1 ha. We have divided it into 15 management units. In each unit we have executed 14 measurements to determine the cone index, and using equation 1. the penetration energy.
ò
×d i
e= C d
P
0
d [kJ/m2] [1]
where:
Ci – cone index [kPa];
d – depth [m].
The cone index and penetration energy values were compared to the soil strength data, calculated from the tillage force, what were measured with a method listed in chapter 2.1.1.
2.2 Measurement of soil water content
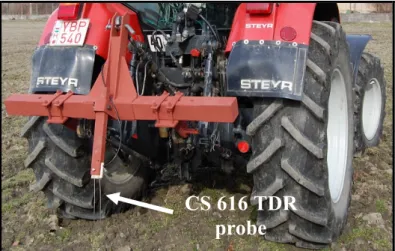
In the hope that a time demanding and few sample density soil water content measurements could be replaced with an automotive method we did the following steps. A special frame was connected to the three-point hitch of the tractor (Fig. 2.), which contains a CS 616 TDR probe rode. The frame is actuated by the hydraulic system, so the probe rod is pushed and pulled out from the soil by the position of the three-point hitch. The data logger (CR 10x) is situated in the cab of the tractor. From channel 1(C1) of the data logger the outgoing wire is connected throughout a serial (RS-232) port to the PDA. Software written in Zeus language records the actual soil moisture content together with the coordinates if the record button is pushed.
Figure 2. The special three-point hitch with a TDR probe 2.3 Mapping the spatial weed diversity with an on-line technique
The investigations were carried out on a 1 ha research field of the Institute of Biosystems Engineering. For a first step on the field, 100%
CS 616 TDR probe
covered with weed with a disk harrow we made even weed spots with a shape of a quadrant.
A tractor mounted sprayer with Weed Seeker senses the green filed coverage on-line, and relays an impulse to the built in LED diode, when the sprayer-head works. To use this opportunity the light of the blinking LED is sensed with a photocell what is built together with a separate circuit. To record the data the software used in chapter 2.1.1 was modified. If the LED diode is on the logging software records value “1”, if not it records value “0”
continuously together with the exact coordinates. These two values represent weed and non weed spots.
2.4 Precision pest control using helicopter assignment
During our investigations we were seeking the answer, which solutions in precision agriculture could be used in plant protection based on helicopter assignment. The main goal was to find a solution that makes the pilots work more accurate and easier from administration site. Our measurements were carried out with a Kamov KA-26 helicopter.
2.5 Measurement of grain quality parameters during harvest
Experiments were carried out in the No 80/1. field belongs to the experimental farm of the University of West Hungary, Faculty of Agricultural and Food Sciences. The harvested crops were corn in 2008 and winter wheat in 2009.
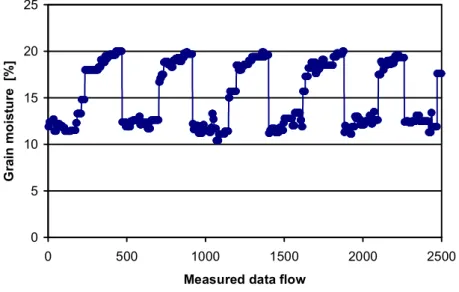
The operation of the sensor mounted in the exit of the tank feeding auger is based on the principle of conductivity. One of the major errors of this sensor comes from the inconstant measured volume. By filling and
emptying of the grain tank the area is changing continuously, which causes a great fluctuation during on-to-go moisture sensing (Fig. 3.). Harvest data (grain moisture) from year 2004, 2005 and 2006 were post processed to prove this hypothesis. The same results came up in the year of the investigations in 2008 and 2009.
0 5 10 15 20 25
0 500 1000 1500 2000 2500
Measured data flow
Grain moisture [%]
Figure 3. The fluctuation of the grain moisture content during harvest (Winter wheat, 2004)
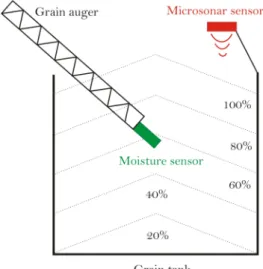
Therefore an ultrasonic sensor (Nivelco Hungary Inc.) was mounted on a top of the grain tank, what measures the crop distance from the bottom of the tank in centimeters (Fig. 4.). Using a DellAxim X50v PDA with modified software used in chapter 2.1.1 and connected to a GPS, the grain distance from the top has been recorded spatially during the harvest.
Figure 4. Sensing of the grain tank saturation
With Eq. (2) from distance values (d) the saturation of the grain tank (x) can be counted in percentage.
38 . 1 100- -41
= d
x [%] [2]
From the tank feeding auger we have collected 20 samples in 2008 and 150 samples in 2009. For a control we have used ASAE (1998) standard to determine the moisture content of the samples with oven drying method.
3. RESULTS 3.1 Measurement of the soil strength
3.1.1 Continuous tillage force measurement
Based on the presented results, we can declare that the load cells provided electric signals with the ratio of the forces affecting the hydraulic system,
after a conversion to on-line force using above mentioned system are offering enough precise data for heterogeneity mapping. This new innovation makes the earlier development more accurate (with the similar efficiency) and provides the system to use in practical field-works. In addition to all the accessories are simple and available at relatively low cost rate. Using today’s technical developments makes the whole process user friendly. With an eye to the future, the on-line force measurements could provide base information for example continuous on-field bulk density or soil water content estimation.
Using the PDA with the written software we can easily display the actual draft force with the coordinates and we are also able to record them. These raw data after a post process are capable to provide valuable site-specific information for precision agricultural management.
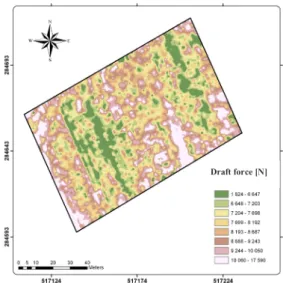
On Fig. 5. the draft force map of the research field is shown, measured with a standard tine in the depth of 40 cm. Due to the large amount of recorded point the differences are sharply traced.
Figure 5. The tillage force map of the experimental field
Draft force [N]
The measuring system could be used in all hanged and semi-hanged tillage tools as a plough, a disc harrow or a coulter as well. It doesn’t needs a special sensor, because it is based on a load cell of the tractor. It has other advantages moreover as all the parts are simple and universal, so all the tractors equipped with EHS are compatible with it.
3.1.2 Measurement of the tillage depth
The draft force is highly affected by working speed and by the tillage depth; therefore we considered to measure these parameters. During the measurements to eliminate the effect of the working speed, our investigations were carried out with low (3 km/h) speed. On the other hand the speed data could be recorded from the raw data. For continuous logging of the working depth we have used an ultrasonic sensor (listed in chapter 3.1.2), mounted to the tillage too in the line of the right side wheels. The sensors accuracy satisfied our expectation and it worked well on a moderate weedy and on stubble field, too.
3.1.3 Comparison between horizontal and vertical soil strength
However in practice penetrometers are widely used several researches started to focus on on-line measuring methods, which can substitute the penetrometers, but give the same information for the farmers. The scientists have different point of views. Our comparing investigations proved that there is no significant connection between cone index and tillage force data. Also we have tried to compare the penetration energy to tillage force, but the results were the same. Our opinion is that the two different forces are not comparable; however several relationships exist between them. The differences could be found in the characteristics of the forces.
3.2 Measurement of soil water content
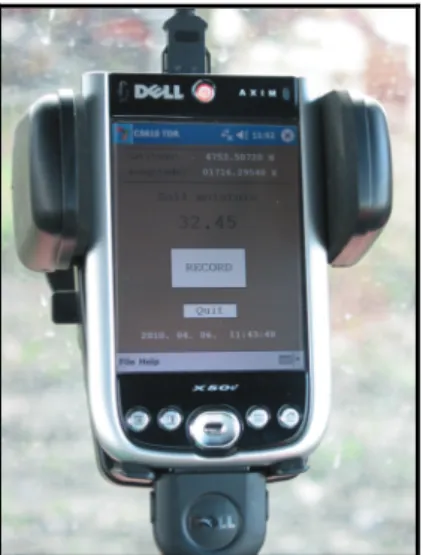
The structure of the today TDR probes does no allows continuous measurements, therefore we were focusing on quasi continuous method, seeking the solution what fastens and automates the whole measuring process. In favor of this a special frame was connected to the three-point hitch of the tractor. The probe head is pushed and extracted from the soil by the hydraulic system of the tractor. The data logger is placed in the cab, where it is connected to the PDA. On the handheld (Fig. 6.) special software is running which controls the measurement, displays and records the soil moisture data. Pushing the “RECORD” button the actual soil moisture values are saved to *.txt file into the main memory.
We have attained a TDR based quasi continuous soil moisture measurement, however under field conditions to continue the research a more robust probe head is needed.
Figure 6. The software running on the PDA recording the soil moisture content
3.3 Mapping the spatial weed diversity with an on-line technique
During the application of site-specific weed regulation it is important to know the occurrence, amount and the spatial spreading of different weed species. We have executed our investigations on a strong weedy experimental field, where the dominant weed was Cirsium arvense. We have prepared the weed coverage map of our experimental field with an on-line technique. To continue the improvement of this process a new opportunities will open in a sensor based, continuous weed coverage monitoring.
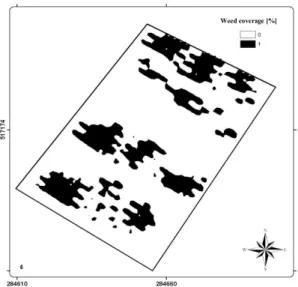
The laborious and time consuming weed coverage recording work could be replaced in some cases with a method mentioned in chapter 2.3. The system is capable to record the spatial weed coverage with a continuous method. From the recorded data the weed coverage percentage could be calculated with an exact method. On Fig. 7. the weed (Cirsium arvense) spatial distribution could be viewed on the experimental field. The weedy and non weedy spots could be easily separate.
Figure 7. The weed (Cirsium arvense) coverage on the experimental field
Weed coverage [%]
Using these data we can get a visual picture and also they provide an important information base for the following protection. In this experiment the coverage ofCirsium arvense was 22.45% on the area of 0.38 ha.
The improvement in this state of expansion is not capable to monitor weeds by species, but many practical situations occur when the dominant weeds are from one group of species. It could be an example when after the use of a pre-emergent herbicides the formation of geophytes weeds. The results are useable also in perennial protection technology. Several scientists also proved that the spatial distributions of some weed species after herbicide maintenance for long years stay the same. This is also true for Cirsium arvense.
Comparing the manual (laborious and time consuming) and online weed coverage monitoring we come up on a result that in many cases when we do not need detailed information by species so the group of species is enough this solution could be applied.
4.4 Precision pest control using helicopter assignment
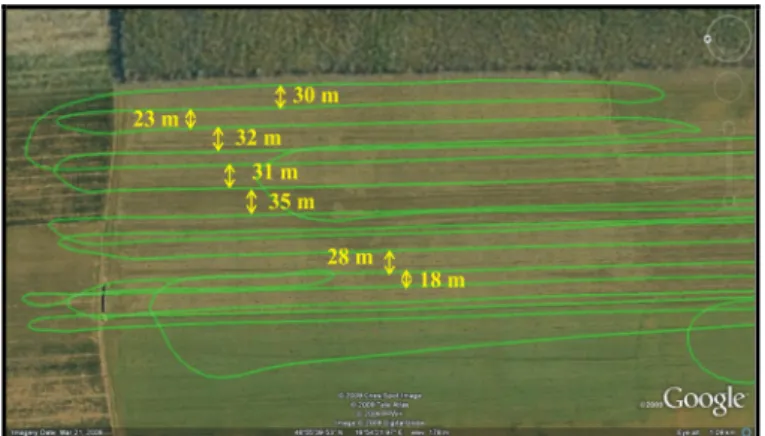
On Fig. 8. the trace log of the helicopter route could be viewed. With a frame of 30 m working with smaller and bigger differences from optimal line connections could be observed. This relatively high amplitude could be minimized using auto-track system. As a matter of course the precision RTK is not necessary, but a well trained pilot with a navigation system can increase the accuracy in connection lines significantly.
Figure 8. The GPS track log without guidance system
It is important to mention that these guidance systems were developed for tractors, the relatively high speed (100-130 km/h) of the helicopter does not affects its accuracy. With the logging of the fly route we can easily execute the administration work. The system has further advantages. When the visibility is not sufficient (low sun standing, missing of objects for orientation) we can fly with an optimum width sparing chemicals. In some cases for example to prove the damage caused by the chemicals or as verification to the customer side about the flied area could be used.
We have also found out that the separate control of different spraying sections is not needed, because of the air flow made by the helicopter rotors.
3.5 Measurement of grain quality parameters during harvest
Using the ultrasonic controller we have recorded the grain distance from the bottom of the tank continuously. We have found a clear correlation between grain tank saturation and between the biases from the standard moisture, therefore if we do not ensure a permanent volume for capacitance sensor, there will be under and over measures depending on grain tank
saturation. As a solution we can use an additional sensor (e.g. microsonar), and during the post process of the data we can correct our moisture values
Using the 20 grain samples collected during the harvest of corn in 2008 the correction formula is the following:
( )
100
24.092 1.1694
0.0085
100+ x2 x+
w) Agrocom(ra
= rrected) Agrocom(co
- [3]
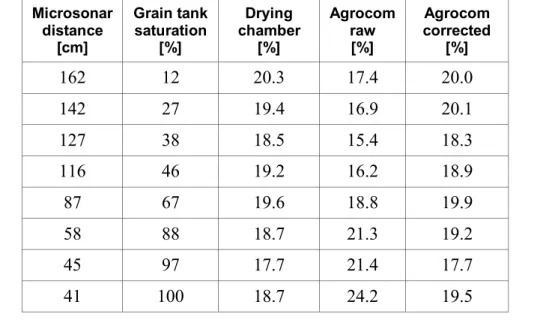
Table 1. contains the results from the comparison of the moisture contents respectively ultrasonic sensor measured data from year 2008 for a randomly chosen grain tank saturation.
The capacitance grain moisture sensor of Agrocom ACT in some cases caused 4-5% of error in moisture percentage, what is not an acceptable value.
Using the ultrasonic sensor this error could be decreased below 1%.
Table 1. A randomly chosen grain tank saturation section (Corn, 2008)
Microsonar distance
[cm]
Grain tank saturation
[%]
Drying chamber
[%]
Agrocom raw [%]
Agrocom corrected
[%]
162 12 20.3 17.4 20.0
142 27 19.4 16.9 20.1
127 38 18.5 15.4 18.3
116 46 19.2 16.2 18.9
87 67 19.6 18.8 19.9
58 88 18.7 21.3 19.2
45 97 17.7 21.4 17.7
41 100 18.7 24.2 19.5
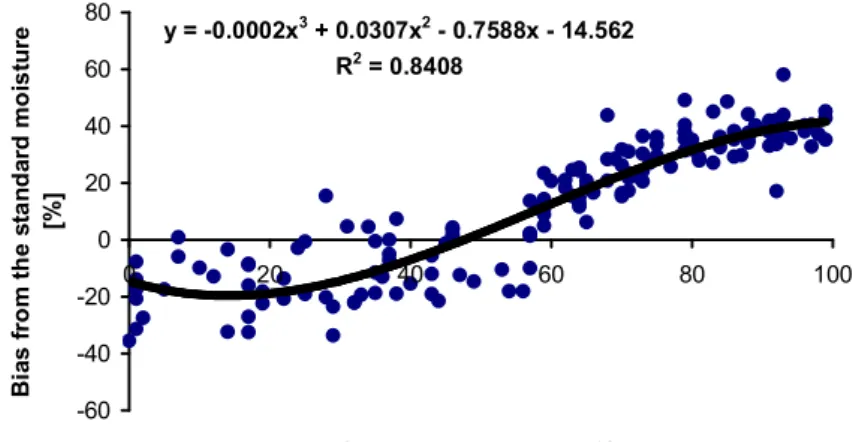
During the harvest of winter wheat in 2009 150 grain samples were collected. We have determined the correction formula (Equation 4.), what derives from the function of Fig. 9. Notwithstanding of the tight measuring interval we come up on the same results than in earlier year.
y = -0.0002x3 + 0.0307x2 - 0.7588x - 14.562 R2 = 0.8408
-60 -40 -20 0 20 40 60 80
0 20 40 60 80 100
Grain tank saturation [%]
Bias from the standard moisture [%]
Figure 9. The bias from the standard moisture in a function of grain tank saturation (Winter wheat, 2009)
( )
100
41.687 1.1399
0.0216 -
0.0002
100+ x3 x2 x+
w) Agrocom(ra
= rrected) Agrocom(co
- [4]
Table 2. contains the results of the drying chamber determined and sensor measured grain moistures respectively ultrasonic sensor data from year 2009 for a randomly chosen grain tank saturation.
Table 2. A randomly chosen grain tank saturation section (W. wheat, 2009)
Microsonar distance
[cm]
Grain tank saturation
[%]
Drying chamber
[%]
Agrocom raw [%]
Agrocom corrected
[%]
177 1 11.6 10.0 11.3
156 17 11.8 8.6 10.4
135 32 11.4 8.9 10.1
126 38 11.4 9.2 9.9
116 46 11.4 11.5 11.6
100 47 11.5 11.7 10.5
88 66 12.5 14.6 12.2
82 70 12.6 15.9 12.8
73 77 12.7 15.9 12.3
60 86 12.2 16.9 12.4
49 94 12.5 17.0 12.2
44 98 12.5 17.1 12.2
The precision of a capacitance moisture sensor highly depends on actual compactness of the grain (grain/air ratio) in the grain tank. If we can not ensure a place for the sensor in a harvester, where the flow rate is constant, therefore the measuring volume is not permanent an additional sensor (e.g.
microsonar) should be used to detect continuously a grain tank status, during the harvest. As a second solution a NIT technology could be used. During my investigation I have stated that the accuracy was the same as measured with the corrected capacitance sensor. In addition with Zeltex On-Combine Grain Analyzer oil and protein content could be recorded (starch content calibrations are under development, what will a great advantage for future investigations.
The spreading of measuring techniques based on near infrared reflectance is greatly affected by its high price and some calibrations are needed for local circumstances to reach the wanted precision. In any case future investigations are needed before use in practical farming.
4. NEW SCIENTIFIC RESULTS (THESES)
1. I have remodeled the earlier development for continuous tillage force measurement and expanded it with an ultrasonic working depth sensor.
2. During my investigations I have confirmed the statement that cone index data are not comparable with soil strength data, measured on- line, therefore do not give useful information for practical farm use.
3. I have worked out a measuring method for quasi continuous soil moisture measurement based on TDR method to fasten the work of hand sampling.
4. I was developed an on-line weed diversity monitoring method for spatial locating of weed occurrence. Using the technology the weed coverage on the field could be determined in a percentage.
5. I have proved that the capacitance grain moisture sensors (if the measured volume changes continuously) are holding a great error.
5. RESULTS FOR THE PRACTICAL USE
1. I was examined the opportunities for use of precision techniques in helicopter assignment considering autonomous guidance. We have proved that it could be a useful tool also during helicopter application.
2. I have prepared calibration functions for corn and winter wheat for post correction of grain moisture data measured by a capacitance sensor using saturation data, what can be determined form continuous sensing of grain tank saturation.
6. LIST OF PUBLICATIONS Hungarian articles
Mesterházi P. - Milics G. - Neményi M.- Csiba M. (2006): Folyamatos talajnedvességmérő műszer fejlesztése. MTA AMB XXX. Kutatási és Fejlesztési Tanácskozás. Gödöllő. Nr. 30. 1. kötet. pp. 16-20.
Milics G. - Neményi M. - Stépán Zs. - Ásványi L. Csiba M. (2006): A szemtermés tulajdonságainak mérése betakarítás során. XXXI. Óvári Tudományos Nap 2006. október 5. Mosonmagyaróvár. Előadások és poszterek összefoglaló anyaga. p. 117. Teljes anyag CD-én.
Kacz K. - Csiba M. - Kocsis S. (2007): Az erőgépek teljesítményének és a talajművelő eszközök munkaminőségének összehangolása a talajellenállás figyelembe vételével. Agro Napló, Országos Mezőgazdasági Szakfolyóirat, XI. évfolyam 2007/9. szám, gépesítés pp. 38-40.
Csiba M. - Stépán Zs. - Milics G. - Neményi M. (2008): Folyamatos talajellenállás mérés – új fejlesztések. MTA AMB XXXII. Kutatási és Fejlesztési Tanácskozás. Gödöllő. pp.139-142. Teljes anyag CD-én.
Csiba M. - Milics G. - Ásványi L. - Boros Sz. - Neményi M. (2008): TDR elven működő talajnedvesség mérő műszer vizsgálata különböző talajrétegeknél. XXXII. Óvári Tudományos Nap. Mosonmagyaróvár, 2008.
október 9. ISBN 978-963-9883-05-5. Teljes anyag CD-én.
Csiba M. - Milics G. - Barthalos P. - Neményi M. (2008): A Cone-féle penetrométer által mért talajellenállás és a művelő eszközre ható erő kapcsolata. XXXII. Óvári Tudományos Nap. Mosonmagyaróvár, 2008.
október 9. ISBN 978-963-9883-05-5. Teljes anyag CD-én.
Csiba M. - Stépán Zs. - Milics G. - Neményi M. (2008): A talajellenállás folyamatos mérése – új fejlesztések. Mezőgazdasági Technika XLIX.
évfolyam, 2008. június. pp. 2-3.
Csiba M. - Reisinger P. - Neményi M. - Kőmíves T. (2009): Szenzoros vizsgálatok a gyomnövények valós idejű detektálására. Magyar Gyomkutatás és Technológia. X. évfolyam.2. pp. 63-70.
Csiba M. - Szép R. - Neményi M. - Mesterházi P.Á. (2009): A precíziós növénytermesztési technológia alkalmazási lehetősége helikopteres növényvédelemben. Mezőgazdasági Technika, L. évfolyam, 2009. december.
pp. 16-17.
Csiba M. - Milics G. - Smuk N. - Neményi M. (2009): A fenntartható fejlődés kihívása és az erre adható válasz a magyar mezőgazdaságban.
Mezőgazdaság és vidék jövőképe. Mosonmagyaróvár. 2009. április 17-18.
(2) pp. 264-272.
Csiba M. - Reisinger P. - Stépán Zs. - Kőmíves T. - Neményi M. (2010):
Szántóföldi gyomnövények detektálása on-line módszer sefítségével.
Növényvédelmi Tudományos Napok 2010. p. 41. ISBN 963 8131 071.
English articles
Csiba M. - Stépán Zs.(2008): Continuous on-field draw force measurements to evaluate site-specific soil strength. Cereal Research Communications.
Akadémiai kiadó.36. (3) pp. 1867-1870 IF=1.037
M. Csiba - Zs. Stépán - G. Milics - M. Neményi (2008): Continuous soil draft measurement – new developments. 5th International Soil Conference
ISTRO Czech Branch - Brno 2008. Soil and Tillage: New Perspectives. p.
45. Teljes anyag CD-én.
M. Csiba - M. Neményi (2008): Continuous tillage force measurements – New Developments. Hungarian Agricultural Engineering. 21. pp. 19-20. HU ISSN 0864-7410
Csiba M. (2009): Comparison between capacitance and NIT sensing technology to continuously evaluate grain moisture during harvest. Cereal Research Communications. Akadémiai kiadó.37. pp. 73-76. IF=1.190
Hungarian proceedings
Csiba M. - Stépán Zs. - Milics G. - Neményi M. (2008): Continuous Soil Draft Measurement – New Developments. MTA AMB XXXII. Kutatási és Fejlesztési Tanácskozás előadásainak és konzultációs témáinak összefoglalója.32. p. 20.
Csiba M. - Neményi M. (2008): A termőhely-specifikus talajművelés műszaki feltételrendszere, különös tekintettel a művelési mélység, ill. a vontatási ellenállás mérésére. Fiatal kutatók az élhető Földért. Szaktudás Kiadó Ház, Budapest, ISBN: 978-963-9935-02-0, p. 73.
English proceedings
Mesterházi P. Á.- Milics G - Neményi M. - Csiba M. (2006): Development of continuous soil moisture sensor. MTA AMB XXX. Kutatási és Fejlesztési Tanácskozás előadásainak és konzultációs témáinak összefoglalója.30. p. 6.
Milics G. - Neményi M. - Csiba M. -Ásványi L. - Stépán Zs. (2007): Grain harvesting- Based on precision techniques with special regard to produce bioethanol. MTA AMB XXXI. Kutatási és Fejlesztési Tanácskozás. Gödöllő.
Az előadások és konzultációs témák tartalmi összefoglalói. pp. 14-15.
M. Csiba -Zs. Stépán - G. Milics - M. Neményi (2008):Continuous on-field tillage force monitoring. EUROSOIL 2008, Wien. Book of Abstracts (CD).