Data Mining Techniques for Process Development
A dissertation submitted in partial fulfillment of the requirements for the degree of D.Sc. at Hungarian Academy of Sciences
János Abonyi
Veszprém
2010
Preface
During the last decade a major shift has begun in process and chemical industry, since there was an urgent need for new tools that are able to support the optimi- sation of process operations and the development of new production technolo- gies. Approaches of this shift differ from company to company but one common feature is the requirement of the intensive communication between those who conduct research, design, manufacturing, marketing and management. Such communication should be centered on modeling and simulation due to the need of the integration of the whole product and process development chain in all time and scale levels of the company.
To explore and transfer all the useful knowledge needed to operate and op- timise technologies and the business processes, the research of the applicant aimed the development of a novel methodology to integrate heterogeneous infor- mation sources and heterogeneous models. The proposed methodology can be referred as model mining, since it is based on the extraction and transformation of information not only from historical process data but also from different type of process models. The introduction of this novel concept required the develop- ment of new algorithms and tools for model analysis, reduction and information integration. For this purpose fuzzy systems based modelling, clustering and visualization algorithms have been developed. To handle multi-objective opti- mization problems where the goals are non-commensurable and are in conflict with each other a novel interactive optimization algorithm has been worked out based on visualization tools and evolutionary algorithms.
The proposed knowledge discovery and management framework addresses important challenges in the fields of systems science, process engineering and information technology. Although the primary goal of the developments was to design new tools that can be fruitfully applied in process engineering, the development and unconventional integration of computational intelligence, data mining, and system identification algorithms resulted in useful results that can also be applied to support marketing, management, scientific research and other engineering activities.
Contents
1 Introduction 1
1.1 State-of-the-art and objectives . . . 1
1.2 Methodology . . . 4
1.3 Motivation, roadmap of the thesis . . . 6
2 Process Data Warehousing and Mining 8 2.1 Motivation . . . 8
2.2 Process Data Warehouse . . . 10
2.3 Integrated Framework for Process Development . . . 12
2.4 Conclusions . . . 15
3 Fuzzy Clustering for Regression, System Identification, and Classifier Induction 18 3.1 Fuzzy Clustering for Nonlinear Regression . . . 18
3.2 Fuzzy Clustering for Time-series Segmentation . . . 34
3.3 Fuzzy Clustering for Classifier Induction . . . 48
3.4 Fuzzy Clustering for Model Order Selection . . . 52
3.5 Conclusions . . . 61
4 Prior Knowledge based Constraints in Parameter Identification 63 4.1 Grey-Box Fuzzy Model Identification . . . 63
4.2 Prior Knowledge based Spline Smoothing . . . 72
4.3 Conclusions . . . 84
5 Improvement of Polupation based Optimization Algorithms 85 5.1 Genetic Programming for System Identification . . . 85
5.2 Interactive Optimization . . . 89
5.3 Conclusions . . . 93
A Appendix: Application Examples 94 A.1 Process Data Warehouse . . . 94
A.2 Monitoring Process Transitions by State Estimation . . . 104
A.3 Semi-mechanistic Models for Product Quality Estimation . . . 113
B Appendix: Theoretical Background 119 B.1 Introduction to Fuzzy Clustering . . . 119
B.2 Introduction to Fuzzy Modeling . . . 125
B.3 Fuzzy Model Structures for Classification . . . 129 B.4 Population Based Optimization . . . 134 B.5 Identification of Linear-in-Parameters Models . . . 141
Chapter 1 Introduction
1.1 State-of-the-art and objectives
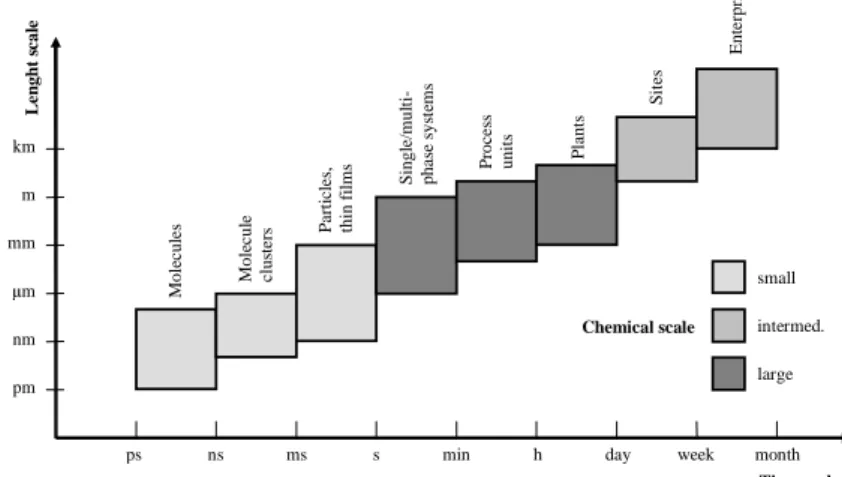
As it is emphasized by the 7th Framework Programme, it is essential to de- velop new methods to increase industrial competitiveness in order to speed up the transformation of the European economy. Hence, there is an urgent need for new tools which are able to support product and process design, and the optimization of production technologies. These tools require intensive commu- nication between design, manufacturing, marketing and management that could be centred on modelling and simulation. This goal has been already realised by engineers and directors of leading companies, e.g. DuPont and Dow Chem- ical, think that "model integrates the whole organization" (see Figure 1.1). They believe that the extensive use of models is the way that data, information, and knowledge should be conveyed from research to engineering, to manufacturing, and on to the business team [1].
Time scale
ps ns ms s min h day week month
Molecules Molecule clusters Particles, thin films Single/multi- phase systems Process units Plants Sites Enterprise
Chemical scale
small intermed.
large µm
nm mm
pm m km
Lenght scale
Figure 1.1: Time and scale levels in process engineering. Different scales define different engineering problems.
Search and research
Planning Technological department
Production Business group Process analysis Planning model Techn. model Production model Business model
Time Reaction Kinetics
Measured data
Process technology
Process control
Operational methods
Operator training
Model- predictive
control Process optimalization
Economic optimalization
ERP
Conceptual design Plant design Control impl. Procedure dev. Operator training Production Plant life-cycle
Plant construction
Knowledge
Figure 1.2: Knowledge management in "life-cycle modeling" and integrated modeling - a concept by Dow Chemical Co. Models are applied at every level of a technology and used to transfer information from conceptual design to the optimization of the production.
This led to the the idea of life-cycle modeling: integrating and connecting the model islands, which use different approaches and tools in each life-cycle phase and thus transfer the information and knowledge between the stages [2]. Figure 1.2 shows the knowledge management of life-cycle modeling by Dow Chemical, while Figure 1.3 shows its applicability in process optimization: the continuous improvement cycle centered around the integrated models [3].
The concept of life-cycle modelling is only a vision of how companies should operate in the 21st century. But instead of this there are only model islands for the time being, where isolated models are used for different and limited pur- poses on different levels of the technology (if they exist at all). These models are heterogeneous not only because they have different purposes, but also because information for the modelling and identification of the processes can be obtained from different sources: (i) mechanistic knowledge obtained from first-principles (physics and chemistry), (ii) empirical or expert knowledge, expressed as lin- guistic rules, (iii) measurement data, obtained during normal operation or from an experimental process, and different modelling paradigms should be used for an efficient utilisation of these different sources of information.
R&D
Engineering Process Concepts
Retrofit
Opera- tion MODELS
Figure 1.3: The concept of life-cycle modeling for continuous process optimiza- tion.
Figure 1.4: The proposed scheme combines expert and mechanistic knowledge and measured data in the form of rule-based systems, model structure, param- eter constrains and local models. The model is optimized to ensure booth good prediction performance and interpretability.
Therefore, the aim of the research of the applicant is to develop novel method- ologies to integrate heterogeneous information sources and heterogeneous mod- els1. The key idea is the utilization of data mining and computational intelligence techniques2 since the synergistic integration of qualitative and quantitative mod- els require tools to handle uncertain information (by fuzzy logic), systems com- plexity (by neural networks and evolutionary algorithms), and expert knowledge (by rule-based systems) (see Figure 1.4).
1The first attempt of the author to integrate these information sources is concluded in: Abonyi J, Fuzzy Model Identification for Control, Boston: Birkhauser Verlag, 2003. 273 p.,(ISBN:978-0- 8176-4238-9), Independent citatitions: 30
2Abonyi J, Feil B, Abraham A, Computational intelligence in data mining, INFORMATICA (LJUBLJANA) 29:(1) pp. 3-12. (2005), Independent citatitions: 8
Figure 1.5: Scheme of model mining. The concept is similar to data mining, but in this schemes not only historical process data but different type of models are also analysed.
1.2 Methodology
The key of the proposed approach is the integration of the existing models and information sources to explore useful knowledge. The whole process can be called model mining. This type of knowledge discovery is relatively new, its importance has only been recognized by the Global Modelling and Assimilation Office at NASA in mining of atmospheric phenomena relationships. Hence, this research is the first concentrated attempt to develop a new methodology for model mining. The proposed approach, depicted in Figure 1.5, consists of the following steps.
1. Developing and understanding of the application domain and identifying the problem.
2. Creating and pre-processing the target set. This phase starts with activi- ties in order to get familiar with the models and data, to identify problems, to get first insights into the data and models to detect interesting subsets, to form hypotheses. To support this step, the utilized models should be as transparent as possible since model transparency allows the user to effectively combine different types of information.
3. Model Mining. The ultimate goal of the whole process is to extract poten- tially useful knowledge which could not be explored from one single model or database, but only from the integrated information sources and mod- els in the model warehouse. The goals of model mining are achieved via solving following problems:
• 3.a Model Transformation and reduction: information presented by different type of models can be used to transform or reduce other models to make them more precise and/or robust, or to expand their operational range (e.g. to improve the extrapolation capability of a black-box model using a priori knowledge based constraints on the model parameters). Some of the computational intelligence mod- els lend themselves to be transformed into other model structures that allow information transfer between different models (e.g. radial
basis functions are functionally equivalent to fuzzy systems) which makes possible the combination of expert knowledge and data inten- sive modeling.
• 3.b Model Fusion: the integration of the information content of dif- ferent models is the key issue of the proposed research. During this process it should be kept in mind in what range the particular models are valid and how these local models can be combined to get global model. Information can be stored within nominal, ordi- nal, ratio or fuzzy data; images and pictures, multivariate time se- ries or documents can also be information sources [4]. Besides of these several type of models should be treated, e.g. graphs, deci- sion trees, neural networks, rule based systems, etc. Although these models need different types of reduction methods (e.g. spanning trees for graphs, pruning for decision trees, rule base reduction for fuzzy models etc.), but they can be integrated by fuzzy systems (ex- tended Takagi-Sugeno fuzzy models).
• 3.c Visualizationis a very promising field because it makes possible merging the best of computer (calculation) capabilities with the best of human perception (cognitive) abilities. There are several meth- ods to visualize multidimensional data [5, 6]. However, the visual- ization of the results of the knowledge discovery process is much more complex than the visualization of multivariate data. The world- leading companies like AT&T and Microsoft are also dealing with these problems. The common feature of the solutions is that the novel visualization methods are based on novel similarity measures.
The visualization of clustering results have been also dealt with by our research group, where a similarity of the fuzzy clusters are mea- sured. In the last three years we also developed a new measure for multivariate data based on the introduction of a particular distance measure based on the correlation of the process variables. These results illustrate that for model mining purposes there is a clear need to define tailored similarity measures according to the heterogeneous information sources (similarity of models, images, graphs etc.).
• 3.d Application of model mining algorithm(s):Selecting algorithms for searching for patterns. It is essential to involve the user or the experts into this key step because it is often very difficult to formalize the complex and many times contradictory goals. One possible solution is to increase the degree of interactivity. Such a tool will be developed in Chapter 5.
4. Interpreting and application of the mined patterns: Whereas the "knowl- edge worker" judges the success of the application of modelling and dis- covery techniques more technically, she or he contacts domain experts later in order to discuss the results and their applicability. Based on the results it can be necessary to return to any of steps 1-3 for further iteration.
Process data warehouse Process data
Initial Process knowledge
Models
Data mining tools
Simulation &
experimentation tools
Knowledge extraction Process Improvement
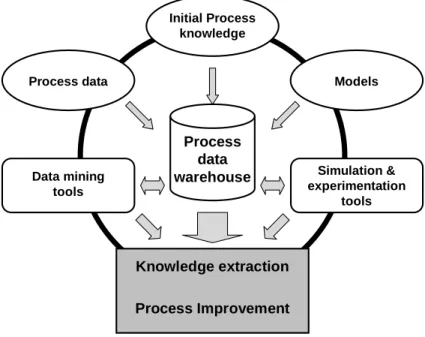
Figure 1.6: An integrated framework for process improvement.
1.3 Motivation, roadmap of the thesis
Concluding the previously described need for integration, the main motivation of the thesis is to create an integrated framework whereto data mining, modeling and simulation, experimentation tools can be incorporated. To achieve model integrity, the existing models should be reapplied, the non-existing models cre- ated, and all the models connected in an appropriate way. If it is possible to collect sufficiently large amount of data from the process, Knowledge Discov- ery in Databases (KDD) technique can be applied to extract information focused on the maintenance or control operation problems to make the production more efficient [7].
As I suggest in Figure 1.6, the information flow of such integrated method- ologies should be centered around a process data warehouse in a process im- provement cycle. Sources come from available process data, current process knowledge (rules, constraints, etc.) and an integrated global model of products, process and process control. As these information are collected in the data warehouse, data mining tools, modeling and experimentation tools can be ap- plied to aid the improvement of the process while extracting further knowledge.
All these developments and the process data warehouse, which they are centered around, were created within the research project of the Cooperative Research Centre of Chemical Engineering Institute entitled as "Optimization of multi-product continuous technologies" with implementation at the Polypropy- lene plant of Tisza Chemical Group Plc., Hungary.
According to the motivations and main goals explained above, the thesis is structured as follows: Chapter 2 describes an integrated process data ware- house with applications to product quality and operating cost estimations, while Chapter 3 presents novel clustering based data analysis tools to be able to an- alyze data queried from or transferred to the data warehouse. As shown pre- viously, process data and simulator models are linked together through exper- imentation, hence a genetic algorithm based tool for interactive process opti- mization was developed, which is detailed in Chapter 4. Till know some tools for process intensification, scaling up, control and monitoring have been worked out and implemented to demonstrate the potential impact of the developed ap- proach in technology development. The details of these application examples are presented in Appendix A. As this chapter illustrates, the results presented in this thesis can be immediately applied in the field of process engineering by de- signing tools that can support model based process and product development.
For readers not familiar with every concept and notation used in this theses the theoretical background of the contributions are briefly discussed in Appendix B.
Chapter 2
Process Data Warehousing and Mining
According to costumers’ expectations and market challenge, process industry needs to have the ability to operate complex, highly interconnected plants that are profitable and that meet quality, safety, environmental and other standards.
In ideal case this requires modeling and simulation tools, which integrate not only the whole product and process development chains, but all the process units, plants, and subdivisions of the company. These information islands are also formed at the level of the collection and analysis of historical process data, however the access to this data is limited due to the heterogeneity of the infor- mation sources (the data is generated in different places and stored in different type of databases) and due to the data is stored only in shorter periods of time.
This chapter proposes a know-how for the design and implementation of pro- cess data warehouses that integrates plant-wide information, where integration means information, location, application and time integrity. The process data warehouse contains non-violate, consistent and preprocessed historical process data and works independently from other databases operating at the level of the control system. To extract information from historical process data stored in the process data warehouse tools for data mining and exploratory data analysis have been developed.
2.1 Motivation
The increasing automation and tighter quality constraints related to production processes make the operator’s and plant engineer’s job more and more difficult.
The operators in the process industry have many tasks such as to keep the process condition as closely as possible to a given operating point, to preserve optimality, to detect failures and to maintain safety. The more heterogenous the units are the less transparent the system is. Hence, there is a need for integrated information system that solves these problems and supports process monitoring and development.
Feature Formation Recognition
Identification Decision of Tasks Planning
Association Stored Rules
Automated Action Patterns Skill-based Behavior
Rule-based Behavior Knowledge-based Behavior
Goals
Symbols
Signs
Sensory Inputs Signals Action
Figure 2.1: Three-level model of skilled human operator.
As the three-level model of the performance of skilled operators shown in Figure 2.1 suggests, such Operator Support Systems (OSS) should indicate in- tuitive and essential information on what is happening with the process and give suggestions according to operator’s experience and skills [8], [9], [10]. Hence, the OSS of complex processes should be the combination of information sys- tems, mathematical models and algorithms aimed to extract relevant information (signs, e.g. process trends and symbols) to "ease" the operator’s work. In the following the main elements of this kind of system are described.
In modern industrial technologies the existence of a distributed control sys- tem (DCS) is a basic requirement. This system is responsible for the safe op- eration of the technology in the local level. In the coordination level of the DCS many complex tasks are handled, like controller tuning, process optimization, model identification and error diagnostic. These tasks are based on process models. As new products are required to be introduced to the market over a short time scale to ensure competitive advantage, the development of process models necessitates the use of empirical based techniques, since phenomeno- logical model development is unrealizable in the time available [9]. Hence, the mountains of data that computer-controlled plants generate, must be effectively used. For this purpose most of the DCS systems are able to store operational process data. However, DCS has limited storage capacity because this is not its main function, only data logged in the last one or two months is stored in these computers. Since data measured in a longer time period have to be used for so- phisticated process analysis, quality control, and model building, it is expedient to store data in a historical database that is useful to query, group and analyze the data related to the production of different products and different grade tran- sitions. Today several software products in the market provides the capability of integration of historical process data of DCS’s: e.g. Intellution I-historian [11], Siemens SIMATIC [12], the system of Fisher-Rosemount PlantWeb [13] and the Wonderware FactorySuite 2000 MMI software package [14].
As it will be deeply described in the the case study shown in Section A.1, there are several heterogeneous information sources that have to be integrated to support the work of engineers and operators with relevant, accurate and use- ful information. In case of process systems standard data warehousing and
OLAP techniques are not always suitable for this purpose because the opera- tion units in the process industry have significant dynamical behavior that re- quires special attention contrary to the classical static business models. The source of this dynamical behavior is the dynamical effect of the transportation and mixing of material flows. Since process engineering systems rarely oper- ate on steady-state manner (process transitions, product changes significantly occur), and the control and monitoring of these dynamical transitions are the most critical tasks of the process operators, the synchronization of data taken from heterogeneous information sources of process systems requires dynamical process models. These dynamic qualities of process units and the related data sources make it unsuitable to simply apply standard OLAP techniques. Hence, as it will be presented in the following section, the integration of the historical databases of DCS’s into OSSs is not only a technical problem, in this process the special features of the technology have to be taken into account.
2.2 Process Data Warehouse
In case of complex processes the design of integrated information system is extremely important. This is is especially true in higher level of control of the process and enterprize. E.g. to monitor and control of the quality of the produc- tion (better product quality, less environmental pollution, less off-specification product etc.), data taken from different units of the production-line (e.g. qual- ity of the row materials, operating parameters of the reaction system, product quality measurements) have to be analyzed. Since there is a strong but com- plex and dynamically changing dependency among these data, there is a need to improve the classical functions and models of standard Data Warehouses to help the work of operators.
The proposedfocus on process approachmeans stronger focus on the ma- terial and information flow through the entire enterprise, where the OSS follows the process through the organization instead of focusing separate tasks of the isolated process units. This also means that most of the information moves hor- izontally within the organization, thus requiring a higher degree of cooperation and communication across the different divisions in the plant [10], [15].
This session proposes the integration of heterogeneous historical data taken from the various production units into a data warehouse with focus on the spe- cialties of the technology. The resulted model-based information system con- tains only consistent, non-violate, pre-processed, historical data [16], and it is working independently from the distributed control system (DCS). This type of data warehouse has the features presented Table 2.1, and it is called as Process Data Warehouse.
DCS relational database Process Data Warehouse Function day to day data storage decision supporting
Data actual, daily, detailed, in- cluded in relation, isolated
historical, summarized, in- tegrated, consolidated
Using iterative ad-hoc
Unit of work short, general transactions complex queries
User operator engineer, operator plant
manager Design application oriented subject oriented
Access read-write engineer, many queries Number of
accessed records
decimal order million order
Size 100 MB-GB 100 GB-TB
Degree transactional time inquiry time
Region process unit whole production line Detectable
dependen- cies (type of analysis)
static dynamic
Main elements SQL database of DCS SQL database of DCS and independent DW and com- putational unit of models
Table 2.1: The main differences between the DCS relational database and the Process Data Warehouse.
Distributed Control System (DCS) Process
Graphical User Interface
Process Control Computer OP’s
PV’s
SP’s
PV’s
SP’s CV’s PV’s
SP’s
Process level Analysis level
Data Warehouse Statistical tools
Data mining tools Model of
Reactor system Model of Advanced Process Control
Process simulator
Graphical simulator interface
PV’s
PV’s
Performance analysis Optimization techniques sSP’s, sOP’s
sCV’s SP’s
sPV’s sPV’s
SP’s
Figure 2.2: the integrated methodology of process analysis for a complex, DCS regulated process
2.3 Integrated Framework for Process Development
The developed components for an integrated information system are shown in Figure 2.2. It shows the structure of the proposed process analysis methodology for the development of a complex systems. This structure supposes that there are a DCS (with data storage functions) and a process computer in the system, so a process Data Warehouse integrated into the framework can be created and all the developed tools are centered around this data warehouse.
Process Data Warehouse. The data stored by DCS definitely have the po- tential to provide information for product and process design, monitoring and control. However, these data have limited access in time on the process control computers, since they are archived retrospectively, and can be unreliable be- cause of measurement failure or inconsistent storage. Process Data Warehouse is a data analysis-decision support and information process unit, which operates separately from the databases of the DCS. It is an information environment in contrast to the data transfer-oriented environment, which contains trusted, pro- cessed and collected data for historic data analysis. The data collected into DW directly provide input for different data mining, statistical tools, like classification, clustering, association rules, etc., and visualization techniques, e.g. quantile- quantile plots, box plots, histograms, etc. Besides these tools and techniques, DW indirectly creates a basis for optimization and system performance analysis techniques through a process simulator of the process and its advanced local control system, since models can be validated based on historic data stored in DW.
(Dynamic) Data model. Actually, data is simply a record of all business ac- tivities, resources, and results of the organization. The data model is a well- organized abstraction of that data. So, it is quite natural that the data model has become the best method to understand and manage the business of the organi- zation. Without a data model, it would be very difficult to organize the structure and contents of the data in the data warehouse [17]. The application of data and enterprize modeling (EM) is extremely important, as these models describe the organization, maps the work-processes, and thereby identifies the needs of OSS. The data model plays the role of a guideline, or plan, to implement the data warehouse. The design of a process data warehouse is based on the synchro- nization of the events related to the different information sources which requires the understanding the material, energy and information flow between the units of the plant. For this purpose not only classical data modeling techniques have to be used, but models related to the nonlinear functional relationships of the pro- cess and product variables and dynamic models that represent the dynamical behavior of these variables.
Process model. It is an integrated application of laboratory kinetics, thermo- dynamics, transport phenomena and experiments with plant scale-up param- eters embedded into different process unit models. Therefore, a multi-scale model, whose complexity depends on the current technology. Its parts can be achieved by first principle, black-box or semi-mechanistic (hybrid) modeling ap- proaches. Advanced control and monitoring algorithms of OSS are based on
state variables which are not always measurable or they are measured off-line.
Hence, for the effective application of these tools there is a need for state estima- tion algorithms that are based on the model of the monitored and/or controlled process. In the presence of additive white Gaussian noise Kalman filter provides optimal estimates of the states of a linear dynamical system. For nonlinear pro- cesses Extended Kalman Filtering (EKF) should be used [18]. The dynamic model of EKF can be a first-principle model formulated by a set of nonlinear differential equations or black-box model, e.g. a neural network (NN). Gener- ally, models used in the state estimation of process systems are formulated by macroscopic balance equations, for instance, mass or energy balances. In gen- eral, not all of the terms in these equation are exactly or even partially known.
In semi-mechanistic modeling black-box models, like neural networks are used to represent the otherwise difficult-to-obtain parts of the model. Usually, in the modeling phase it turns out which parts of the first principles model are eas- ier and which are more laborious to obtain and often we can get the so-called hybrid model structure that integrates a first-principle model with a NN model which serves as an estimator of unmeasured process parameters that are diffi- cult to model from first-principles [19]. Since this seminal paper of Psichogios, many industrial applications of these semi-mechanistic models have been re- ported, and it has been proven that this kind of models has better properties than stand-alone NN applications, e.g. in the pyrolysis of ethane [20], in indus- trial polymerization [21], and or bioprocess optimization [22]. The aim of the case study of this thesis is the examination of the applicability of such semi- mechanistic models in industrial environment, namely how this model structure can be identified and applied for state estimation in OSS.
Product model i.e. inferential model. Models that are attached to process models, hence in many applications they are not considered separately from them, but inferential product models are rather closely related to product at- tributes than to process models. For example, if the process model defines the composition of a reactor liquid phase output stream, a possible product model can estimate boiling curve of the output mixture. They can also be modeled by different approaches for proper estimation of property relationships. Formulated products (plastics, polymer composites) are generally produced from many in- gredients, and large number of the interactions between the components and the processing conditions all have the effect on the final product quality [23].
When a reliable nonlinear model is available that is able to estimate the qual- ity of the product, it can be inverted to obtain the suitable operating conditions required for achieving the target product quality [24]. If such model is incorpo- rated to the OSS, significant economic benefits can be realized. To estimate the product quality, an approximate reasoning system is needed which is capable of handling imperfect information. In the proposed structure with the integration of modeling and monitoring functions a new method is developed which based on semi-mechanistic modeling and nonlinear-state estimation was proposed for this purpose. For the identification of a neural network a spline-smoothing approach has been followed, where splines have been used to extract the desired outputs of the neural network from infrequent and noisy measurements. The results
show that the proposed process data warehousing and data mining methods are efficient and useful tools for data integration, decision support, state and product quality estimation, which tools can be useful to increase the productivity of complex technological processes.
Process Control model. It uses the designed structure of regulatory process control system, information about the controlled and the perturbed variables, possible states, and operation ranges. In case of a complex system, usually distributed control system (DCS) assures locally the secure and safe operating of the technology. It is extended by an advanced model based process control computer (Process Computer) that calculates among others the operation set points (OP’s) to DCS.
(Graphical) Interface, Front-end Tools. It handles the input-output connec- tions between process-product model, control model, data warehouse and the user. Complex process technologies are multivariable, exhibit nonlinear charac- teristics, and often have significant time delays. In this case the operator cannot easily follow and visualize what is happening in the process, so the computer should aid for visualization of the process states and their relation to the qual- ity of the final product. As the final product quality is measured in the quality control laboratory, not only WYSIWYW (What You See Is What You Want) inter- faces between the operator and the console are important but WYSIWIS (What You See Is What I See) interfaces between the operators (operators at the reac- tor, at the product formation process and at the laboratory) are needed to share the information horizontally in the organization. A data warehouse provides the base for the powerful data analysis techniques that are available today such as data mining and multidimensional analysis, as well as the more traditional query and reporting. Making use of these techniques along with process data ware- housing can result in easier access to the information the operators need for more informed decision making.
Plant operators are skilled in the extraction of real-time patterns of process data and the identification of distinguishing features (see Figure 2.1). Hence, the correct interpretation of measured process data is essential for the satis- factory execution of many computer-aided, intelligent decision support systems (DSS) that modern processing plants require. The aim of the incorporation of multivariate statistical based approaches into the OSS is to reduce the dimen- sionality of the correlated process data by projecting them down onto a lower dimensional latent variable space where the operation can be easily visualized.
These approaches use the techniques of principal component analysis (PCA) or projection to latent structure (PLS). Beside process performance monitoring, these tools can be used for system identification [24], [25], ensuring consistent production and product design [26]. The potential of existing approaches has been limited by its inability to handle more than one recipe/grade. There is, therefore, a need for methodologies from which process representations can be developed which simultaneously handle a range of products, grade and recipes [9].
In supervisory control, detection and diagnosis of faults, product quality con- trol and recovery from large operation derivations, determining the mapping from process trends to operating conditions is the pivotal task. Query and reporting analysis is the process of posing a question to be answered, retrieving rele- vant data from the data warehouse, transforming it into the appropriate context, and displaying it in a readable format. It is driven by analysts who must pose those questions to receive an answer. These tasks are quite different from data mining, which is data driven.
For particular analysis, the applicability of the integrated model depends on the applied components. It can be a soft-sensor (e.g. used product quality estimation as it is shown in Section A.3), process monitoring (e.g. state estima- tion and visualization), reasoning or reverse engineering tool (e.g. production parameter estimation), operator training/qualification (e.g. state transition opti- mization, product classification) or decision support system application.
2.4 Conclusions
In this chapter I proposed a novel know-how for the design and implementation of process data warehouses that integrates plant-wide information, where inte- gration means information, location, application and time integrity. The process data warehouse contains non-violate, consistent and preprocessed historical process data and works independently from other databases operating at the level of the control system1. I have also pointed out that such information sys- tem should also contain the model of the control system2. The details of the components of the presented information system define whether the resulted data warehouse supports soft sensors, process monitoring, reverse engineer- ing or operator training/qualification. When the simulator outputs are also stored in the DW, comparison of the simulated outputs to the real industrial data can provide further information for optimization and tuning the parameters of the control systems. This scheme results in a DW-centered continuous process im- provement cycle. Generally, the advantage of having an offline simulator of the system is that it can be used to predict product quality, estimate the state of the system and find new optimal operating points in a multi-objective environment, results of operability tests, effects of e.g. new recipes or catalyst can be investi- gated without any cost attachment or system failure, and it is easily extendable for system performance analysis tools and optimization techniques.
1Pach F P, Feil B, Nemeth S, Arva P, Abonyi J, Process-data-warehousing-based operator support system for complex production technologies, IEEE TRANSACTIONS ON SYSTEMS MAN AND CYBERNETICS PART A-SYSTEMS AND HUMANS 36: pp. 136-153. (2006), IF:
0.980, Independent citations: 4
2Balasko B, Nemeth S, Nagy G, Abonyi J, Integrated Process and Control System Model for Product Quality Control - Application to a Polypropylene Plant, Chemical Product and Process Modeling , 3:(1) pp. 1-12. Paper 50. (2008), DOI: 10.2202/1934-2659.1213
I have successfully applied the prototype of this system for estimation of product quality by a new semi-mechanistic product model extension and for the extraction of cost and energy consumption based on box-plots and quantile- quantile plots 3. To extract information from historical process data stored in the process data warehouse tools for data mining and exploratory data analysis have been developed. 4
In case of complex production processes it is often not sufficient to ana- lyze only input-output data for process monitoring purposes. The reasons may be that historical process data alone do not have enough information content, it can be incomplete, not measured frequently or not at regular intervals. In these cases it is important to obtain information about state variables; therefore (nonlinear) state estimation algorithm is needed. This phenomenon has been proved experimentally at the time-series segmentation based process monitor- ing, where the result of the segmentation was much more reliable when the es- timated state variables or the error covariance matrices computed by the state estimation algorithm have been also utilized by the segmentation algorithms5. When models of process and control systems are integrated to a process Data Warehouse the resulted structure support engineering tasks related to analysis of system performance, process optimization, operator training (OTS), reverse engineering, and form decision support (DSS) systems.
In chemical production processes it often happen that the product quality can be measured only relatively rarely or with considerable dead time (e.g. be- cause of the time demand of laboratory tests). In these situations it would be advantageous if the product quality could be estimated using a state estimation algorithm. However, due to the complexity of the production processes there are often no enough a priori knowledge to build a proper model to estimate the important, but unknown process variables6. In these cases black box models are worth applying to approximate the unknown phenomena and building into the white box model of the system. These models are called semi-mechanistic models. Such semi-mechanistic model was developed for the on-line product quality estimation in an industrial polyethylene reactor. Since in the proposed semi-mechanistic model structure a neural network is designed as a part of a nonlinear algebraic-differential equation set, there were no available direct input- output data to train the weights of the network. To handle this problem a simple, yet practically useful spline-smoothing based technique has been used7.
3Abonyi J, Application of Exploratory Data Analysis to Historical Process Data of Polyethylene Production, HUNGARIAN JOURNAL OF INDUSTRIAL CHEMISTRY 35: pp. 85-93. (2007)
4Abonyi J, Nemeth S, Vincze C, Arva P, Process analysis and product quality estimation by Self-Organizing Maps with an application to polyethylene production, COMPUTERS IN INDUS- TRY 52: pp. 221-234. (2003), IF: 0.692, Independent citations: 10
5Feil B, Abonyi J, Nemeth S, Arva P, Monitoring process transitions by Kalman filtering and time-series segmentation, COMPUTERS & CHEMICAL ENGINEERING 29: pp. 1423-1431.
(2005), IF: 1.501, Independent citations: 5
6Feil B, Abonyi J, Pach P, Nemeth S, Arva P, Nemeth M, Nagy G, Semi-mechanistic mod- els for state-estimation - Soft sensor for polymer melt index prediction, LECTURE NOTES IN ARTIFICIAL INTELLIGENCE 3070: pp. 1111-1117. (2004), IF: 0.251, Independent citations: 3
7Abonyi J, Roubos H, Babuska R, Szeifert F, Identification of Semi-Mechanistic Models with Interpretable TS-fuzzy submodels by Clustering, OLS and FIS Model Reduction. In: J Casillas,
Similary to the design of soft-sensors, the bottleneck of nonlinear model based controller design is also the modeling of the controlled system. In prac- tice, the effectiveness of nonlinear controllers is limited due to the uncertainties in model parameters, e.g. kinetic parameters, and in model structure. To cope with this problem, a semi-mechanistic model has been developed which com- bines a priori and a posteriori models in such a way that the uncertain part of the a priori model is replaced by an artificial neural network. The effectiveness of this approach has been demonstrated by the nonlinear control of a simulated continuous stirred tank reactor8.
O Cordon, F Herrera, L Magdalena (szerk.) Fuzzy modeling and the interpretability-accuracy trade-off, Heidelberg: Physica Verlag, 2003,pp. 221-248. Independent citations: 2
8Madar J, Abonyi J, Szeifert F, Feedback linearizing control using hybrid neural networks identified by sensitivity approach, ENGINEERING APPLICATIONS OF ARTIFICIAL INTELLI- GENCE 18: pp. 343-351. (2005), IF: 0.709, Independent citations: 7
Chapter 3
Fuzzy Clustering for Regression, System Identification,
and Classifier Induction
The amount of the data stored in various information systems grows very fast.
These data sets could contain hidden, potentially useful knowledge. Clustering, as a special area of data mining is, one of the most commonly used methods for discovering the hidden structure of the considered data set. The main goal of clustering is to divide objects into well separated groups in a way that objects lying in the same group are more similar to each another than to objects in other groups. In the literature several clustering and visualization methods can be found. However, due to the huge variety of problems and data sets, it is a difficult challenge to find a powerful method that is adequate for all problems. In this chapter I summarize the results I obtained at the development of problem- specific clustering algorithms.
3.1 Fuzzy Clustering for Nonlinear Regression
Fuzzy identification is an effective tool for the approximation of uncertain non- linear systems on the basis of measured data [27]. Among the different fuzzy modeling techniques, the Takagi-Sugeno (TS) model [28] has attracted most attention. This model consists of if–then rules with fuzzy antecedents and math- ematical functions in the consequent part (see Section B.2 for more details). The antecedents fuzzy sets partition the input space into a number of fuzzy regions, while the consequent functions describe the system’s behavior in these regions [29]. The construction of a TS model is usually done in two steps. In the first step, the fuzzy sets (membership functions) in the rule antecedents are deter- mined. This can be done manually, using knowledge of the process, or by some data-driven techniques. In the second step, the parameters of the consequent functions are estimated. As these functions are usually chosen to be linear in their parameters, standard linear least-squares methods can be applied.
The bottleneck of the construction of fuzzy models is the identification of the antecedent membership functions, which is a nonlinear optimization prob- lem. Typically, gradient-decent neuro-fuzzy optimization techniques are used [30], with all the inherent drawbacks of gradient-descent methods: (1) the op- timization is sensitive to the choice of initial parameters and hence can easily get stuck in local minima; (2) the obtained model usually has poor generaliza- tion properties; (3) during the optimization process, fuzzy rules may loose their initial meaning (i.e., validity as local linear models of the system under study).
This hampers the a posteriori interpretation of the optimized TS model. An al- ternative solution are gradient-free nonlinear optimization algorithms. Genetic algorithms proved to be useful for the construction of fuzzy systems [31, 32].
Unfortunately, the severe computational requirements limit their applicability as a rapid model-development tool.
Fuzzy clustering in the Cartesian product-space of the inputs and outputs is another tool that has been quite extensively used to obtain the antecedent membership functions [33, 34, 35]. Attractive features of this approach are the simultaneous identification of the antecedent membership functions along with the consequent local linear models and the implicit regularization [36]. By clus- tering in the product-space, multidimensional fuzzy sets are initially obtained, which are either used in the model directly or after projection onto the individ- ual antecedent variables. As it is generally difficult to interpret multidimensional fuzzy sets, projected one dimensional fuzzy sets are usually preferred. However, the projection and the approximation of the point-wise defined membership func- tions by parametric ones may deteriorate the performance of the model. This is due to two types of errors: the decomposition error and the approximation error. The decomposition error can be reduced by using eigenvector projection [35, 37] and/or by fine-tuning the parameterized membership functions. This fine-tuning, however, can result in overfitting and thus poor generalization of the identified model.
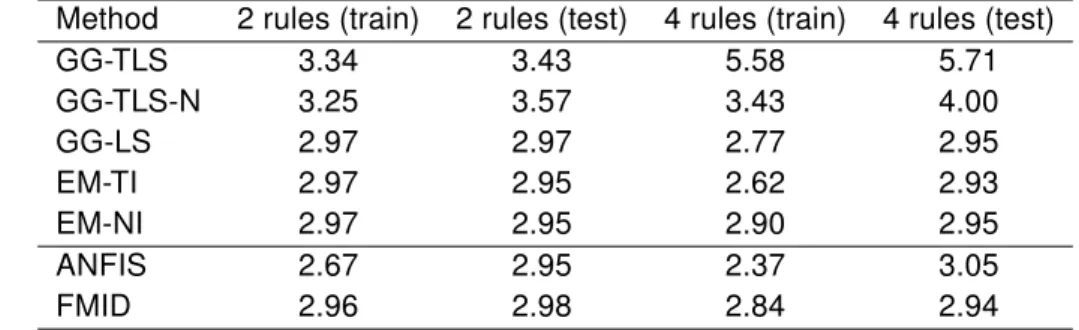
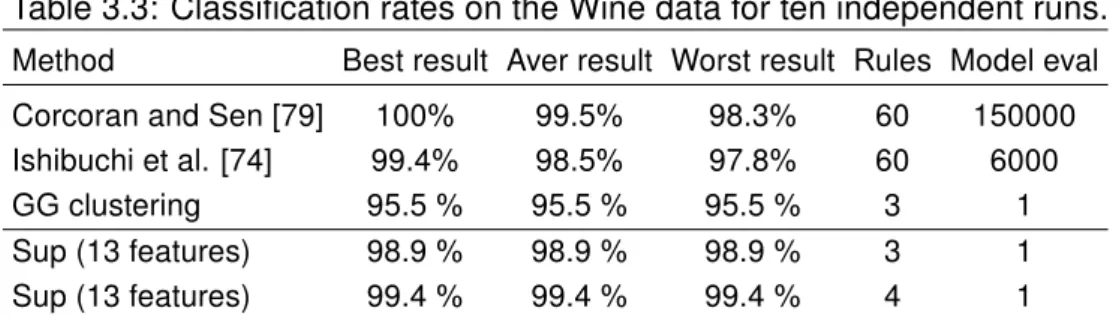
In this section, a new cluster prototype is introduced, that can easily be rep- resented by an interpretable Takagi-Sugeno (TS) fuzzy model. Similarly to other fuzzy clustering algorithms, the alternating optimization method is employed in the search for the clusters. This new technique is demonstrated on the MPG (miles per gallon) prediction problem. The obtained results are compared with results from the literature. It is shown that with the presented modified Gath–
Geva algorithm not only good prediction performance is obtained, but also the interpretability of the model improves.
Clustering based Fuzzy Model Identification
The available data samples are collected in matrixZ formed by concatenating the regression data matrixXand the output vectory:
X =
xT1 xT2 ... xTN
, y=
y1 y2
... yN
, ZT = [X y]. (3.1)
Each observation thus is ann+ 1-dimensional column vector
zk = [x1,k, . . . , xn,k, yk]T = [xTk yk]T. Through clustering, the data setZ is parti- tioned intocclusters. Thecis assumed to be known, based on prior knowledge, for instance (refer to [35] for methods to estimate or optimize c in the context of system identification). The result is a fuzzy partition matrix U = [µi,k]c×N, whose elementµi,k represents the degree of membership of the observationzk in clusteri.
Clusters of different shapes can be obtained by using an appropriate defi- nition of cluster prototypes (e.g., linear varieties) or by using different distance measures. The Gustafson–Kessel (GK) clustering algorithm has often been applied to identify TS models. The main drawbacks of this algorithm are that only clusters with approximately equal volumes can be properly identified and that the resulted clusters cannot be directly described by univariate parametric membership functions.
To circumvent these problems, Gath–Geva algorithm [38] is applied. Since the cluster volumes are not restricted in this algorithm, lower approximation error and more relevant consequent parameters can be obtained than with Gustafson–
Kessel (GK) clustering. An example can be found in [35], p. 91. The clusters ob- tained by GG clustering can be transformed into exponential membership func- tions defined on the linearly transformed space of the input variables.
Probabilistic Interpretation of Gath–Geva Clustering
The Gath–Geva clustering algorithm can be interpreted in the probabilistic frame- work. Denote p(ηi) the unconditional cluster probability (normalized such that Pc
i=1p(ηi) = 1), given by the fraction of the data that it explains;p(z|ηi)is the domain of influence of the cluster, and will be taken to be multivariate gaussian N(vi,Fi)in terms of a mean vi and covariance matrix Fi. The Gath–Geva al- gorithm is equivalent to the identification of a mixture of Gaussians that model thep(z|η)probability density function expanded into a sum over thecclusters
p(z|η) = Xc
i=1
p(z, ηi) = Xc
i=1
p(z|ηi)p(ηi) (3.2) where thep(z|ηi)distribution generated by thei-th cluster is represented by the Gaussian function
p(z|ηi) = 1 (2π)n+12 p
|F|exp µ
−1
2(z−vi)T(Fi)−1(z−vi)
. (3.3)
Through GG clustering, the p(z) = p(x, y) joint density of the response vari- able y and the regressors x is modeled as a mixture of c multivariate n + 1- dimensional Gaussian functions.
The conditional densityp(y|x)is also a mixture of Gaussian models. There- fore, the regression problem can be formulated on the basis of this probability as
y=f(x) = E[y|x] =
= Z
yp(y|x)dy=
R yp(y,x)dy
p(x) =
= Xc
i=1
£[xT 1]θi
¤p(x|ηi)p(ηi)
p(x) =
Xc
i=1
p(ηi|x)£
[xT 1]θi¤
. (3.4) Here, θi is the parameter vector of the local models to be obtained later on (Section 3.1) andp(ηi|x)is the probability that the i-th Gaussian component is generated by the regression vectorx:
p(ηi|x) =
p(ηi) (2π)n/2√
|Fxxi |exp¡
−12(x−vxi)T(Fxxi )−1(x−vxi)¢ Pc
i=1
p(ηi) (2π)n/2√
|(F)xxi |exp¡
−12(x−vix)T(Fxxi )−1(x−vxi)¢ (3.5) whereFxxis obtained by partitioning the covariance matrix Fas follows
Fi =
· Fxxi Fxyi Fyxi Fyyi
¸
(3.6) where
• Fxxi is then×nsubmatrix containing the firstnrows and columns ofFi,
• Fxyi is ann×1column vector containing the firstnelements of last column ofFi,
• Fyxi is an1×nrow vector containing the firstnelements of the last row of Fi, and
• Fyyi is the last element in the last row ofFi.
Construction of Antecedent Membership Functions
The ‘Gaussian Mixture of Regressors’ model [39] defined by (3.4) and (3.5) is in fact a kind of operating regime-based model where the validity function is chosen asφi(x) = p(ηi|x). Furthermore, this model is also equivalent to the TS fuzzy model where the rule weights in (B.26) are given by:
wi = p(ηi) (2π)n/2p
|Fxxi | (3.7)
and the membership functions are the Gaussians. However, in this case, Fxxi is not necessarily in the diagonal form and the decomposition of Ai(x) to the univariate fuzzy setsAi,j(xj)is not possible.
If univariate membership functions are required (for interpretation purposes), such a decomposition is necessary. Two different approaches can be followed.
The first one is an approximation, based on the axis-orthogonal projection ofAi(x). This approximation will typically introduce some decomposition error, which can, to a certain degree, be compensated by using global least-squares re-estimation of the consequent parameters. In this way, however, the interpre- tation of the local linear models may be lost, as the rule consequents are no longer local linearizations of the nonlinear system [40, 41].
The second approach is an exact one, based on eigenvector projection [35], also called the transformed input-domain approach [37]. Denote λi,j and ti,j, j = 1, . . . , n, the eigenvalues and the unitary eigenvectors ofFxxi , respectively.
Through the eigenvector projection, the following fuzzy model is obtained in the transformed input domain:
Ri : Ifxei,1 isAi,1(exi,1)and . . . andexi,nisAi,n(exi,n)thenyˆ=aTi x+bi (3.8) where exi,j =tTi,jxare the transformed input variables. The Gaussian member- ship functions are given by
Ai,j(exi,j) = exp Ã
−1 2
(exi,j −evi,j)2 e σi,j2
!
(3.9) with the cluster centersevi,j =tTi,jvxi and and variancesσei,j2 =λ2i,j.
Estimation of Consequent Parameters
Two least-squares methods for the estimation of the parameters in the local lin- ear consequent models are presented: weighted total least squares and weighted ordinary least squares.
• Ordinary Least-Squares Estimation
The ordinary weighted least-squares method can be applied to estimate the consequent parameters in each rule separately, by minimizing the fol- lowing criterion:
minθ 1
N (y−Xeθi)T Φi(y−Xeθi) (3.10)
where Xe = [X 1] is the regressor matrix extended by a unitary column andΦi is a matrix having the membership degrees on its main diagonal:
Φi =
µi,1 0 · · · 0 0 µi,2 · · · 0 ... ... . .. ... 0 0 · · · µi,N
. (3.11)
The weighted least-squares estimate of the consequent parameters is given by
θi =¡
XTeΦiXe¢−1
XTeΦiy. (3.12) When µi,k is obtained by the Gath–Geva clustering algorithm, the covari- ance matrix can directly be used to obtain the estimate instead of (3.12):
ai = (Fxx)−1Fxy,
bi = vyi −aTi vxi . (3.13) This follows directly from the properties of least-squares estimation [42].
• Total Least-Squares Estimation
As the clusters locally approximate the regression surface, they are n- dimensional linear subspaces of the(n+1)-dimensional regression space.
Consequently, the smallest eigenvalue of thei-th cluster covariance matrix Fiis typically in orders of magnitude smaller than the remaining eigenval- ues [35]. The corresponding eigenvector ui is then the normal vector to the hyperplane spanned by the remaining eigenvectors of that cluster:
uTi (z−vi) = 0. (3.14) Similarly to the observation vectorz = [xT y]T, the prototype vector and is partitioned as vi =
h
(vxi)T viy i
, i.e., into a vector vx corresponding to the regressor x, and a scalar viy corresponding to the output y. The eigenvector is partitioned in the same way, ui =
h
(uxi)T uyi iT
. By using these partitioned vectors, (3.14) can be written as
h
(uxi)T uyi i ³
[xT y]− h
(vxi)T viy i´T
= 0 (3.15)
from which the parameters of the hyperplane defined by the cluster can be obtained:
y= −1 uyi (uxi)T
| {z }
aTi
x+ 1
uyi (ui)T vi
| {z }
bi
. (3.16)
Although the parameters have been derived from the geometrical inter- pretation of the clusters, it can be shown [35] that (3.16) is equivalent to the weighed total least-squares estimation of the consequent parameters, where each data point is weighed by the corresponding membership de- gree.