Prediction of wheat grain yield by measuring root electrical capacitance at anthesis**
Imre Cseresnyés1* , Péter Mikó2* , Bettina Kelemen3 , Anna Füzy3 , István Parádi3 , and Tünde Takács3
1Department of Soil Physics and Water Management, Institute for Soil Sciences, 2Department of Cereal Breeding, Agricultural Institute,
3Department of Soil Biology, Institute for Soil Sciences,
Centre for Agricultural Research, ELKH, Herman Ottó út 15., H-1022 Budapest, Hungary Received March 18, 2021; accepted May 12, 2021
*Corresponding author e-mail: cseresnyes.imre@atk.hu miko.peter@atk.hu
**This work was funded by the National Research, Development and Innovation Office (NKFIH, grant number OTKA 119475), the European Union’s Horizon 2020 Research and Innovation Programme under grant agreement No. 727217 (ReMIX) and a János Bolyai Research Scholarship from the Hungarian Academy of Sciences (2018-2021).
A b s t r a c t. This methodological study evaluated the efficien- cy of predicting aboveground biomass and grain yield in field- grown winter wheat by measuring the saturation root electrical capacitance at anthesis. Three cultivars were grown over a three- year period as sole crops and intercropped with winter pea at halved wheat density. The root capacitance readings were converted into saturation root electrical capacitance using the relevant soil water content, according to an empirical function.
At plant scale, saturation root electrical capacitance at anthesis showed a significant (p < 0.001) linear regression with the total aboveground biomass (R2: 0.653-0.765) and grain yield (R2: 0.585-0.686) at maturity for each cultivar. At stand scale, both the mean saturation root electrical capacitance and shoot dry mass at anthesis and grain yield varied over the years, and were consist- ently higher for the intercrops compared to the sole crops. The relative increase in saturation root electrical capacitance due to intercropping corresponded with the changes in shoot dry mass and grain yield, especially in dry years. Saturation root electrical capacitance was significantly correlated with shoot dry mass (R2: 0.714-0.899) and grain yield (R2: 0.742-0.877) for each cultivar across all cropping systems and years. In conclusion, by mitigat- ing the soil water content effect, the measurement of saturation root electrical capacitance at anthesis is adequate to forecast grain yield and cultivar response to a changing environment.
K e y w o r d s: aboveground biomass, intercropping, nonintru- sive root methods, saturation electrical capacitance, root system size
INTRODUCTION
Larger root system size (RSS) is critical for increased early vigour and water use, it contributes to enhanced grain yield (GY) in crops (Fageria, 2013), thus emphasizing the importance of applying field root phenotyping techniques in breeding programmes (Postic et al., 2019). Nevertheless, as conventional root investigation methods are generally laborious and destructive, and the isolation of the intact root system from field soil is practically impossible, the investigation of roots is often neglected compared to those of shoots.
The measurement of root electrical capacitance (CR) is a promising, rapid in situ technique capable of screening numerous plants at different growth stages. Moreover, the sampled plants can be harvested at maturity to determine GY and can also be used for reproduction (Středa et al., 2020). The CR method was successfully applied in the field to evaluate the effect of dwarfing genes on the RSS of barley (Chloupek et al., 2006), in order to select barley and wheat genotypes for higher RSS and drought tolerance (Chloupek et al., 2010; Svačina et al., 2014; Heřmanská et al., 2015), to assess the root diversity and water use of wheat varieties (Středa et al., 2012; Nakhforoosh et al., 2014), and to esti- mate canola RSS in relation to lodging resistance (Wu and Ma, 2016). Some of these studies demonstrated significant relationships between the CR-based root size and individual GY, particularly in dry environments.
© 2021 Institute of Agrophysics, Polish Academy of Sciences
The measurement technique is based on the correla- tion between RSS variables and the CR detected between a ground electrode (inserted into the soil) and a plant elec- trode (fixed on the stem) using a low-frequency alternating current (AC) signal (Chloupek, 1972). Conceptual models consider the roots to be imperfect cylindrical capacitors, in which the amount of electric charge stored by the polar- izable membrane dielectrics depends on the root-soil interfacial area (Dalton, 1995). Even though some of the underlying biophysical principles are still unclear and there are uncertainties about the relative contribution of proximal and distal (fine) roots to the magnitude of the CR detected (Dietrich et al., 2012; Ellis et al., 2013; Cseresnyés et al., 2020; Peruzzo et al., 2020), several pot and field trials have convincingly demonstrated the efficiency of the capacitance method (Středa et al., 2020). One advantage of the tech- nique is that, as the CR value is affected not only by the size but also by the histological properties of the roots (e.g. sub- erization), the method characterizes both root physiological status and its functionality (Ellis et al., 2013; Cseresnyés et al., 2018). Even though the measured capacitance is very sensitive to soil water content (SWC), this effect can be taken into account by converting the measured CR to sat- uration (apparent) capacitance, CR*, which was detected in experiments on water-saturated soil (Cseresnyés et al., 2018). This adaptation allows us to compare the field data collected at different dates (under different SWC), which was previously considered to be a serious limitation for the capacitance technique (Chloupek et al., 2010; Středa et al., 2012). In this manner, field monitoring revealed that CR, as a proxy of root activity, peaked during flowering in maize and soybean (Cseresnyés et al., 2018). Minirhizotron and soil core studies verified that wheat root biomass and root length reached a maximum around anthesis, in parallel with the peaks of leaf area, transpiration and water use, and were also significantly correlated with stand GY (Wang et al., 2014; Yang et al., 2018; Postic et al., 2019).
A methodological field study involving three winter wheat cultivars is presented here. As intercropping sys- tems have gained increasing attention in organic farming worldwide due to more efficient, complementary resource use (Bedoussac and Justes, 2011; Lithourgidis et al., 2011), wheat-pea mixtures were tested to compare them with wheat sole crops. Focusing on wheat, RSS was assessed merely on the basis of CR* measured in situ at anthesis. The specific aims of the study were (i) to study the correlation of the individual CR* values with the total aboveground bio- mass (TAB) at maturity and also with GY for each wheat cultivar in order to validate the stand-scale results, (ii) to evaluate the effect of pea intercropping with halved wheat density on mean CR* and the corresponding GY using a stand scale over a three-year period, and (iii) to analyse the relationship between mean CR* and GY across the crop- ping systems and years. In brief, the study examined the relevance of the capacitance method in the field, or more precisely, the efficiency with which wheat grain yield may be predicted by measuring the saturation root capacitance (CR*) at anthesis under different cultivation and climatic conditions.
MATERIALS AND METHODS
The field study was conducted during three winter wheat growing seasons from 2017 to 2020 (referred to as harvest years 2018, 2019 and 2020) in a certified organic field in Martonvásár, Central Hungary (N 47°18’, E 18°47’, 109 m a.s.l.). The soil was a Haplic Chernozem (36% sand, 41%
silt, 23% clay) with a pH value of 7.66, 1.61% CaCO3, 3.22%
humus, 1887/361/445 mg kg-1 total N/P/K and 0.309 cm3 cm-3 water content at field capacity. The climate is continen- tal with a mean (1987-2016) annual temperature of 11.0°C (January: –1.0°C, July: 21.2°C) and annual precipitation of 548 mm, of which 193 mm falls during the main crop growing season (March-June; Fig. 1). There were optimal rainfall conditions in 2018. By contrast, late-winter and
Fig. 1. Monthly rainfall (mm, columns) and mean air temperature (°C, lines) at the experimental site (Martonvásár, Hungary) during the winter wheat growing seasons. The long-term (1987–2016) average is displayed as a reference.
spring droughts occurred in the next two seasons with suf- ficient precipitation only occurring from early May (flower- ing stage) in 2019 and from late May (milk stage) in 2020.
Winter wheat (Triticum aestivum L.) cultivars ‘Mv Nádor’ (“N”) and ‘Mv Kolompos’ (“K”) and the YQCCP composite population (“C”) were sown in October each year in 6 × 1 m plots with 12 cm row spacing as sole crops (“0”) at a density of 300 seeds m-2, and at half that densi- ty (150 seeds m-2) intercrops (“P”) with winter pea (Pisum sativum L., cv. Aviron; 50 seeds m-2). The three replications of each treatment were randomly arranged in the same field, with each one being surrounded by a 1 m border strip, but in slightly different places each year. Natural fertilizers and artificial chemicals were not used directly, which latter is even banned in organic agriculture.
At the time of anthesis (in early to mid-May, depending on the cultivar and year) 15 wheat plants were randomly selected from the inner rows of each plot. SWC was mea- sured in the 0-12 cm layer 5 cm away from each sample plant (equal to the depth and position of the CR ground electrode) with a calibrated CS620 portable TDR meter (Campbell Sci. Ltd., Loughborough, UK). The relative water saturation (θrel) value was calculated by dividing the measured volumetric SWC values (cm3 cm-3) by the predetermined saturation water content of 0.476 cm3 cm-3 (Cseresnyés et al., 2018). Thereafter, parallel CR was recorded for the selected plants with a U1733C handheld LCR meter (Agilent Co. Ltd., Penang, Malaysia) at 1 kHz, 1 V AC. The ground electrode was a stainless steel rod 15 cm in length and 6 mm in diameter (303S31; RS Pro GmbH., Gmünd, Austria), pushed vertically into the soil 5 cm from the stem to a depth of 12 cm. The plant electrode was clamped to all of the basal parts of the plant 15 mm above the soil (Svačina et al., 2014) after smearing them with conductivity gel. In order to eliminate the SWC effect, all of the CR data were converted into CR*, according to the empirical function: CR* = CR 5.807e-1.775θrel, using the rele- vant θrel values (for a detailed calculation, see Cseresnyés et al., 2018).
After the CR measurements were complete, five ran- domly selected wheat plants per plot were cut at ground level, and oven-dried at 70°C until a constant weight was achieved in order to determine shoot dry mass (SDM;
±0.001 g). In the last year (2020) the plants chosen for measuring CR were individually tagged. At maturity (in early July), the tagged plants were hand harvested and oven-dried to determine TAB, after which they were hand threshed to obtain plant GY. Thereafter, the plots were har- vested mechanically, and the wheat grains were separated from the peas and weighed. The mean plant GY was deter- mined for each plot on the basis of wheat seedling density.
The data were analysed with Statistica 13.0 software (StatSoft Inc., Tulsa, OK, USA). The unpaired t-test or one-way ANOVA with Tukey’s posthoc test was performed to compare the means of CR*, SDM and GY (p < 0.05).
If the F-test or Bartlett’s test indicated unequal variances, Welch’s t-test or Kruskal-Wallis with Dunn’s posthoc test was used. Linear regression analysis was applied to relate CR* to TAB, SDM and GY. The resultant regressions were compared using a linear analysis of covariance (ANCOVA).
RESULTS
SWC and thus CR were found to be highly variable between years and between the dates of anthesis of the cul- tivars (Table 1). In 2019, a very high SWC was recorded due to heavy rains in May. As the ANOVA showed no sig- nificant differences in mean CR* (n = 15) between the three replicate plots, the data were pooled within each cropping system and year (n = 45) for further analysis.
There were notably significant linear relationships between CR* measured at anthesis and TAB measured at maturity in 2020 (R2 = 0.653-0.765, F: 81.1-140, p < 0.001;
Fig. 2a), and between CR* and GY (R2: 0.585-0.686, F:
60.8-94.0, p < 0.001; Fig. 2b) for all three wheat culti- vars. ANCOVA indicated significant differences (p < 0.01) between the cultivars for both the CR*-TAB and CR*-GY regressions, with the smallest x-intercept for ‘Mv Nádor’.
Table 1. Relative soil water saturation (θrel, mean±SD, n = 45) and root electrical capacitance (CR, mean±SD, n = 45) measured at anthesis over a three-year period for wheat cultivars ‘Mv Nádor’ (N) and ‘Mv Kolompos’ (K) and the YQCCP composite population (C) grown as a sole crop (N0, K0, C0) or intercropped with pea (NP, KP, CP) in an organic field in Martonvásár, Hungary between 2018-2020. θrel was the ratio of the detected volumetric soil water content (SWC) to saturation water content (0.476 cm3 cm-3)
Treatment 2018 2019 2020
θrel CR (nF) θrel CR (nF) θrel CR (nF)
N0 0.327±0.019 2.60±0.31 0.730±0.031 5.20±0.73 0.199±0.015 1.99±0.28
NP 0.331±0.022 2.86±0.31 0.739±0.030 6.98±0.54 0.199±0.015 2.90±0.27
K0 0.334±0.019 3.54±0.36 0.640±0.029 5.79±0.73 0.197±0.014 2.46±0.34
KP 0.330±0.016 4.16±0.34 0.627±0.034 6.85±0.72 0.196±0.016 3.57±0.32
C0 0.288±0.028 3.08±0.40 0.837±0.032 8.29±1.19 0.264±0.020 2.69±0.40
CP 0.292±0.027 3.93±0.38 0.834±0.033 9.84±1.11 0.260±0.020 4.09±0.42
The mean CR* ranged from 8.10 to 14.94 nF (Fig. 3a).
The ANOVA showed a significant year effect in most cases, especially in 2020: CR* decreased in the sole wheats but increased in the intercrops. According to the t-test, CR* was significantly higher in mixtures compared to the sole crops for each cultivar and year. Plants harvested at anthesis pre- sented an SDM ranging from 2.33 to 3.72 g (Fig. 3b). The year had an influence on SDM in some treatments, which was reflected in the CR* results. SDM was consistently high- er in the intercrops than in the corresponding sole crops, the only exception being ‘Mv Nádor’ in 2018. The differences were significant for each cultivar in 2019 and even more so in 2020. The mean GY (calculated from the total plot grain mass) ranged from 1.69 to 3.65 g per plant (Fig. 3c). The year had a similar influence on GY as that observed for the CR* values; however, the effect proved to be insignificant in all cases due to the small number of repetitions (n = 3).
The GY of intercropped wheat plants was always higher in comparison to their sole-cropped counterparts; the differ- ence was significant in many cases, particularly in 2020.
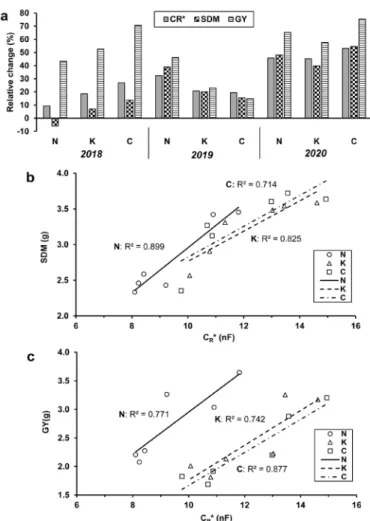
CR*, SDM and GY were 9.3-53.0, 7.0-54.6 and 14.9- 75.4% higher, respectively, in the half-density mixtures than in the wheat monocultures (Fig. 4a). Again, the excep- tion was ‘Mv Nádor’ which exhibited a 6.0% lower SDM in
the intercrop in 2018. The tendency observed for changes in CR* was in good accordance with the degree of culti- var response to intercropping in various years, including the reverse ranking of responsiveness in 2018 versus 2019.
In 2018, the relative changes in GY due to intercropping were much higher than those in CR* and SDM. By contrast, CR* seems to be a more reliable predictor of the alteration in biomass and yield over the next two years. Significant linear relationships were found between CR* and SDM (R2: 0.714-0.899, F: 9.96-35.6, p < 0.05, Fig. 4b), and between CR* and GY (R2: 0.742-0.877, F: 11.5-28.4, p <
0.05, Fig. 4c) for each wheat cultivar when the data were pooled across cropping systems and years (n = 6).
DISCUSSION
The CR* value proved to be closely correlated with GY per plant in 2020, when the weather was dry until the wheat anthesis stage, with only 55% of the long-term average rainfall from March to May. Previous field studies showed significant relationships between the capacitance-based RSS and GY in dry environments, with an R2 value of 0.29- 0.42 (p < 0.05) for wheat (Středa et al., 2012; Heřmanská et al., 2015), and 0.21-0.23 (p < 0.05) for barley (Chloupek et al., 2006; Svačina et al., 2014). Moreover, Chloupek et al. (2010) reported an R2 value of 0.63 (p < 0.05) for barley in a very dry year. Nevertheless, the correlation was insig- nificant on occasion (R2: 0.11-0.14) under sufficient water conditions, or it was even negative (R: -0.46, p < 0.05) for wheat in certain locations in a high-yielding year (Středa et al., 2012).
In the present field study higher R2 values (0.585-0.686) were obtained for the CR*-GY regressions, in spite of the rainy weather conditions prevailing during the grain-filling period. This result was most likely due to the use of CR*, which improved the reliability of measurements by mitigat- ing the effect of variations in SWC. The soil moisture of the plant root zone had a significant positive exponential rela- tionship with the relevant CR for each wheat cultivar (R2: 0.263-0.422, p < 0.001, data not shown). The significant cultivar effect on the regression, which may be explained by the relatively short phenotype of ‘Mv Nádor’, indicates that capacitance data may have limited applicability for the comparison of cultivars possessing different morphological properties. As a polygenic trait, GY is controlled by many cofactors beside RSS, however, a greater root system gen- erally leads to improved GY under conditions with limited moisture and/or nutrients (Fang et al., 2017).
The close correlation between CR* and TAB (R2: 0.653-0.765) is partially attributable to the close allometry between root and shoot biomass in monocots such as wheat (Wang et al., 2014), and also, to the size-dependent con- tribution of the stem portion between the soil surface and the plant electrode to the measured capacitance (Dietrich et al., 2012; Cseresnyés et al., 2020). Chloupek et al. (2006) found a weaker relationship between the aboveground Fig. 2. Relationships between the saturation root electrical capaci-
tance (CR*, nF) at anthesis, and (a) the total aboveground biomass (TAB, g) at maturity, and (b) grain yield per plant (GY, g) for sole- cropped wheat cultivars ‘Mv Nádor’ (N) and ‘Mv Kolompos’ (K) and the YQCCP composite population (C) grown in an organic field in Martonvásár, Hungary in 2020. Regressions were signifi- cant at the p < 0.001 level (n = 45).
biomass and CR for barley (R2 = 0.42, p < 0.05). CR* was found to be more closely correlated with TAB than with GY. The reason for this is that the majority of resources are translocated to the grain after the flowering stage, which means that GY is more influenced by post-anthesis condi- tions (Fageria, 2013), for instance, a sufficient water supply in the present case. The spring drought periods in 2019 and 2020 did not coincide with grain filling, which is a very drought-sensitive stage of wheat growth (Fageria, 2013).
The present experiment generally showed higher CR* values as well as higher SDM and GY per plant in inter- cropped wheat than in the monoculture. In replacement wheat-legume intercrops the cereal is able to compensate for reduced sowing density with increased tillering, grain number and grain weight due to the improved exploitation of growth resources (Bedoussac and Justes, 2011; Monti et al., 2016). The degree of wheat response to half-density intercropping was affected by the cultivar and year of the presented study. The data in the literature suggest that the productivity of cereal-legume mixtures depends on sever- al factors, including their genotypes, cropping design, and relative mixing proportions, as well as cultivation, soil and
climatic conditions (Klimek-Kopyra et al., 2018). A com- parison between the three wheat cultivars showed that the relative increase in CR* due to intercropping gave a reason- able estimate of the magnitude of changes in SDM and GY in 2019 and 2020. The substantially higher increments in GY compared to those of CR* and SDM in 2018 can prob- ably be attributed to the optimal rainfall patterns during the main wheat growing season. Under these conditions, the weaker intraspecific competition arising from the halved sowing density may allow wheat to allocate more assimi- lates to aboveground parts, including grains, but without a markedly enhanced RSS (Mariotti et al., 2009).
On a stand scale CR* values were found to be closely correlated with the SDM (R2: 0.714-0.899) and GY (R2: 0.742-0.877) of the cultivars for all cropping designs and years. In a similar manner, Chloupek et al. (2010) obtained an R2 value of 0.60 for the correlation between measured CR and barley GY in a four-year study. The application of CR* therefore seems to have been effective in the present case, particularly in this case considering that the soil was extremely wet at wheat anthesis in 2019, resulting in a much (even 2-3-fold) higher CR being recorded.
Fig. 3. (a) Saturation root electrical capacitance (CR*, mean±SD, n = 45) at anthesis, (b) shoot dry mass per plant (SDM, mean±SD, n = 15) at anthesis, and (c) grain yield per plant (GY, mean ± SD, n = 3, calculated from plot grain mass) for wheat cultivars ‘Mv Nádor’ (N) and ‘Mv Kolompos’ (K) and the YQCCP composite population (C) grown as a sole crop (0) or intercropped with pea (P) in an organic field in Martonvásár, Hungary between 2018-2020. Different lower-case letters above the columns indicate significant differences within a cultivar based on treatment combinations (p < 0.05) between the years. Asterisks show statistical differences (*p
< 0.05, **p < 0.01, ***p < 0.001, NS: non-significant) between the cultivar sole crop and the corresponding intercrop in a given year.
CONCLUSIONS
1. This study demonstrated that the saturation root electrical capacitance calculated from root electrical capac- itance and the relevant soil water content values measured at wheat anthesis was fairly predictive of individual total aboveground biomass and grain yield data under field conditions.
2. It was found that saturation root electrical capaci- tance may be used to forecast grain yield in the flowering stage for all of the years studied, even if the soil moisture is variable.
3. The assessment of root size on the basis of saturation root electrical capacitance indicates the different respons- es of wheat genotypes to altered climatic and cultivation conditions.
4. The in situ measurements may provide valuable contributions to crop breeding programmes targeting the selection of cultivars with improved adaptability to chang- ing environments.
Conflict of interest: The authors declare that they have no conflict of interest.
REFERENCES
Bedoussac L. and Justes E., 2011. A comparison of commonly used indices for evaluating species interactions and inter- crop efficiency: Application to durum wheat-winter pea intercrops. Field Crops Res., 124, 25-36. https://doi.
org/10.1016/j.fcr.2011.05.025
Chloupek O., 1972. The relationship between electric capaci- tance and some other parameters of plant roots. Biol.
Plantarum, 14, 227-230.
https://doi.org/10.1007/bf02921255
Chloupek O., Dostál V., Středa T., Psota V., and Dvořáčková O., 2010. Drought tolerance of barley varieties in relation to their root system size. Plant Breeding, 129, 630-636.
https://doi.org/10.1111/j.1439-0523.2010.01801.x
Chloupek O., Forster B.P., and Thomas W.T.B., 2006. The effect of semi-dwarf genes on root system size in field- grown barley. Theor. Applied Gen., 112, 779-786. https://
doi.org/10.1007/s00122-005-0147-4
Fig. 4. (a) Relative changes in the saturation root electrical capacitance (CR*) at anthesis, shoot dry mass per plant (SDM) at anthesis, and grain yield per plant (GY) as an effect of pea intercropping for wheat cultivars ‘Mv Nádor’ (N) and ‘Mv Kolompos’ (K) and the YQCCP composite population (C) grown in an organic field in Martonvásár, Hungary between 2018-2020. The relationships between CR* and (b) SDM or (c) GY for the wheat cultivars are shown above. For each cultivar, data were pooled for the two cropping systems and three years (n = 6). Regressions were significant at the p < 0.05 level.
Cseresnyés I., Szitár K., Rajkai K., Füzy A., Mikó P., Kovács R., and Takács T., 2018. Application of electrical capaci- tance method for prediction of plant root mass and activity in field-grown crops. Front. Plant Sci., 9, 93. https://doi.
org/10.3389/fpls.2018.00093
Cseresnyés I., Vozáry E., and Rajkai K., 2020. Does electrical capacitance represent roots in the soil? Acta Physiol. Plant., 42, 71. https://doi.org/10.1007/s11738-020-03061-9 Dalton F.N., 1995. In-situ root extent measurements by electrical
capacitance methods. Plant Soil, 173, 157-165. https://doi.
org/10.1007/bf00155527
Dietrich R.C., Bengough A.G., Jones H.G., and White P.J., 2012. A new physical interpretation of plant root capaci- tance. J. Exp. Bot., 63, 6149-6159. https://doi.org/10.1093/
jxb/ers264
Ellis T., Murray W., Paul K., Kavalieris L., Brophy J., Williams C., and Maass M., 2013. Electrical capacitance as a rapid and non-invasive indicator of root length. Tree Physiol., 33, 3-17. https://doi.org/10.1093/treephys/tps115 Fageria N.K., 2013. The Role of Plant Roots in Crop Production.
CRC Press, Boca Raton, FL, USA.
Fang Y., Du Y., Wang J., Wu A., Qiao S., Xu B., Zhang S., Siddique K.H.M., and Chen Y., 2017. Moderate drought stress affected root growth and grain yield in old, modern and newly released cultivars of winter wheat. Front. Plant Sci., 8, 672. https://doi.org/10.3389/fpls.2017.00672 Heřmanská A., Středa T., and Chloupek O., 2015. Improved
wheat grain yield by a new method of root selection. Agron.
Sustain. Dev., 35, 195-202.
https://doi.org/10.1007/s13593-014-0227-4
Klimek-Kopyra A., Zając T., Oleksy A., and Kulig B., 2018.
Biological and production responses of intercropped plants of pea, spring wheat, and linseed. Acta Agrobotanica, 71, 1737. https://doi.org/10.5586/aa.1737
Lithourgidis A.S., Vlachostergios D.N., Dordas C.A., and Damalas C.A., 2011. Dry matter yield, nitrogen content, and competition in pea-cereal intercropping systems. Eur. J.
Agron., 34, 287-294.
https://doi.org/10.1016/j.eja.2011.02.007
Mariotti M., Masoni A., Ercoli L., and Arduini I., 2009. Above- and below-ground competition between barley, wheat, lupin and vetch in a cereal and legume intercropping sys- tem. Grass Forage Sci., 64, 401-412. https://doi.
org/10.1111/j.1365-2494.2009.00705.x
Monti M., Pellicanò A., Santonoceto C., Preiti G., and Pristeri A., 2016. Yield components and nitrogen use in cereal-pea intercrops in Mediterranean environment. Field Crops Res., 196, 379-388. https://doi.org/10.1016/j.fcr.2016.07.017
Nakhforoosh A., Grausgruber H., Kaul H-P., and Bodner G., 2014. Wheat root diversity and root functional characteriza- tion. Plant Soil, 380, 211-229. https://doi.org/10.1007/
s11104-014-2082-0
Peruzzo L., Chou C., Wu Y., Schmutz M., Mary B., Wagner F.M., Petrov P., Newman G., Blancaflor E.B., Liu X., Ma X., and Hubbard S., 2020. Imaging of plant current path- ways for non-invasive root phenotyping using a newly developed electrical current source density approach. Plant Soil, 450, 567-584.
https://doi.org/10.1007/s11104-020-04529-w
Postic F., Beauchêne K., Gouache D., and Doussan C., 2019.
Scanner-based minirhizotrons help to highlight relations between deep roots and yield in various wheat cultivars under combined water and nitrogen deficit conditions.
Agronomy, 9, 297.
https://doi.org/10.3390/agronomy9060297
Středa T., Dostál V., Horáková V., and Chloupek O., 2012.
Effective use of water by wheat varieties with different root system sizes in rain-fed experiments in Central Europe.
Agric. Water Manag., 104, 203-209. https://doi.
org/10.1016/j.agwat.2011.12.018
Středa T., Haberle J., Klimešová J., Klimek-Kopyra A., Středová H., Bodner G., and Chloupek O., 2020. Field phenotyping of plant roots by electrical capacitance – a standardized methodological protocol for application in plant breeding: a review. Int. Agrophys., 34, 173-184. htt- ps://doi.org/10.31545/intagr/117622
Svačina P., Středa T., and Chloupek O., 2014. Uncommon selection by root system size increases barley yield. Agron.
Sustain. Dev., 34, 545-551.
https://doi.org/10.1007/s13593-013-0160-y
Wang C., Liu W., Li Q., Ma D., Lu H., Feng W., Xie Y., Zhu Y., and Gou T., 2014. Effects of different irrigation and nitro- gen regimes on root growth and its correlation with above-ground plant parts in high-yielding wheat under field conditions. Field Crops Res., 165, 138-149. https://doi.
org/10.1016/j.fcr.2014.04.011
Wu W. and Ma B-L., 2016. A new method for assessing plant lodging and the impact of management options on lodging in canola crop production. Sci. Reports, 9, 31890. https://
doi.org/10.1038/srep31890
Yang B., Wang P., You D., and Liu W., 2018. Coupling evapo- transpiration partitioning with root water uptake to identify the water consumption characteristics of winter wheat:
A case study in the North China Plain. Agric. Forest Meteorol., 259, 296-304.
https://doi.org/10.1016/j.agrformet.2018.05.017